Project 1 - Parsing NASA thermodynamic data
Parsing NASA thermodynamic data
Aim: To Write a code in MATLAB to Parsing NASA thermodynamic data for 53 species.
Objective: Is to
1. Write a function that extracts the 14 co-efficients and calculates the enthalpy, entropy and specific heats for all the species in the data file. You will be reading this file NASA thermodynamic data. The formulae are shown below.
Here R is the universal gas constant, T is the temeprature
2. Calculate the molecular weight of each species and display it in the command window.
3. Plot the Cp, Enthalpy and Entropy for the local temperature range (low temperature : high temperature) specific for each species.
4. Save the plots as images with appropriate names and dump them in separate folders for each species with suitable name. All these should be generated automatically.
5. The main program that you will submit will just take the "THERMO.dat" file as an input and generate Cp, H and S plots.
6. Please write a detailed report to describe your logic.
Introduction:
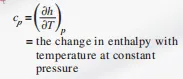
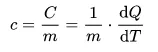
1. Specific heat: Specific heat is defined as the amount of energy needed to increase the temperature of a unit mass of a substance by one degree.
The specific heat is defined as the energy required to raise the temperature of a unit mass of a substance by one degree. In general, this energy depends on how the process is executed. In thermodynamics, we are interested in two kinds of specific heats
specific heat at constant volume cv
specific heat at constant pressure cp.
Physically, the specific heat at constant volume cv can be viewed as the energy required to raise the temperature of the unit mass of a substance by one degree as the volume is maintained constant.
The energy required to do the same as the pressure is maintained constant is the specific heat at constant pressure cp.
The specific heat at constant pressure cp is always greater than cv because at constant pressure the system is allowed to expand and the energy for this expansion work must also be supplied to the system.
2. Enthalpy: Enthalpy is a property of a thermodynamic system, defined as the sum of the system's internal energy and the product of its pressure and volume, H = U + pV. It is a convenient state function standardly used in many measurements in chemical, biological, and physical systems at a constant pressure.
The enthalpy H of a thermodynamic system is defined as the sum of its internal energy U and the work required to achieve its pressure and volume
H = U + pV,
where p is pressure, and V is the volume of the system.
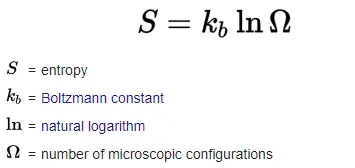
3. Entropy: Entropy, the measure of a system's thermal energy per unit temperature that is unavailable for doing useful work. Because work is obtained from ordered molecular motion, the amount of entropy is also a measure of the molecular disorder, or randomness, of a system.
Matlab Code explanation:
1. From the given problem. we have to extract temperature data of global and local, total 14 coefficients for each species. total species are 53.
2. we have calculate the enthalpy, entropy and specific heats for all the species in the data file.
3. Plot the Cp, Enthalpy and Entropy for the local temperature range (low temperature : high temperature) specific for each species.
4. Store every species data in separate folder and that folder name should be species name.
5. Calculate the molecular weight of each species and display it in the command window.
file_1 = fopen('THERMO.DAT','r'); % reading file name where all data is stored The first form of the fopen function opens the named file with the specified mode.
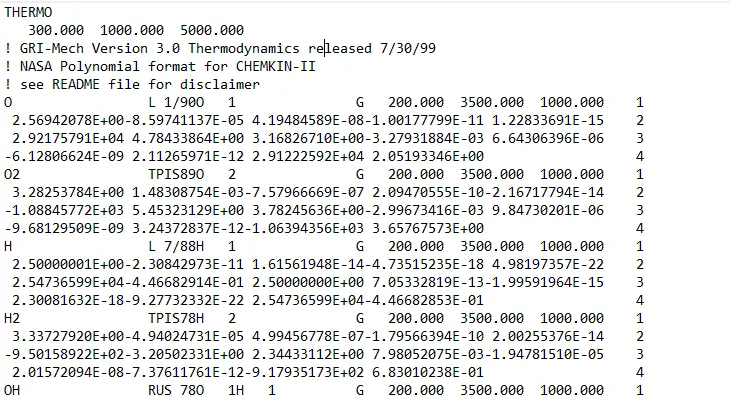
From above fig. we can see that it contains all data which is asked in the problem.
Title_file_1 = fgetl(file_1); % Readign title of file. every time if we use 'fgetl' it will read next line of previous 'fgetl' line. suppose if we used fgetl first time then it will read first line , and in any where in the code if we use the 'fgetl' then it will reade 2nd line.
temp_G_line = fgetl(file_1); % Reading Global temperature data.
temp_line_split = strsplit(temp_G_line); %Split the string str using the delimiters specified by del and return a cell string array of substrings.
% If a delimiter is not specified the string is split at whitespace. so we will see the line data in the for of cell array which is splits at every whitespace in the form of string.
% Convert string data to number data for temperature.
temp_low_global = str2num(temp_line_split{2})
temp_mid_global = str2num(temp_line_split{3})
temp_high_global = str2num(temp_line_split{4})
fgetl(file_1); % Reading all unnecessary data after temperature for 3 times
fgetl(file_1);
fgetl(file_1);
% temp_L_line = fgetl(file_1) % Reading local temperature dada
% temp_line_split = strsplit(temp_L_line) %Split the string str using the delimiters specified by del and return a cell string array of substrings.
mkdir thermodynamic_properties % to store species data we are creating folder and name as thermodynamic_properties before going to for loop.
for k = 1:53 % crwating loop for 53 times because we have 53 species in the Data file.
temp_L_line = fgetl(file_1) % Reading local temperature dada

temp_line_split = strsplit(temp_L_line,' ') %Split the string str using the delimiters specified by del and return a cell string array of substrings. So that we cell array with string data is created shown in the below.
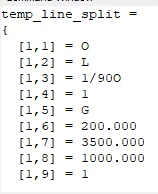
species_name = (temp_line_split(1)) % Extract species name which is first cell array for every species
species_name_each(k,:) = species_name; store species data for every cylce in column array.
last_num = str2num(temp_line_split{end}); % convert string to number by using 'srt2num' of of splited temp line data
if last_num == 1 % if last number is 1 then i will convert all last 3 string data to number and those data will stores as a local temperature low , mid and high.
temp_low_local = str2num(temp_line_split{end- 3}) % local low temperature place for all species is end of the line - 3 times.
temp_high_local = str2num(temp_line_split{end-2}) % similarly end - 2 is local higth temperature
temp_mid_local = str2num(temp_line_split{end- 1}) % end - 1 is local mid temperature
element_temp(1:3)=[temp_low_local, temp_high_local, temp_mid_local]; % all local temperatures are stored in element temp as 1X3 matrix
end
local_temp_elements(k,:)=element_temp; % for every cycle local temperatures are stored in Local_temp_elements in the form of K x 3.
In oder to extract 14 coefficient. first 2 lines are same data length and 3rd lines is diffrent
so for the first 2 lines we have 5 coeffecients in each line.
for i = 1:2 % repeating the loop for 2 times
coefficient_line = fgetl(file_1); % reading line for coeffecients
coefficients_E = strfind(coefficient_line,'E'); finding the string "E" in coeffecient line in terms of position
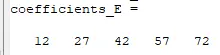
so in line "E" is presnt in 12 27 42 57 72th position. this is same for all the first 2 lines of species
a = coefficient_line(1:coefficients_E(1)+3); % store first string coefficient in a. ie in coefficient_line 1 to coefficients_E(1)+3 is the first string. where coefficients_E(1) is 12 term and add 3 terms to reade first coefficient.
a1_and_6(i) = str2num(a); % convert string to number and store in a1
for j = 1:4 % for remaining 4 can reade by using loop running 4 times
b = coefficient_line(coefficients_E(j)+4:coefficients_E(j+1)+3); Here coefficients_E(j)+4 to coefficients_E(j+1)+3) is 2nd coeffecient. coefficients_E(j)+4 is starting terms of 2nd coeff. and coefficients_E(j+1)+3) is ending term of 2nd term when j = 1
b1(j) = str2num(b); % convert string to number and store in b1(j) for 4 cycles

end
extract data from b1 for a2 to a5 for first run of i loop and a7 to a 10 for 2nd run of i loop
a2_and_7(i) = b1(1);
a3_and_8(i) = b1(2);
a4_and_9(i) = b1(3);
a5_and_10(i) = b1(4);
end
extract all coefficients.
a1 = a1_and_6(1) a1 is first data of a1_and_6 and similarly for all.
a2 = a2_and_7(1)
a3 = a3_and_8(1)
a4 = a4_and_9(1)
a5 = a5_and_10(1)
a6 = a1_and_6(2)
a7 = a2_and_7(2)
a8 = a3_and_8(2)
a9 = a4_and_9(2)
a10 = a5_and_10(2)
similarly reade and extract data for last line of every species.
coefficient_line3 = fgetl(file_1);
coefficients_E3 = strfind(coefficient_line,'E');
a_3 = coefficient_line3(1:coefficients_E3(1)+3);
a11 = str2num(a_3)
a_3 = coefficient_line3(coefficients_E3(1)+4:coefficients_E3(2)+3);
a12 = str2num(a_3)
a_3 = coefficient_line3(coefficients_E3(2)+4:coefficients_E3(3)+3);
a13 = str2num(a_3)
a_3 = coefficient_line3(coefficients_E3(3)+4:coefficients_E3(4)+3);
a14 = str2num(a_3)
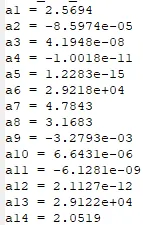
Store coefficients for every species
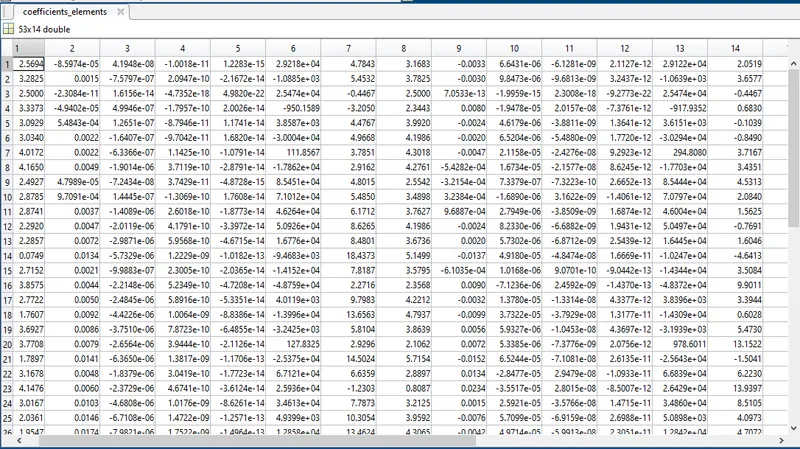
coefficients = [a1,a2,a3,a4,a5,a6,a7,a8,a9,a10,a11,a12,a13,a14];
coefficients_elements(k,:) = coefficients;
%calculate Enthalpy, Entropy, Specific heat,calculation for high and low temperatures
% For High temperature
T_H(k,:) = linspace(local_temp_elements(k,3),local_temp_elements(k,2),800);
% universal gas constant value
R = 8.3145; %J/mol*K (units)
Cp_H = ((a1 + a2.*T_H + a3.*T_H.^2 + a4.*T_H.^3 + a5.*T_H.^4))*R;
H_H = ((a1+ a2.*T_H/2 + a3.*(T_H.^2)/3 + a4.*(T_H.^3)/4 + a5.*(T_H.^4)/5 + a6./T_H)).*(R*T_H);
S_H = ((a1*log(T_H) + a2.*T_H + a3.*(T_H.^2)/2 + a4.*(T_H.^3)/3+ a5.*(T_H.^4)/4 + a7))*R;
% For Low temperature
T_L(k,:) = linspace(local_temp_elements(k,1),local_temp_elements(k,3),800);
Cp_L = ((a8 + a9.*T_L + a10.*T_L.^2 + a11.*T_L.^3 + a12.*T_L.^4))*R;
H_L = ((a8+ a9.*T_L/2 + a10.*(T_L.^2)/3 + a11.*(T_L.^3)/4 + a12.*(T_L.^4)/5 + a13./T_L)).*(R*T_L);
S_L = ((a8*log(T_L) + a9.*T_L + a10.*(T_L.^2)/2 + a11.*(T_L.^3)/3+ a12.*(T_L.^4)/4 + a14))*R;
% Plot for temperature vs Enthalpy
figure(1)
plot(T_H(k,:),Cp_H(k,:),'linewidth',1.5)
hold on
plot(T_L(k,:),Cp_L(k,:),'linewidth',1.5)
hold off
xlabel('Temparature [K]')
ylabel('Specific Heats [J/mol-K]')
legend('At High Temparture','At low Temparature')
% Plot for temperature vs Enthalpy
figure(2)
plot(T_H(k,:),H_H(k,:),'linewidth',1.5)
hold on
plot(T_L(k,:),H_L(k,:),'linewidth',1.5)
hold off
xlabel('Temparature [K]')
ylabel('Enthalpy [J/mol]')
legend('At High Temparture','At low Temparature')
% Plot for temperature vs Entropy
figure(3)
plot(T_H(k,:),S_H(k,:),'linewidth',1.5)
hold on
plot(T_L(k,:),S_L(k,:),'linewidth',1.5)
hold off
xlabel('Temparature [K]')
ylabel('Entropy [J/K]')
legend('At High Temparture','At low Temparature')
% Save the plots as images with appropriate names and dump them in separate folders for each species with suitable name. All these should be generated automatically.
%ls or dir – see contents of current directory
## cd – change directories
## delete – remove file
## copyfile – copy file
## movefile – renames or moves files
## mkdir – make directory
## rmdir – remove directory
## clc – clear screen
## exit – closes terminal
## edit – opens text editor
## pwd – lists the pathway to the current directory
## .. – double dots indicate one directory higher
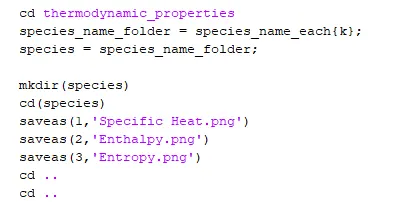
cd thermodynamic_properties % change directorie to thermodynamic_properties which is created initially
species_name_folder = species_name_each{k} % Extract species string from cell arry for naming purpose
species = species_name_folder % store it in species
mkdir(species) % in side thermodynamic_properties make directory in the name of species.
cd(species) % change directorie to species so all data plots will save for perticuler species.
saveas(1,'Specific Heat.png') % save figure 1 as Specific Heat.png
saveas(2,'Enthalpy.png') % save figure 2 as Enthalpy.png
saveas(3,'Entropy.png') % save figure 3 as Entropy.png
double dots indicate one directory higher. i e it will come out from current folder. here we have to come out
cd ..
cd ..
% Calculate the molecular weight of each species and display it in the command window.
elements = ['H','C','N','O','AR','(S)']; % From the file we have 'H','C','N','O','AR','(S)
Atomic_weight = [1,12,14,16,40,0,0,0,0]; % Atomic weight is noted in row matrix., here AR (Argon) has two letter but we need only one latter to calculate Atomic_weight , so while reading data i will reade AR as A .
for n = 1:length(species) % Repeate the loop until the length of species every time.
%[X,tf] = str2num(chr) additionally returns a second output argument that is 1 (true) if str2num successfully converts chr. Otherwise, str2num returns 0 (false).
[num,status] = str2num(species(n));
if status == 0 % For every letter status will be '0' and for all numbers status will be '1'. if status is '0' then it will enter in to the loop
F_ind = find(elements == species(n)); % Find indices and values of nonzero elementscollapse. here find option will find in which position the species letter exist in elements
suppose my species is CH2CHO and if i use F_ind = find(elements == species(2)). it will find for H in elements and prints F_ind = 1
molecular_wt(n) = Atomic_weight(F_ind); % molecular_weight is equal to Atomic_weight of F_ind number. ie here F_ind = 1 then
Atomic_weight(1) = 1 from the data [Atomic_weight = [1,12,14,16,40,0,0,0,0];]. this data will stored in molecular_wt(n).
else % if status is 1 then we can sat that is number and multiplied by previous latter
molecular_wt(n-1) = num*molecular_wt(n-1); % molecular_wt(n-1) is equal to num (which is converted from string ) * molecular_weight of previous element . this data will replace by previous data.
end
end
total_Mass = sum(molecular_wt); % i will give sum of all molecular weight which is stored in molecular_wt(n).
Display = sprintf('Molecular weight of %s is %d',species,total_Mass); % display will store the sprintf data
disp(Display) displaying display data.
Molecular weight of O is 16
Molecular weight of O2 is 32
Molecular weight of H is 1
Molecular weight of H2 is 2
Molecular weight of OH is 17
Molecular weight of H2O is 18
Molecular weight of HO2 is 33
Molecular weight of H2O2 is 34
Molecular weight of C is 12
Molecular weight of CH is 13
Molecular weight of CH2 is 14
Molecular weight of CH2(S) is 14
Molecular weight of CH3 is 15
Molecular weight of CH4 is 16
Molecular weight of CO is 28
Molecular weight of CO2 is 44
Molecular weight of HCO is 29
Molecular weight of CH2O is 30
Molecular weight of CH2OH is 31
Molecular weight of CH3O is 31
Molecular weight of CH3OH is 32
Molecular weight of C2H is 25
Molecular weight of C2H2 is 26
Molecular weight of C2H3 is 27
Molecular weight of C2H4 is 28
Molecular weight of C2H5 is 29
Molecular weight of C2H6 is 30
Molecular weight of CH2CO is 42
Molecular weight of HCCO is 41
Molecular weight of HCCOH is 42
Molecular weight of H2CN is 28
Molecular weight of HCN is 27
Molecular weight of HNO is 31
Molecular weight of N is 14
Molecular weight of NNH is 29
Molecular weight of N2O is 44
Molecular weight of NH is 15
Molecular weight of NH2 is 16
Molecular weight of NH3 is 17
Molecular weight of NO is 30
Molecular weight of NO2 is 46
Molecular weight of HCNO is 43
Molecular weight of HOCN is 43
Molecular weight of HNCO is 43
Molecular weight of NCO is 42
Molecular weight of CN is 26
Molecular weight of HCNN is 41
Molecular weight of N2 is 28
Molecular weight of AR is 40
Molecular weight of C3H8 is 44
Molecular weight of C3H7 is 43
Molecular weight of CH3CHO is 44
Molecular weight of CH2CHO is 43
>>
end
Program:
close all
clear all
clc

file_1 = fopen('THERMO.DAT','r'); % reading file name where all data is stored

Title_file_1 = fgetl(file_1);   % Readign title of file.
temp_G_line = fgetl(file_1);      % Reading Global temperature dada
temp_line_split = strsplit(temp_G_line);    %Split the string str using the delimiters specified by del and return a cell string array of substrings.
% If a delimiter is not specified the string is split at whitespace

fgetl(file_1);                 % Reading all unnecessary data after temperature
fgetl(file_1);
fgetl(file_1);
% Convert string data to number data for temperature.
temp_low_global = str2num(temp_line_split{2});
temp_mid_global = str2num(temp_line_split{3});
temp_high_global = str2num(temp_line_split{4});

% temp_L_line = fgetl(file_1)      % Reading local temperature dada
% temp_line_split = strsplit(temp_L_line)    %Split the string str using the delimiters specified by del and return a cell string array of substrings.
mkdir  thermodynamic_properties
for k = 1:53


    temp_L_line = fgetl(file_1); % Reading local temperature dada
    temp_line_split = strsplit(temp_L_line,' ');   %Split the string str using the delimiters specified by del and return a cell string array of substrings.
    species_name = (temp_line_split(1));
    species_name_each(k,:) = species_name;
    last_num = str2num(temp_line_split{end});
    if last_num == 1
        temp_low_local = str2num(temp_line_split{end- 3});
        temp_high_local = str2num(temp_line_split{end-2});
        temp_mid_local = str2num(temp_line_split{end- 1});
        element_temp(1:3)=[temp_low_local, temp_high_local, temp_mid_local];
    end
    local_temp_elements(k,:)=element_temp;


    for i = 1:2
        coefficient_line = fgetl(file_1);
        coefficients_E  = strfind(coefficient_line,'E');
        a = coefficient_line(1:coefficients_E(1)+3);
        a1_and_6(i) = str2num(a);

        for j = 1:4

            b  = coefficient_line(coefficients_E(j)+4:coefficients_E(j+1)+3);

            b1(j) = str2num(b);
        end

        a2_and_7(i) = b1(1);
        a3_and_8(i) = b1(2);
        a4_and_9(i) = b1(3);
        a5_and_10(i) = b1(4);
    end
    a1 = a1_and_6(1);
    a2 = a2_and_7(1);
    a3 = a3_and_8(1);
    a4 = a4_and_9(1);
    a5 = a5_and_10(1);
    a6 = a1_and_6(2);
    a7 = a2_and_7(2);
    a8 = a3_and_8(2);
    a9 = a4_and_9(2);
    a10 = a5_and_10(2);

    coefficient_line3 = fgetl(file_1);
    coefficients_E3  = strfind(coefficient_line,'E');
    a_3 = coefficient_line3(1:coefficients_E3(1)+3);
    a11 = str2num(a_3);
    a_3 = coefficient_line3(coefficients_E3(1)+4:coefficients_E3(2)+3);
    a12 = str2num(a_3);
    a_3 = coefficient_line3(coefficients_E3(2)+4:coefficients_E3(3)+3);
    a13 = str2num(a_3);
    a_3 = coefficient_line3(coefficients_E3(3)+4:coefficients_E3(4)+3);
    a14 = str2num(a_3);

    coefficients = [a1,a2,a3,a4,a5,a6,a7,a8,a9,a10,a11,a12,a13,a14];
    coefficients_elements(k,:) = coefficients;

    % Enthalpy, Entropy, Specific heat,calculation for temparture
    % For High temperature
    T_L = linspace(local_temp_elements(k,1),local_temp_elements(k,3),1000);

    % universal gas constant value

    R = 8.3145; %J/mol*K (units)

     Cp_L = ((a1 + a2.*T_L + a3.*T_L.^2 + a4.*T_L.^3 + a5.*T_L.^4))*R;
     H_L  = ((a1+ a2.*T_L/2 + a3.*(T_L.^2)/3 + a4.*(T_L.^3)/4 + a5.*(T_L.^4)/5 + a6./T_L)).*(R*T_L);
    S_L = ((a1*log(T_L) + a2.*T_L + a3.*(T_L.^2)/2 + a4.*(T_L.^3)/3+ a5.*(T_L.^4)/4 + a7))*R;


    T_H = linspace(local_temp_elements(k,3),local_temp_elements(k,2),1000);

     Cp_H = ((a8 + a9.*T_H + a10.*T_H.^2 + a11.*T_H.^3 + a12.*T_H.^4))*R;
    H_H = ((a8+ a9.*T_H/2 + a10.*(T_H.^2)/3 + a11.*(T_H.^3)/4 + a12.*(T_H.^4)/5 + a13./T_H)).*(R*T_H);
    S_H = ((a8*log(T_H) + a9.*T_H + a10.*(T_H.^2)/2 + a11.*(T_H.^3)/3+ a12.*(T_H.^4)/4 + a14))*R;


    %  Plot for temperature vs Enthalpy
    figure(1)
    plot(T_H,Cp_H,'linewidth',1.5)
    hold on
    plot(T_L,Cp_L,'linewidth',1.5)
    title(species_name)
    hold off
    xlabel('Temparature [K]')
    ylabel('Specific Heats [J/mol-K]')
    legend('At High Temparture','At low Temparature')

    %  Plot for temperature vs Enthalpy
    figure(2)
    plot(T_H,H_H,'linewidth',1.5)
    hold on
    plot(T_L,H_L,'linewidth',1.5)
    title(species_name)
    hold off
    xlabel('Temparature [K]')
    ylabel('Enthalpy [J/mol]')
    legend('At High Temparture','At low Temparature')

    %  Plot for temperature vs Entropy
    figure(3)
    plot(T_H,S_H,'linewidth',1.5)
    hold on
    plot(T_L,S_L,'linewidth',1.5)
    title(species_name)
    hold off
    xlabel('Temparature [K]')
    ylabel('Entropy [J/K]')
    legend('At High Temparture','At low Temparature')

%          plot(T_H(k,:),Cp_H(k,:))
%  hold on
%  plot(T_L(k,:),Cp_L(k,:))
%  hold off

    %  Save the plots as images with appropriate names and dump them in separate folders for each species with suitable name. All these should be generated automatically.
    %ls or dir – see contents of current directory
    %   cd – change directories
    %   delete – remove file
    %   copyfile – copy file
    %   movefile – renames or moves files
    %   mkdir – make directory
    %   rmdir – remove directory
    %   clc – clear screen
    %   exit – closes terminal
    %   edit – opens text editor
    %   pwd – lists the pathway to the current directory
    %   .. – double dots indicate one directory higher


    cd thermodynamic_properties
    species_name_folder = species_name_each{k};
    species = species_name_folder;

    mkdir(species)
    cd(species)
    saveas(1,'Specific Heat.png')
    saveas(2,'Enthalpy.png')
    saveas(3,'Entropy.png')
    cd ..
    cd ..

    % Calculate the molecular weight of each species and display it in the command window.
    elements = ['H','C','N','O','AR','(S)']; % From the file we have 'H','C','N','O','AR','(S)
    Atomic_weight = [1,12,14,16,40,0,0,0,0]; % Atomic weight is noted in row matrix.
    molecular_wt = 0;
    for n = 1:length(species)  % Repeate the loop until the length of species every time.

        %[X,tf] = str2num(chr) additionally returns a second output argument that is 1 (true) if str2num successfully converts chr. Otherwise, str2num returns 0 (false).
        [num,status] = str2num(species(n));

        if status == 0
            F_ind = find(elements == species(n));
            molecular_wt(n) = Atomic_weight(F_ind);
        else
            molecular_wt(n-1) = num*molecular_wt(n-1);
        end
    end
    total_Mass = sum(molecular_wt);
    Display = sprintf('Molecular weight of %s is %d',species,total_Mass);
    disp(Display)


end
Results:
Write a code in MATLAB to Parsing NASA thermodynamic data for 53 species is done
1. Plotting the Cp, Enthalpy and Entropy for the local temperature range (low temperature : high temperature) specific for each species is done.
2. Save the plots as images with appropriate names and dump them in separate folders for each species with suitable name. All data was generated automatically.

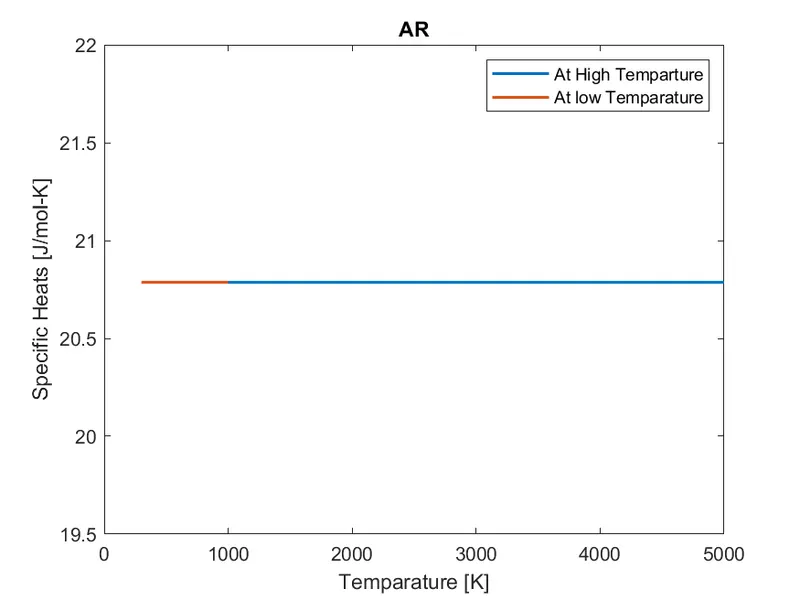
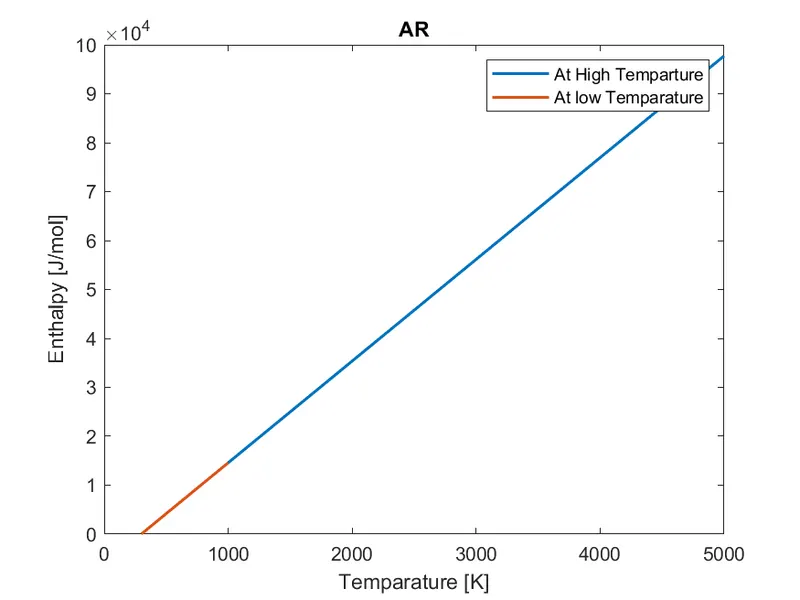
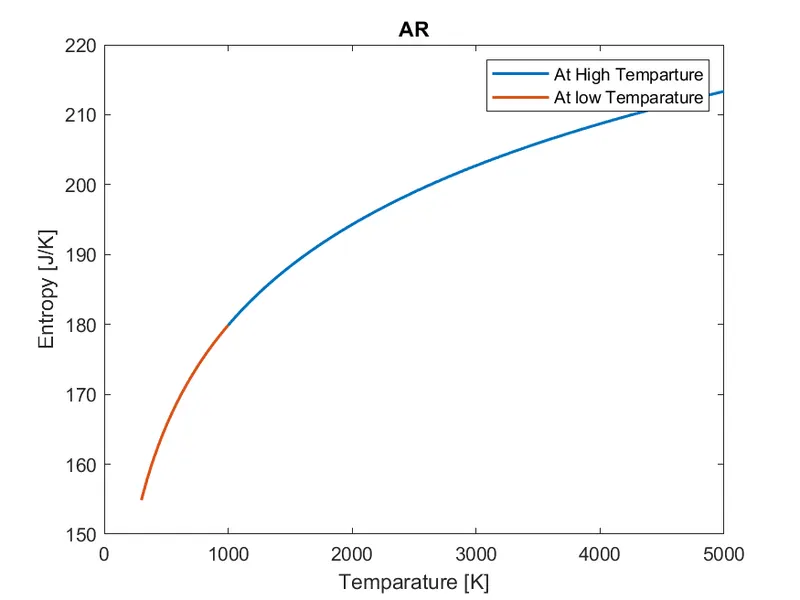
3. molecular weight of each species is done and display it in the command window is shown below
Molecular weight of O is 16
Molecular weight of O2 is 32
Molecular weight of H is 1
Molecular weight of H2 is 2
Molecular weight of OH is 17
Molecular weight of H2O is 18
Molecular weight of HO2 is 33
Molecular weight of H2O2 is 34
Molecular weight of C is 12
Molecular weight of CH is 13
Molecular weight of CH2 is 14
Molecular weight of CH2(S) is 14
Molecular weight of CH3 is 15
Molecular weight of CH4 is 16
Molecular weight of CO is 28
Molecular weight of CO2 is 44
Molecular weight of HCO is 29
Molecular weight of CH2O is 30
Molecular weight of CH2OH is 31
Molecular weight of CH3O is 31
Molecular weight of CH3OH is 32
Molecular weight of C2H is 25
Molecular weight of C2H2 is 26
Molecular weight of C2H3 is 27
Molecular weight of C2H4 is 28
Molecular weight of C2H5 is 29
Molecular weight of C2H6 is 30
Molecular weight of CH2CO is 42
Molecular weight of HCCO is 41
Molecular weight of HCCOH is 42
Molecular weight of H2CN is 28
Molecular weight of HCN is 27
Molecular weight of HNO is 31
Molecular weight of N is 14
Molecular weight of NNH is 29
Molecular weight of N2O is 44
Molecular weight of NH is 15
Molecular weight of NH2 is 16
Molecular weight of NH3 is 17
Molecular weight of NO is 30
Molecular weight of NO2 is 46
Molecular weight of HCNO is 43
Molecular weight of HOCN is 43
Molecular weight of HNCO is 43
Molecular weight of NCO is 42
Molecular weight of CN is 26
Molecular weight of HCNN is 41
Molecular weight of N2 is 28
Molecular weight of AR is 40
Molecular weight of C3H8 is 44
Molecular weight of C3H7 is 43
Molecular weight of CH3CHO is 44
Molecular weight of CH2CHO is 43
>>
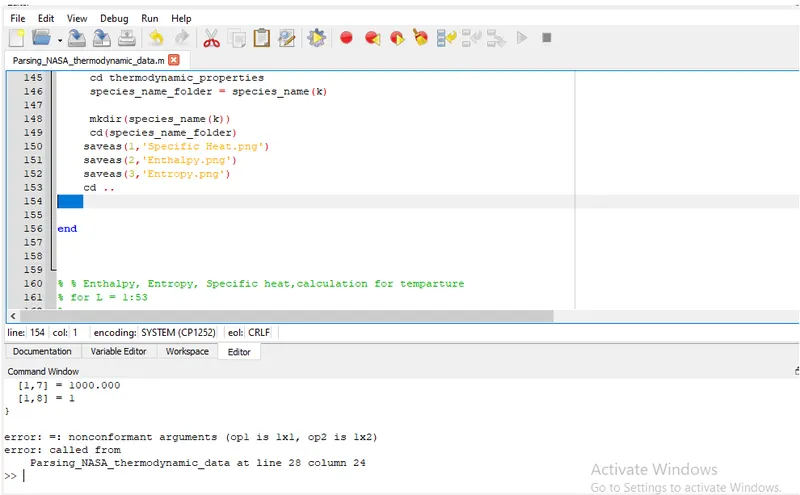
Errors:
solution