Project 1 - Parsing NASA thermodynamic data
OBJECTIVE :- Parsing NASA thermodynamic data file and find out Cp, H, S and molecular weight of each species.
PROBLEM STATEMENT :-
NASA came up with polynomial that can be used to evaluate thermodynamic proparties such as Cp, H and S. They have also documented the co-efficients that are required to evaluate these polynomials for 1000+ species.
To guide us we have broken down the problem into meaningful bits that we can work on individually.
1. Write function that extracts the 14 co-efficients and calculate the enthalpy, entropy and specific heats for all the species in the data file. We will be reading this file from skill lync project page. The formulae are shown below-
Here R is the universal gas constant, T is the temperature
Cp/R = a1 + a2*T + a3*T^2 + a4*T^3 + a5*T^4
H/RT = a1 + a2*T/2 + a3*T^2/3 + a4*T^3/4 + a5*T^4/5 + a6/T
S/R = a1*lnT + a2*T + a3*T2/2 + a4*T^3/3 + a5*T^4/4 + a7
The first 7 coefficients are high temperature co-efficients and the second 7 coefficients are Low temperature coefficients. Also use the Local temperature ranges which is unique for each individual species, not the GLOBAL TEMPERATURE RANGE.
2. Calculate the molecular weight of each species and display it in the command window.
3. Plot the Cp, Enthalpy, Entropy for the local temperature range (low temperature : high temperature) specific for each spcies.
4. Save the plots as images with appropriate names and dump them in seperate folders for each species with suitable name. All these should be generated automatically.
5. The main program that we will submit will just take the "THERMO.dat" file as an input and generate Cp, H and S plots.
6. Write a detailed report to describe our logic.
Attachments needed :-
- Screenshot of the window where all the folders are saved
- Plots for O2, N2 and CO2 species.
Contents expected in the report :-
- step wise explaination of our code
- Mention the errors faced while programming
- Steps taken to overcome those errors
- Screenshots showing errors thrown in command window.
THEORY & INTRODUCTIONS :-
Thermodynamic Proparties And Relations :- In order to carry through a program of finding the changes in the various thermodynamic functions that accompany reactions- such as entropy, enthalpy and free energy- it is often useful to know these quantities seperately for each of the materials entering into the reactions. e.g. if the entropies are known seperately for the reactants and products, then the entropy change for the reaction is just the difference-
ΔSreaction = Sproducts − Sreactants .
Work of expansion and contraction :- The first task in carrying out the above program is to calculate the amount of work done by a single pure substance when it expands at constant temperature. Unlike the case of the chemical reactions, where the volume can change at constant temperature and pressure because of the liberation of gas, the volume of a single pure substance placed in a cylinder can not change unless either the pressure or the temperature changes. To calculate the work, suppose that a piston moves by an infinitesimal amount dx. Because pressure is force per unit area, the total remaining force exerted by the piston on the gas is PA, where A is the cross sectional area of the piston. Thus, the increamental amount of work done is d'W = PAdx.
Heat capacity and internal energy :- The goal in defining heat capacity is to relate changes in the internal energy to measured changes in the variable that charecterize the state of the system. For a system consisting of a single pure substance, the only kind of work it can do is atmospheric work, and so the first law reduces to- dU = d'Q - PdV .
Entropy as an exact differential :- Because the quantity dS = d'Qmax/T is an exact differential, many other important relationships connecting the thermodynamic proparties of substance can be derived. e.g. with the substitutions d'Q = Tds and d'W = Pdv, the differential form (dU = d'Q - d'W) of the first low of thermodynamics becomes (for a single pure substance).
dU = TdS - PdV .
The Clausius Clapeyron equation :- Phase changes, such as the conversion of liquid water to steam, provide an important example of a system in which there is a large change in internal energy with volume at constant temperature. Suppose that the cylinder contains both water and steam in equilibrium with each other at pressure P, and the cylinder is held at constant temperature T. The pressure remains equal to the vapour pressure Pvap as the piston moves up, as long as both phases remains present. All that happens is that more water turns to steam, and the heat reservoir must supply the latent heat of vaporization.
Concluding remark :- The sweeping generality of the constraints imposed by the laws of thermodynamics makes the number of potential applications so large that it is impractical to catalog every possible formula that might come into use, even in detailed textbooks on the subject. For this reason, students and practitioners in the field must be proficient in mathmatical manipulations involving partial derivatives and in understanding their physical content.
One of the great streangth of classical thermodynamics is that the predictions for the directions of spontaneous change are completely independent of the microscopic structure of matter, but this also represents a limitation in that no predictions are made about the rate at which a system approaches equilibrium. In fact, the rate can be exceedingly slow, such as the spontaneous transition of diamonds into graphite. Statistical thermodynamics provides information on the rates of process, as well as important insights into the statistical nature of entropy and the second law of thermodynamics.
The 20th century English scientist C. P. Snow explained the first three laws of thermodynamics as-
- You can not win (i.e. one cannot get something for nothing, because of the conversion of matter and energy).
- You cannot break even (i.e. one cannot return to the same energy state, because entropy or disorder, always increases).
- You cannot get out of the game (i.e. absolute zero is unattainable because no perfectly pure substance exists).
STEP WISE CODE EXPLAINATION :-
- First off all I saved THERMO.dat file in the same directory where I have been save this matlab code file.
- In code I open it for plotting and calculation from given data in the file.
- In the file, first 5 lines are only for reading purpose, so I skipped it by using the command fgetl.
- There have total 53 species available in the file and I want to call all of those files.
- then I read local temperature line, split it and save it in species
- then I convert temperature from string to double format by using the formula
- Use the linspace command from minimum to maximum local temperature.
- create a new directory by the name of 'parsing_data'
- then find out the co-efficient and position of E.
- then extract the high temperature and low temperature co-efficients and converted from sring to number format.
- Define the function, which is created seperately.
- then plot the figures for temperature vs specific heat, temperature vs enthalpy and temperature vs entropy by giving xlabel and ylabel.
- create the plot saving path and change the directory by all species name.
- then save each plot in jpg format.
- then calculate the molecular weight by describing elements and it's atomic weight.
- use for loop for species and elements.
- then calculate the molecular weight.
- display the molecular weight of each species and save it in given folder.
MAIN MATLAB CODE :-
clear all
close all
clc

% Reading the data file
f1 = fopen('THERMO.dat','r');

% Reading data file first line
%header = fgetl(f1)

% Reading next line
%l1 = fgetl(f1);

% Not considering the next 3-lines
for i=1:5
    l2 = fgetl(f1);
end

for j = 1:53
% Local temperature
tline= fgetl(f1);
t = strsplit(tline,' ');
species=t{1}

len=length(t)
% t = str2num(tline);

% Calculating Local Temperature
local_min =str2double( t{len-3});       %str2num(T{1});
local_mid = str2double(t{len-1});       %str2num(T{2});
local_max =str2double(t{len-2});       %str2num(T{3});
T = linspace(local_min,local_max,200);


R = 8.314;   %KJ/Kg-K

mkdir parsing_data

    %species = strtok(l1,' ');
    %cd parsing_data
    %mkdir(species)
    %cd(species)

% Co-efficient
a = fgetl(f1);
b = fgetl(f1);
c = fgetl(f1);

% Finding position of E
d = strfind(a,'E');
e = strfind(b,'E');
f = strfind(c,'E');

% Extracting high temperature co-efficient
tline = ' 2.56942078E+00-8.59741137E-05 4.19484589E-08-1.00177799E-11 1.22833691E-15 2.92175791E+04 4.78433864E+00 3.16826710E+00-3.27931884E-03 6.64306396E-06-6.12806624E-09 2.11265971E-12 2.91222592E+04 2.05193346E+00';
a = findstr(tline,'E');
a1 = tline(1:a(1)+3);
a1 = str2num(a1);

a2 = tline(a(1)+4:a(2)+3);
a2 = str2num(a2);

a3 = tline(a(2)+4:a(3)+3);
a3 = str2num(a3);

a4 = tline(a(3)+4:a(4)+3);
a4 = str2num(a4);

a5 = tline(a(4)+4:a(5)+3);
a5 = str2num(a5);

a6 = tline(a(5)+4:a(6)+3);
a6 = str2num(a6);

a7 = tline(a(6)+4:a(7)+3);
a7 = str2num(a7);

% Extracting low temperature co-efficient
a8 = tline(a(7)+4:a(8)+3);
a8 = str2num(a8);

a9 = tline(a(8)+4:a(9)+3);
a9 = str2num(a9);

a10 = tline(a(9)+4:a(10)+3);
a10 = str2num(a10);

a11 = tline(a(10)+4:a(11)+3);
a11 = str2num(a11);

a12 = tline(a(11)+4:a(12)+3);
a12 = str2num(a12);

a13 = tline(a(12)+4:a(13)+3);
a13 = str2num(a13);

a14 = tline(a(13)+4:a(14)+3);
a14 = str2num(a14);

% Specific heat, Entropy, Enthalpy
[Cp, S, H] = specificheat(a1,a2,a3,a4,a5,a6,a7,a8,a9,a10,a11,a12,a13,a14,R,T,local_mid);


% Plotting
figure(1)
plot(T,Cp,'color','r','linewidth',3)
xlabel('Temperature[K]')
ylabel('Specific Heat [J/Kg]')

figure(2)
plot(T,H,'color','r','linewidth',3)
xlabel('Temperature[K]')
ylabel('Enthalpy[J/Kg]')

figure(3)
plot(T,S,'color','r','linewidth',3)
xlabel('Temperature[K]')
ylabel('Entropy[J/Kg]')

mkdir(['F:\MATLAB Challenge\Sixth Week\Parcing_data\',species])

cd(['F:\MATLAB Challenge\Sixth Week\Parcing_data\',species])

% Saving jpg data
saveas(figure(1),'Specific Heat Vs Temperature','jpg');
saveas(figure(2),'Enthalpy Vs Temperature','jpg');
saveas(figure(3),'Entropy Vs Temperature','jpg');

% Saving fig data
%saveas(figure(1),'Specific Heat Vs Temperature.fig');
%saveas(figure(2),'Enthalpy Vs Temperature.fig');
%saveas(figure(3),'Entropy Vs Temperature.fig');

%cd('F:\MATLAB Challenge\Sixth Week')
%mkdir('F:\MATLAB Challenge\Sixth Week')
%cd(species)
% l1 = fgetl(f1);


% Calculating Molecular Weight
Elements = ['H','O','C','N','S','A'];
Atomic_Weight = [1,16,12,14,32,40];
mw = 0;

for i = 1:length(species)
    for j=1:length(Elements)
  if strcmp(species(i),Elements(j))==1
            mw = Atomic_Weight(j) + mw;
            Z = Atomic_Weight(j);
  end
  end

n = str2num(species(i));
if n>1
    mw = Atomic_Weight*(n-1) + mw;

end
end

disp(['Molecular Weight of : ',species])
disp(mw)
cd('F:\MATLAB Challenge\Sixth Week')

end
FUNCTION MATLAB CODE :-
19. create the function for all local temperature.
20. Here I use if loop for 'T(i) > local mid temperature and else T(i) < local mid temperature' for low and high temperature.
function [Cp S H] = specificheat(a1,a2,a3,a4,a5,a6,a7,a8,a9,a10,a11,a12,a13,a14,R,T,local_mid)

   for i = 1:length(T)

    % For high temperature

    if T(i) > local_mid
    Cp(i) = (a1 + a2*T(i) + a3*T(i)^2 + a4*T(i)^3 + a5*T(i)^4)*R;
    H(i) = (a1 + a2*(T(i)/2) + a3*(T(i)^2)/3 + a4*(T(i)^3)/4 + a5*(T(i)^4)/5 + a6/T(i))*R*T(i);
    S(i) = (a1*log(T(i)) + a2*T(i) + a3*(T(i)^2)/2 + a4*(T(i)^3)/3 + a5*(T(i)^4)/4 + a7)*R;

    %For low temperature
    else
        Cp(i) = (a8 + a9*T(i) + a10*T(i)^2 + a11*T(i)^3 + a12*T(i)^4)*R;
        H(i) = (a8 + a9*(T(i)/2) + a10*(T(i)^2)/3 + a11*(T(i)^3)/4 + a12*(T(i)^4)/5 + a13/T(i))*R*T(i);
        S(i) = (a8*log(T(i)) + a9*T(i) + a10*(T(i)^2)/2 + a11*(T(i)^3)/3 + a12*(T(i)^4)/4 + a14)*R;
    end
   end
OUTPUT PLOTS :-
1 ) For AR :-
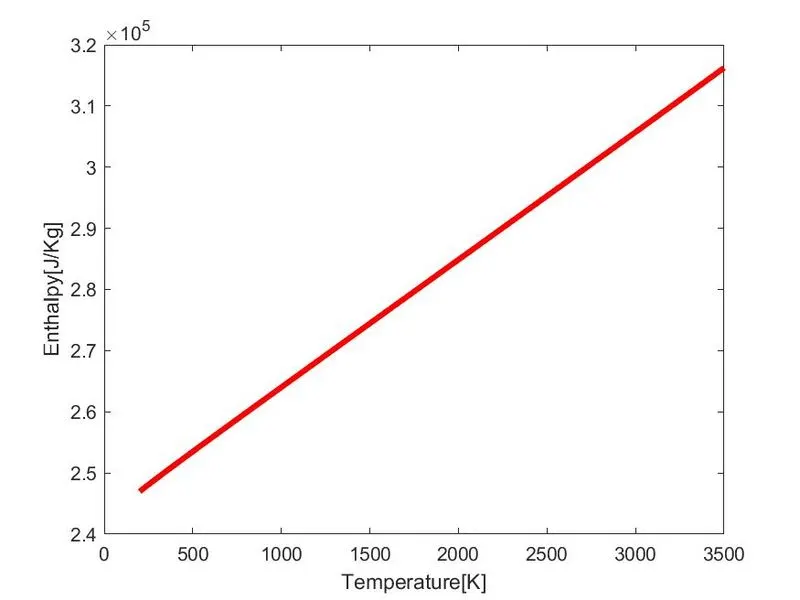
a) Enthalpy Vs Temperature :-
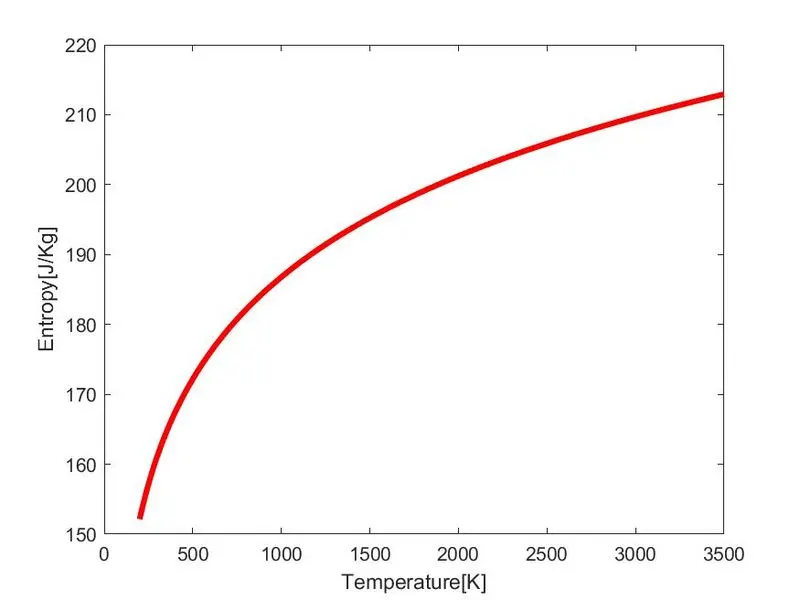
b) Entropy Vs Temperature :-
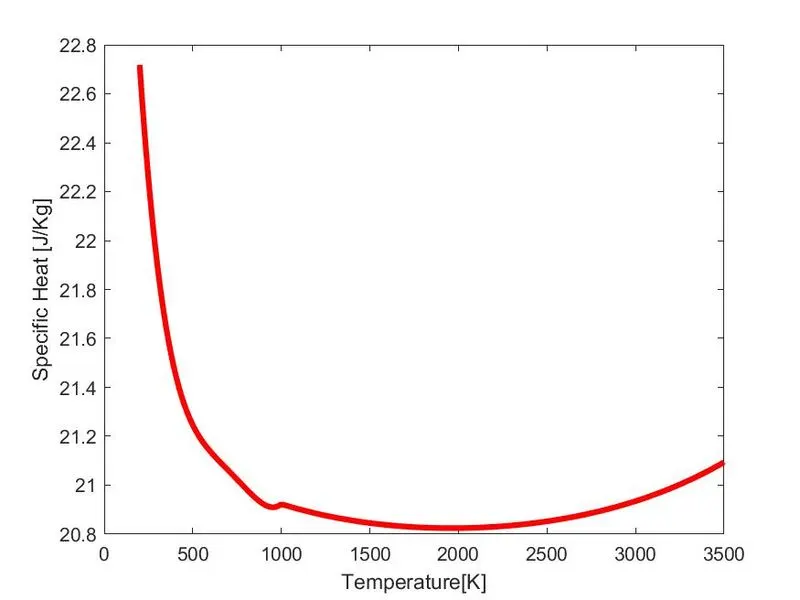
c) Specific heat Vs Temperature :-
2) For C :-
a) Enthalpy Vs Temperature :-
b) Entropy Vs Temperature :-
c) Specific heat Vs Temperature :-
3) For C2H :-
a) Enthalpy Vs Temperature :-
b) Entropy Vs Temperature :-
c) Specific heat Vs Temperature :-
4 ) For C2H2 :-
a) Enthalpy Vs Temperature :-
b) Entropy Vs Temperature :-
c) Specific heat Vs Temperature :-
5 ) For C2H3 :-
a) Enthalpy Vs Temperature :-
b) Entropy Vs Temperature :-
c) Specific heat Vs Temperature :-
6 ) For C2H4 :-
a) Enthalpy Vs Temperature :-
b) Entropy Vs Temperature :-
c) Specific heat Vs Temperature :-
7 ) For C2H5 :-
a) Enthalpy Vs Temperature :-
b) Entropy Vs Temperature :-
c) Specific heat Vs Temperature :-
8 ) For C2H6 :-
a) Enthalpy Vs Temperature :-
b) Entropy Vs Temperature :-
c) Specific heat Vs Temperature :-
9 ) For C3H7 :-
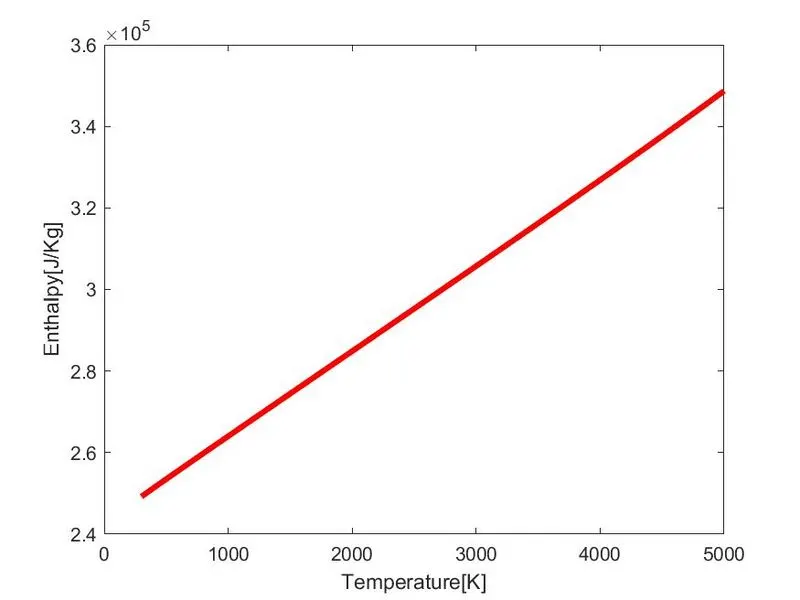
a) Enthalpy Vs Temperature :-
b) Entropy Vs Temperature :-
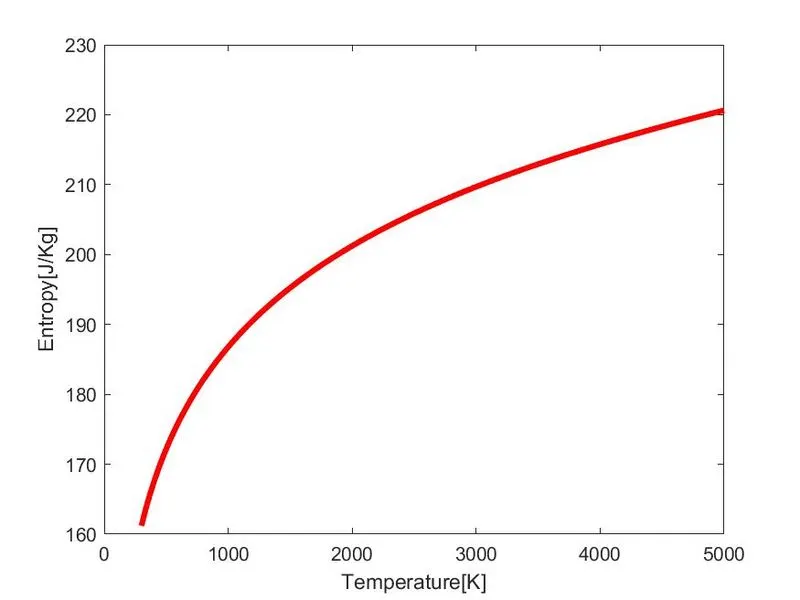
c) Specific heat Vs Temperature :-
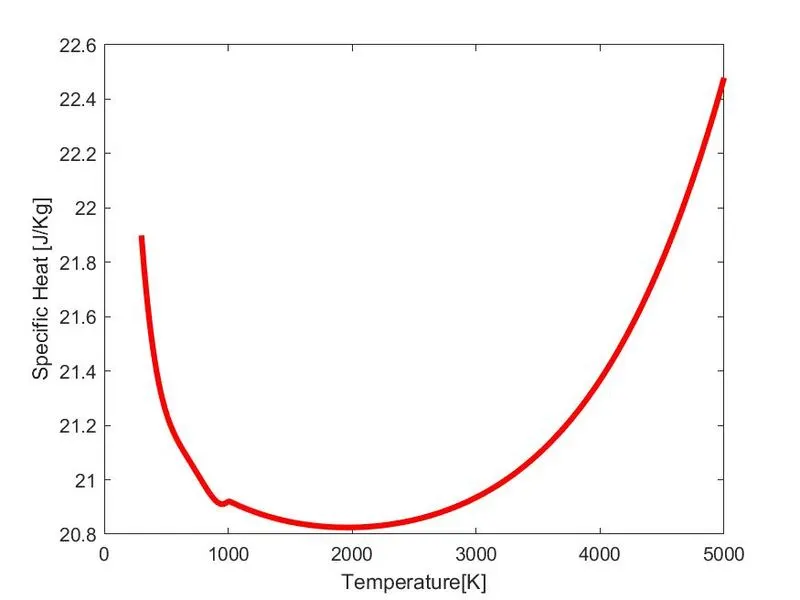
10 ) For C3H8:-
a) Enthalpy Vs Temperature :-
b) Entropy Vs Temperature :-
c) Specific heat Vs Temperature :-
11 ) For CH :-
a) Enthalpy Vs Temperature :-
b) Entropy Vs Temperature :-
c) Specific heat Vs Temperature :-
12 ) For CH2 :-
a) Enthalpy Vs Temperature :-
b) Entropy Vs Temperature :-
c) Specific heat Vs Temperature :-
13 ) For CH2(S) :-
a) Enthalpy Vs Temperature :-
b) Entropy Vs Temperature :-
c) Specific heat Vs Temperature :-
14 ) For CH2CHO :-
a) Enthalpy Vs Temperature :-
b) Entropy Vs Temperature :-
c) Specific heat Vs Temperature :-
15 ) For CH2CO :-
a) Enthalpy Vs Temperature :-
b) Entropy Vs Temperature :-
c) Specific heat Vs Temperature :-
16 ) For CH2O :-
a) Enthalpy Vs Temperature :-
b) Entropy Vs Temperature :-
c) Specific heat Vs Temperature :-
17 ) For CH2OH :-
a) Enthalpy Vs Temperature :-
b) Entropy Vs Temperature :-
c) Specific heat Vs Temperature :-
18 ) For CH3 :-
a) Enthalpy Vs Temperature :-
b) Entropy Vs Temperature :-
c) Specific heat Vs Temperature :-
19) For CH3CHO :-
a) Enthalpy Vs Temperature :-
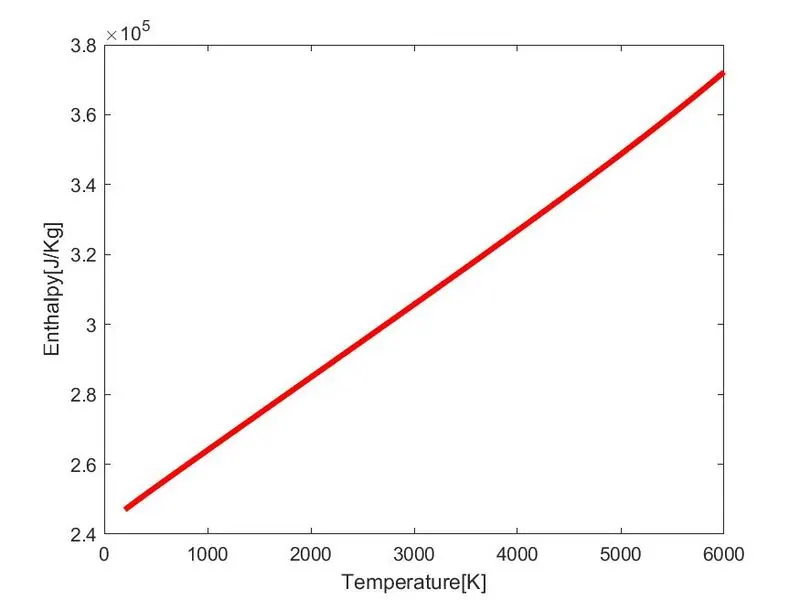
b) Entropy Vs Temperature :-
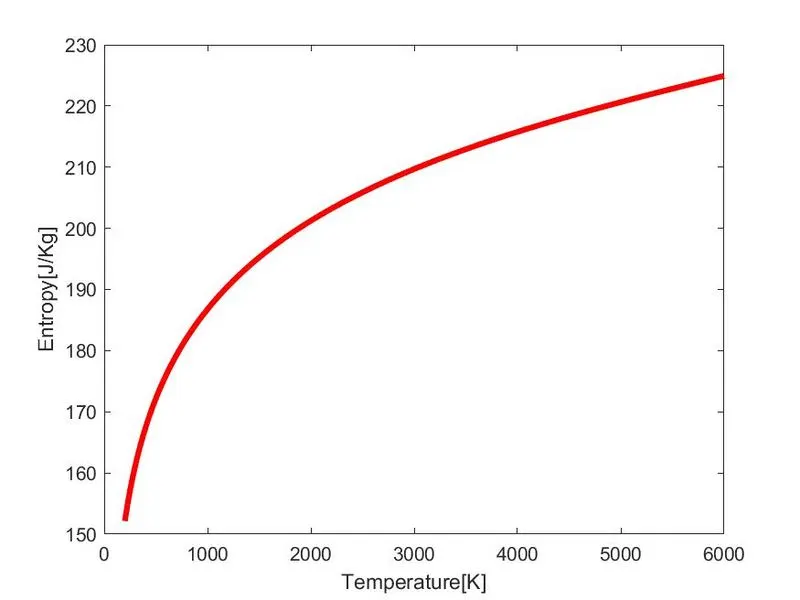
c) Specific heat Vs Temperature :-
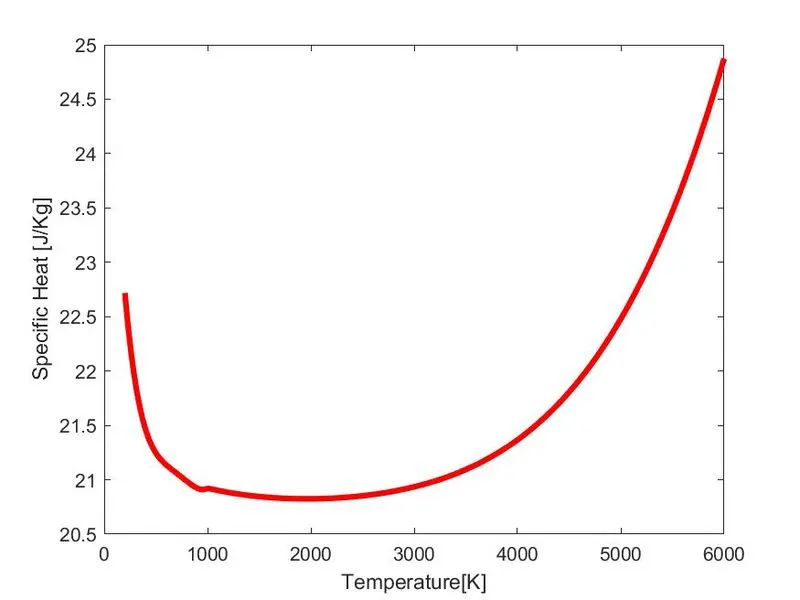
20 ) For CH3O :-
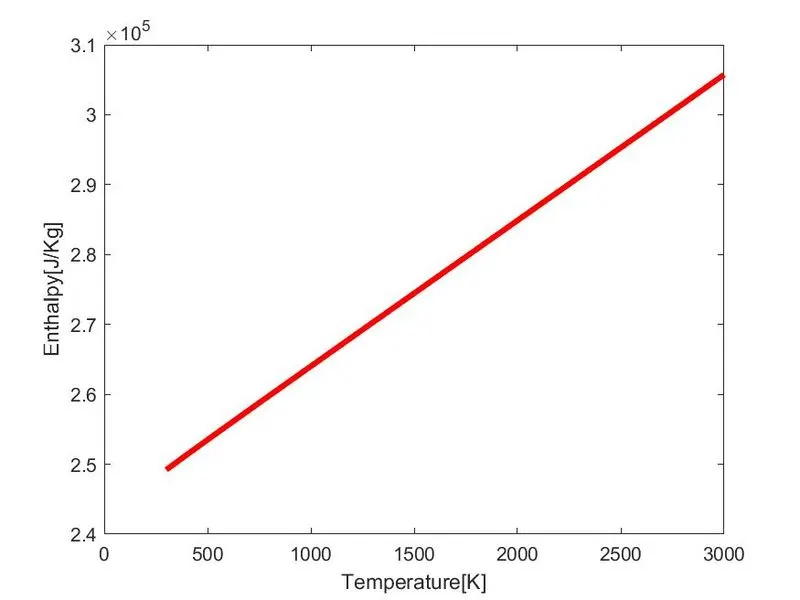
a) Enthalpy Vs Temperature :-
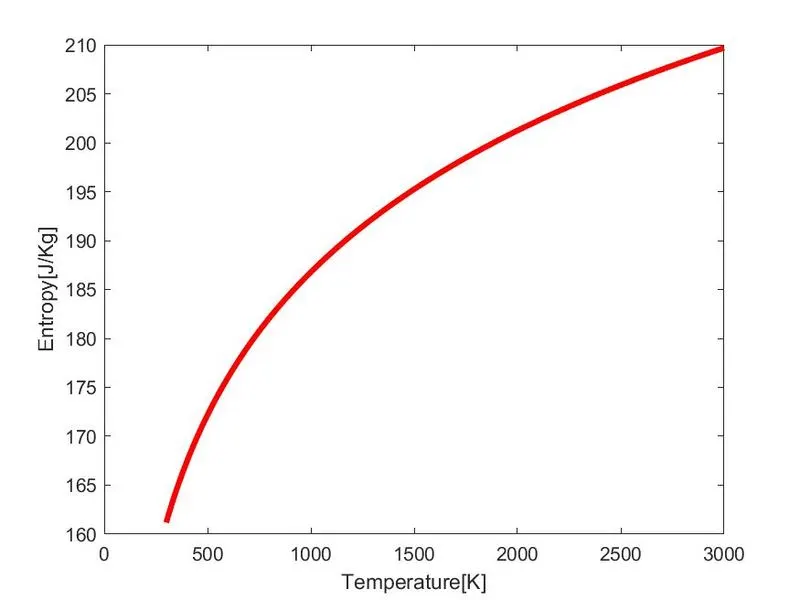
b) Entropy Vs Temperature :-
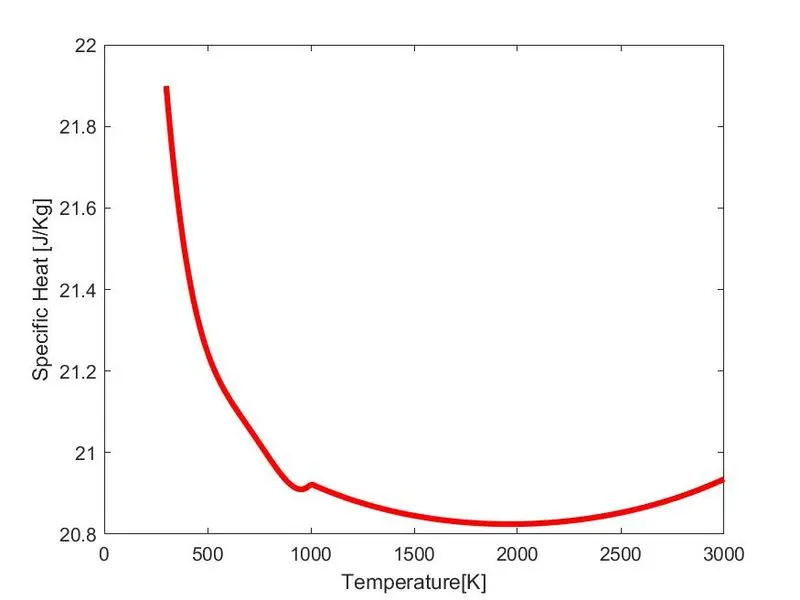
c) Specific heat Vs Temperature :-
21 ) For CH3OH :-
a) Enthalpy Vs Temperature :-
b) Entropy Vs Temperature :-
c) Specific heat Vs Temperature :-
22 ) For CH4 :-
a) Enthalpy Vs Temperature :-
b) Entropy Vs Temperature :-
c) Specific heat Vs Temperature :-
23 ) For CN :-
a) Enthalpy Vs Temperature :-
b) Entropy Vs Temperature :-
c) Specific heat Vs Temperature :-
24 ) For CO :-
a) Enthalpy Vs Temperature :-
b) Entropy Vs Temperature :-
c) Specific heat Vs Temperature :-
25 ) For CO2 :-
a) Enthalpy Vs Temperature :-
b) Entropy Vs Temperature :-
c) Specific heat Vs Temperature :-
26 ) For H :-
a) Enthalpy Vs Temperature :-
b) Entropy Vs Temperature :-
c) Specific heat Vs Temperature :-
27 ) For H2 :-
a) Enthalpy Vs Temperature :-
b) Entropy Vs Temperature :-
c) Specific heat Vs Temperature :-
28 ) For H2CN :-
a) Enthalpy Vs Temperature :-
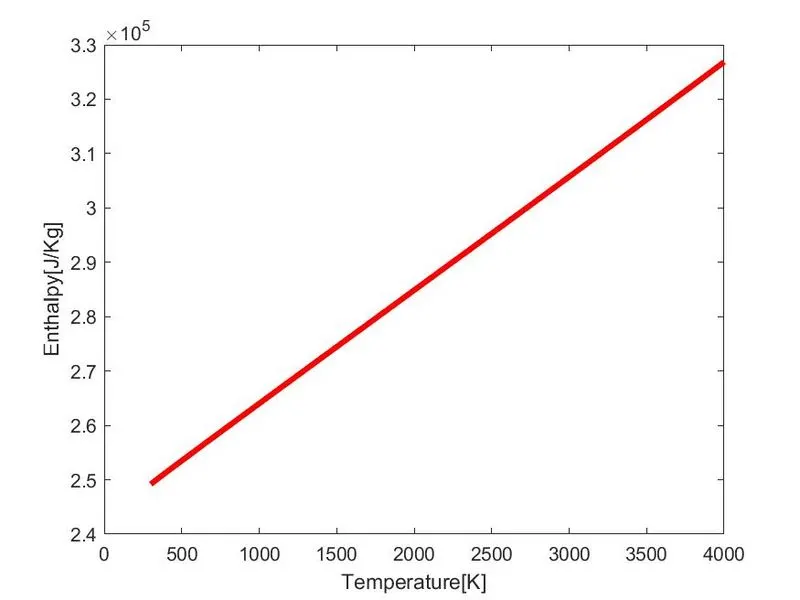
b) Entropy Vs Temperature :-
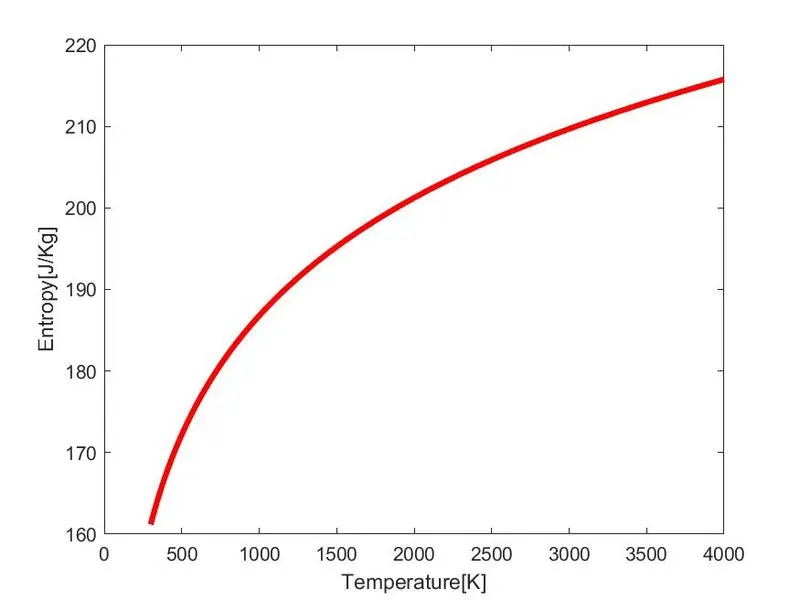
c) Specific heat Vs Temperature :-
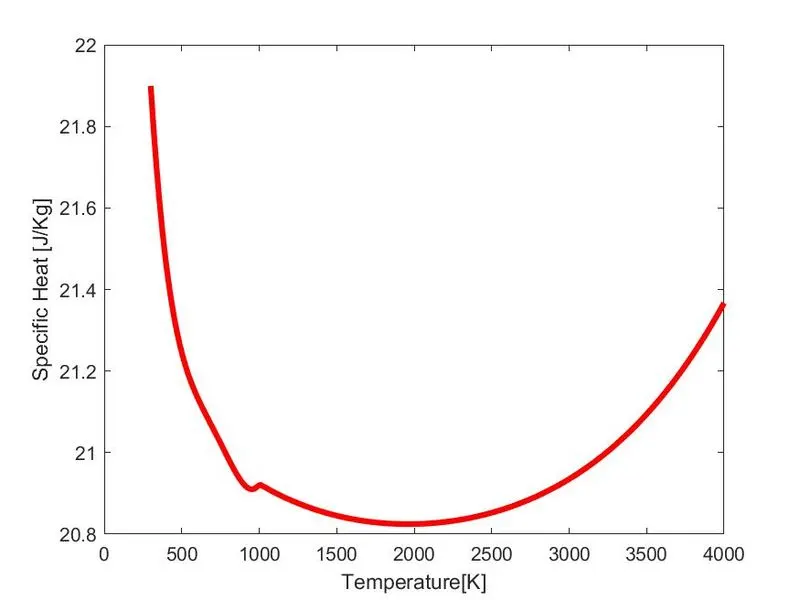
29 ) For H20 :-
a) Enthalpy Vs Temperature :-
b) Entropy Vs Temperature :-
c) Specific heat Vs Temperature :-
30 ) For H2O2 :-
a) Enthalpy Vs Temperature :-
b) Entropy Vs Temperature :-
c) Specific heat Vs Temperature :-
31 ) For HCCO :-
a) Enthalpy Vs Temperature :-
b) Entropy Vs Temperature :-
c) Specific heat Vs Temperature :-
32 ) For HCCOH :-
a) Enthalpy Vs Temperature :-
b) Entropy Vs Temperature :-
c) Specific heat Vs Temperature :-
33 ) For HCN :-
a) Enthalpy Vs Temperature :-
b) Entropy Vs Temperature :-
c) Specific heat Vs Temperature :-
34 ) For HCNN :-
a) Enthalpy Vs Temperature :-
b) Entropy Vs Temperature :-
c) Specific heat Vs Temperature :-
35 ) For HCNO :-
a) Enthalpy Vs Temperature :-
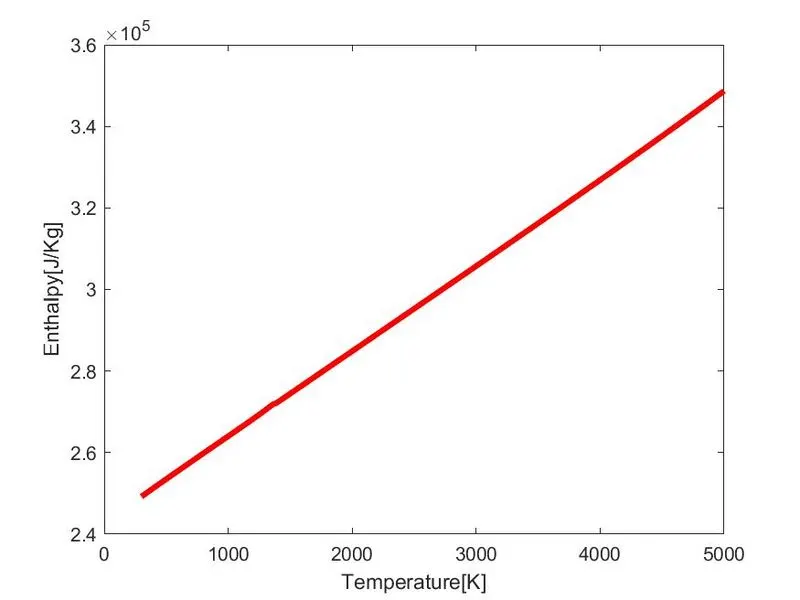
b) Entropy Vs Temperature :-
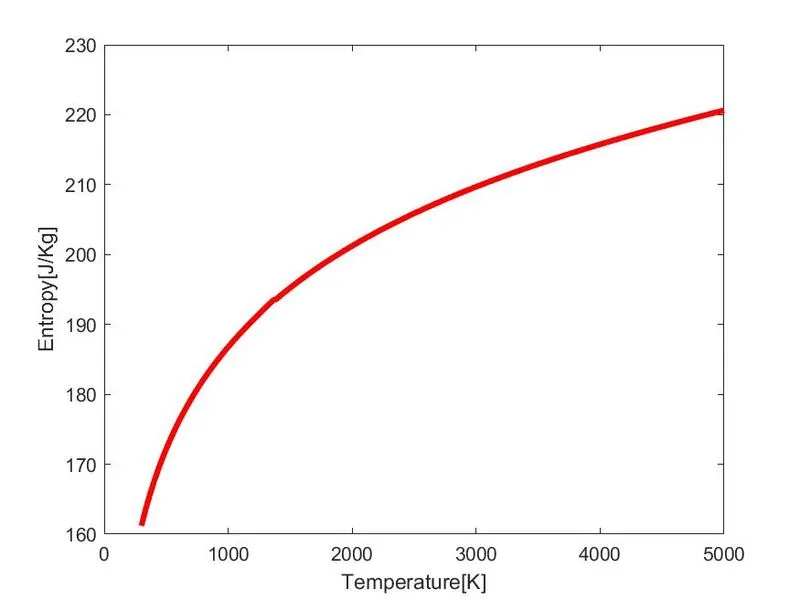
c) Specific heat Vs Temperature :-
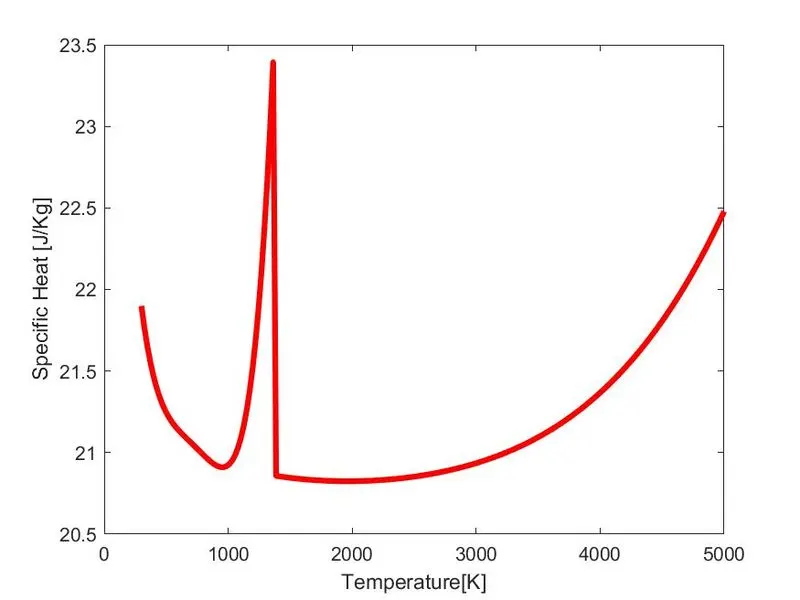
36 ) For HCO :-
a) Enthalpy Vs Temperature :-
b) Entropy Vs Temperature :-
c) Specific heat Vs Temperature :-
37 ) For HNCO :-
a) Enthalpy Vs Temperature :-
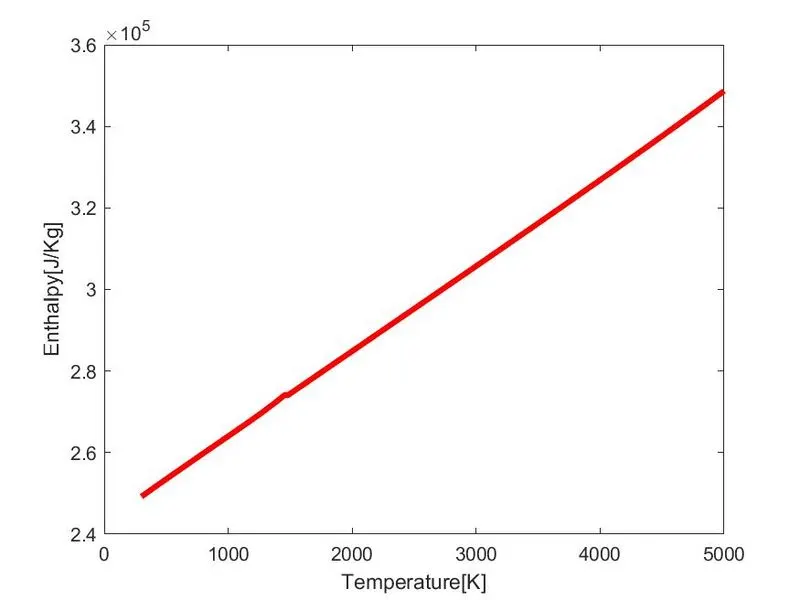
b) Entropy Vs Temperature :-
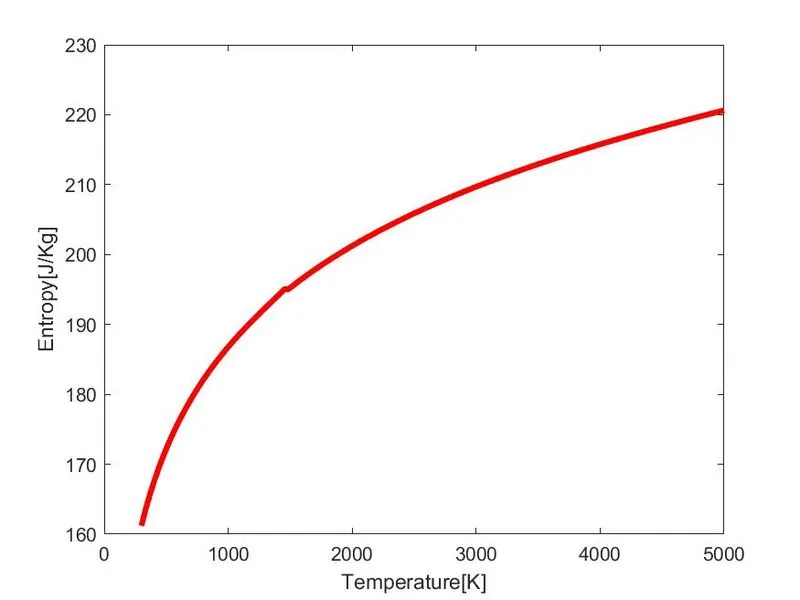
c) Specific heat Vs Temperature :-
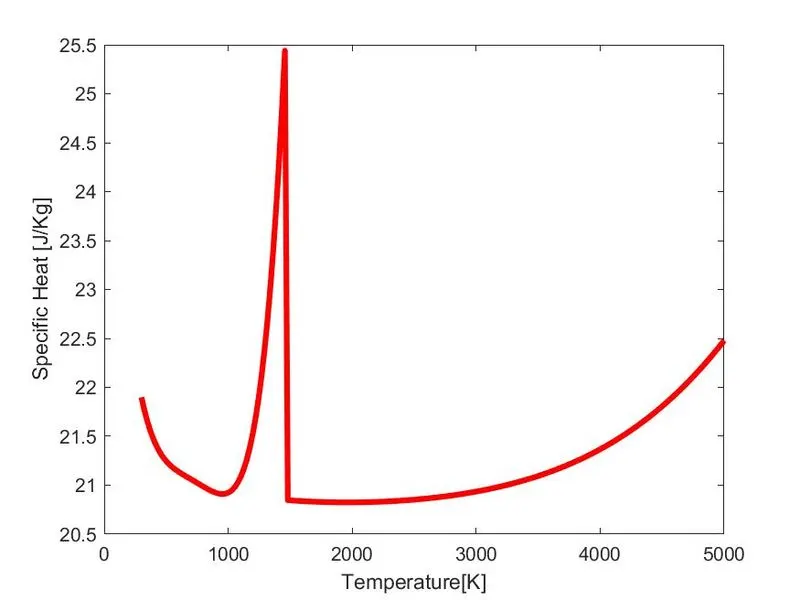
38 ) For HNO :-
a) Enthalpy Vs Temperature :-
b) Entropy Vs Temperature :-
c) Specific heat Vs Temperature :-
39 ) For HO2 :-
a) Enthalpy Vs Temperature :-
b) Entropy Vs Temperature :-
c) Specific heat Vs Temperature :-
40 ) For HOCN :-
a) Enthalpy Vs Temperature :-
b) Entropy Vs Temperature :-
c) Specific heat Vs Temperature :-
41 ) For N :-
a) Enthalpy Vs Temperature :-
b) Entropy Vs Temperature :-
c) Specific heat Vs Temperature :-
42 ) For N2 :-
a) Enthalpy Vs Temperature :-
b) Entropy Vs Temperature :-
c) Specific heat Vs Temperature :-
43 ) For N2O :-
a) Enthalpy Vs Temperature :-
b) Entropy Vs Temperature :-
c) Specific heat Vs Temperature :-
44 ) For NCO :-
a) Enthalpy Vs Temperature :-
b) Entropy Vs Temperature :-
c) Specific heat Vs Temperature :-
45 ) For NH :-
a) Enthalpy Vs Temperature :-
b) Entropy Vs Temperature :-
c) Specific heat Vs Temperature :-
46 ) For NH2 :-
a) Enthalpy Vs Temperature :-
b) Entropy Vs Temperature :-
c) Specific heat Vs Temperature :-
47 ) For NH3 :-
a) Enthalpy Vs Temperature :-
b) Entropy Vs Temperature :-
c) Specific heat Vs Temperature :-
48 ) For NNH :-
a) Enthalpy Vs Temperature :-
b) Entropy Vs Temperature :-
c) Specific heat Vs Temperature :-
49 ) For NO :-
a) Enthalpy Vs Temperature :-
b) Entropy Vs Temperature :-
c) Specific heat Vs Temperature :-
50 ) For NO2 :-
a) Enthalpy Vs Temperature :-
b) Entropy Vs Temperature :-
c) Specific heat Vs Temperature :-
51 ) For O :-
a) Enthalpy Vs Temperature :-
b) Entropy Vs Temperature :-
c) Specific heat Vs Temperature :-
52 ) For O2 :-
a) Enthalpy Vs Temperature :-
b) Entropy Vs Temperature :-
c) Specific heat Vs Temperature :-
53 ) For OH :-
a) Enthalpy Vs Temperature :-
b) Entropy Vs Temperature :-
c) Specific heat Vs Temperature :-
SAVED FILES SNAPSHOTS :-

These all are the folders in which I saved all the three plots i.e. enhalpy vs temperature, entropy vs temperature and specific heat vs temperature respectivelly. These all files saved by species name and these all are total 53 files because there have total 53 dpecies available in thermo.dat file.
ERROR AND REMEDIES :-
1.
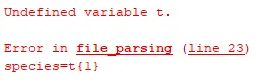
This error occurs because of undefining variable 't'. For this error we need to define 't'.
2.
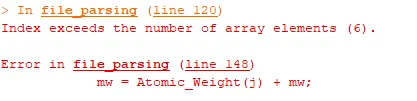
This errror occurs because of, I want to define six elements but last elements I written in two alphabet format. As in matlab every letter read as a different string and these two alphabet read seperately it means I written six element but, matlab read seven elements and that's why matlab throwing this errror in command window.
3.
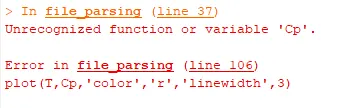
This error occurs because of undefined variable 'Cp'. In function file I defined differently and in main file I defined it differently. Due to this mismatch error matlab throwing this error in the command window. For solving this error we need to write same variale in both the files.
CONCLUSIONS :-
From above plots, we can concluded following points are-
- Enthalpy and temperature are directly proportional to each other and that's why it gives linear graph.
- Entropy is directly proportional to the square of temperature and that's why it give parabolic graph.
- Specific heat is directly proportional to the logarithmic function of temperature and that's why it gives hyperbolic graph but is in decreasing order.
In this way I write the code for file parsing, read all the data, plot the diagrams for all the species seperately, solve the equation for higher and lower temperature, calculate the molecular weight for given species, solve the different error and finally I write the conclusion from above plots.