Project 1 - Parsing NASA thermodynamic data
AIM
To parse a thermodynamics file by NASA.
Objective:
- To extract the coefficients from the file for each compound.
- To calculate the molecular weight of each species.
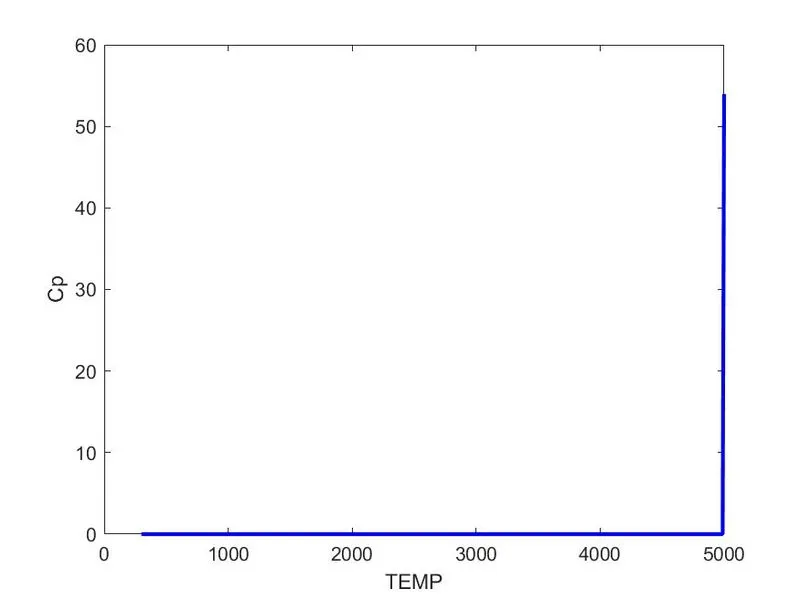
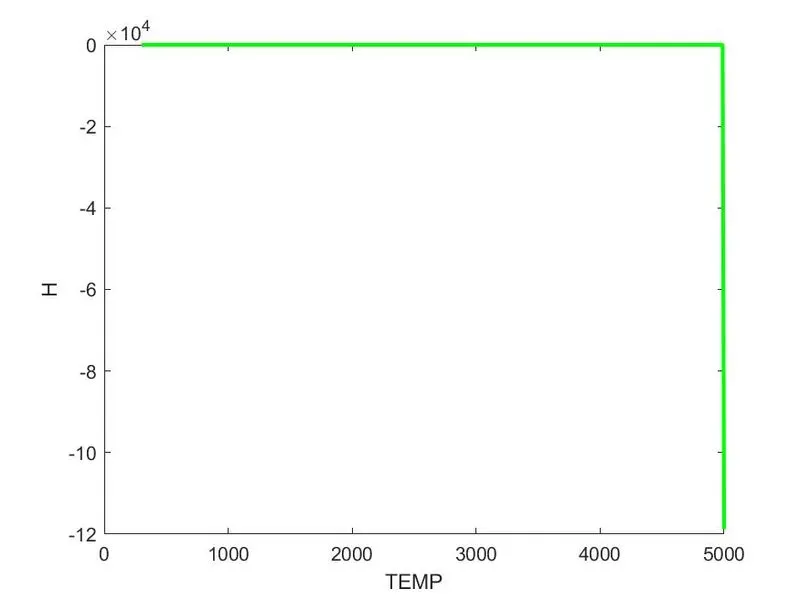
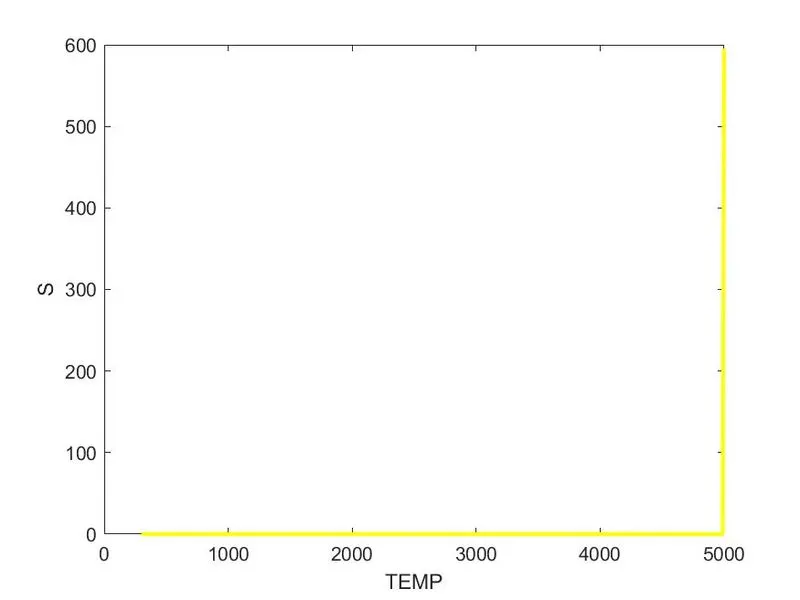
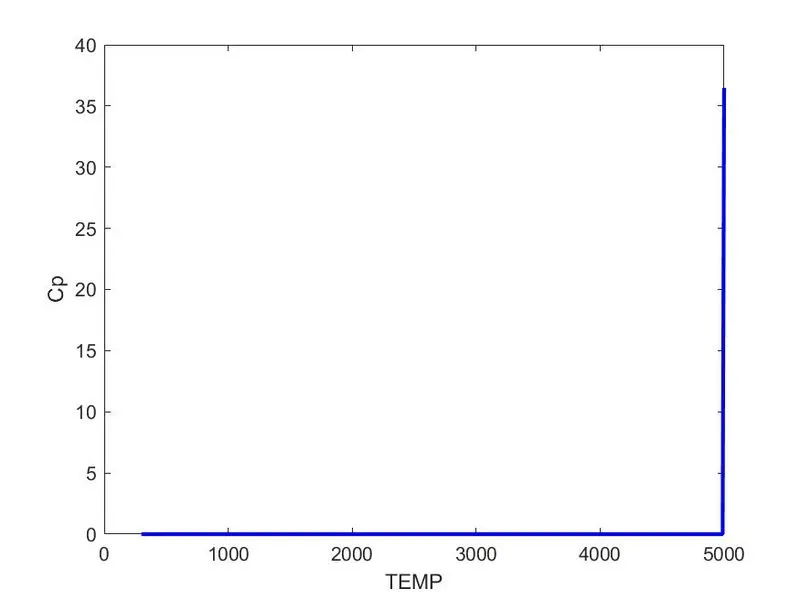
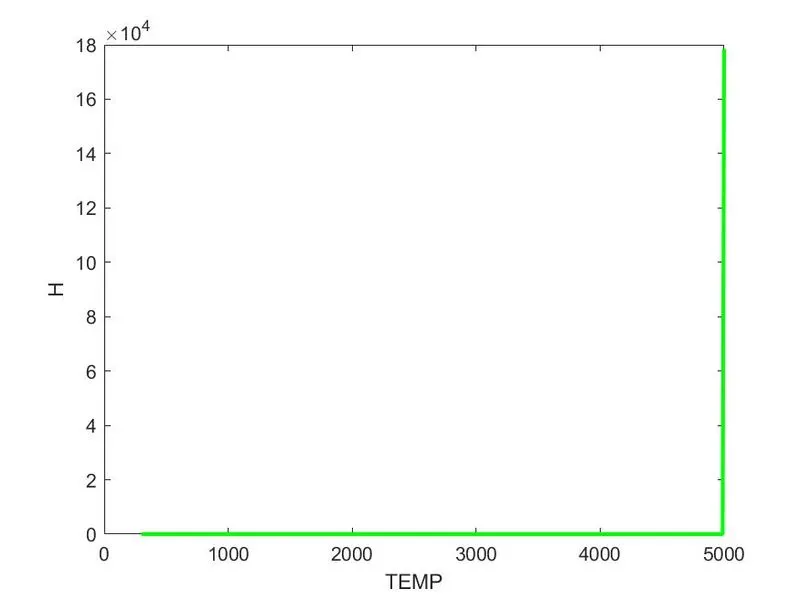
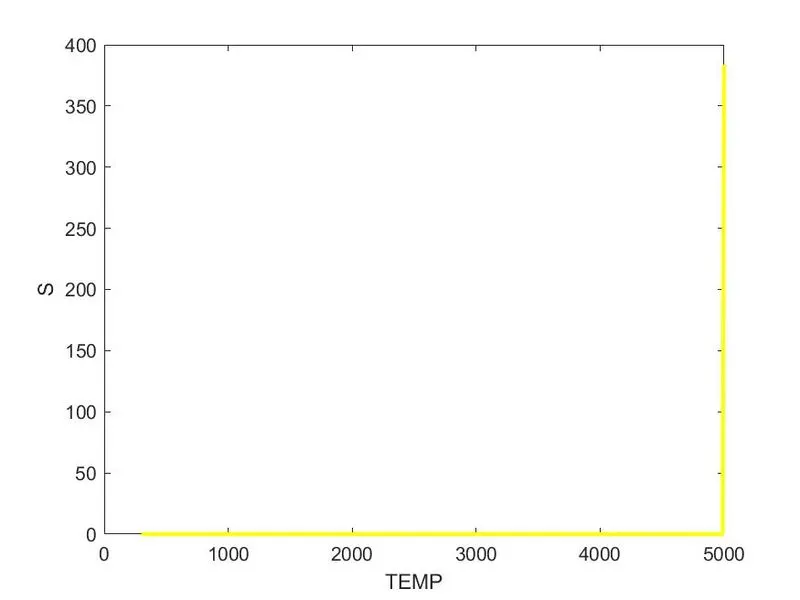
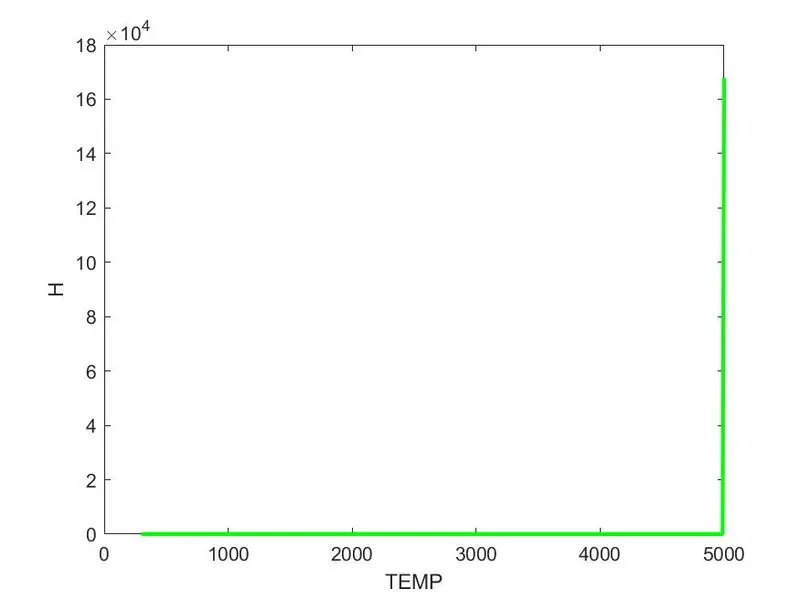
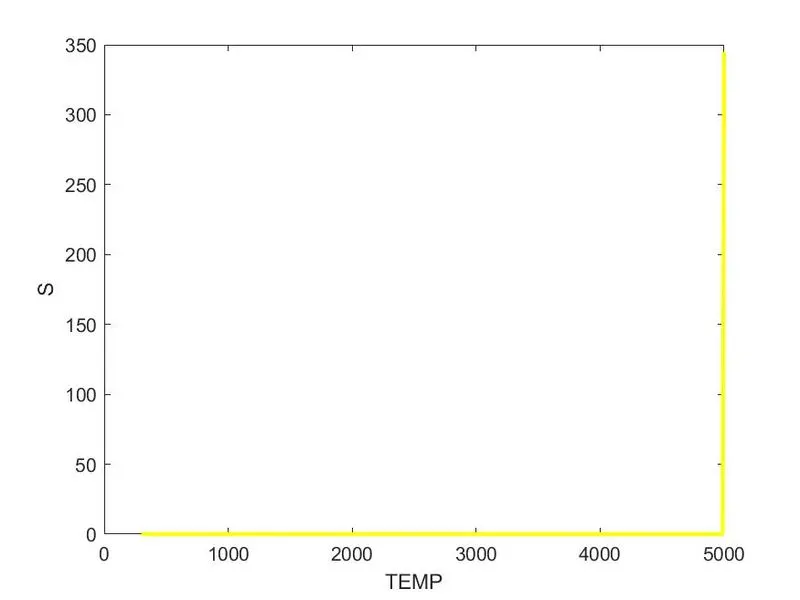
- Plot the Specific Heat(Cp),Enthalpy( H) and Entropy(S) of each species with respect to both the low and high temperature coefficients."
- Save the plots in respective folders of the species.
File Parsing;
File parsing refers to examining a file. Using file parsing. data can be extracted from the file which can be stored and be used to perform "calculations.
Here a themodynamics file generated by NASA is parsed. From which the high temperature and low temperature of various species are extracted and are further.
Specific Heat:
Specific heat is defined by the amount of heat needed to raise the temperature of 1 gram of a substance 1 degree Celsius (°C). Water has a high specific heat capacity which we'll refer to as simply "heat capacity", meaning it takes more energy to increase the temperature of water compared to other substances.
Enthalpy:
Enthalpy (H) is the sum of the internal energy (U) and the product of pressure and volume (PV) given by the equation: H=U+PV. When a process occurs at constant pressure, the heat evolved (either released or absorbed) is equal to the change in enthalpy.
Entropy:
Entropy, the measure of a system's thermal energy per unit temperature that is unavailable for doing useful work. Because work is obtained from ordered molecular motion, the amount of entropy is also a measure of the molecular disorder, or randomness, of a system.
Description of Program:
For all the Compound:
1.The file named "THERMO.dat" is given the reading access using the "fopen" comand.
2.Next line is called using the "fgetl "command and the string is split using the "strsplit" command.
3.The numbers in the string are converted using the "str2double" command.
4.The global temperatures are extracted using indexing.
5.Similarly the process is repeated in each line of the first species and the remaining coefficients and the local temperatures are extracted.
6.A function is created containing the formulas to calculate the Cp,H and S and is called in the main program."
7.A range of temperature is created using the "linspace" command.
8.The Cp,H and S is calculated for this range of temperature and the graphs are plotted.
9.A different directory is created using the ""mkdir"" command to make folders with the name of the species and the plots are saved in the particular species name."
10.A function is created to calculate the molecular weight of the species and is called in the main program.
12."if"and "strcmp" command is used to end the program after string is read as 'end'.
%%PROGRAM%%
clear all
close all
clc
%% Reading the File%%
X=fopen('THERMO.dat','r')
first_line=fgetl(X)
%%%%%%% Temparatures_Global%%%%%%%%
Y=fscanf(X,'%f \n',[1,3]);
T1=Y(1,1);
T2=Y(1,2);
T3=Y(1,3);
%%%%%%%Skiping the lines%%%%
l1=fgetl(X)
l2=fgetl(X)
l3=fgetl(X)
%%%%%% total comp
for i=1:53
Spices_line=fgetl(X)
Spices=strtok(Spices_line)
D=fgetl(X)
Z=strfind(D,'E')
a1=str2double(D(1:(Z(1)+3)));
a2=str2double(D((Z(1)+4):(Z(2)+3)));
a3=str2double(D((Z(2)+4):(Z(3)+3)));
a4=str2double(D((Z(3)+4):(Z(4)+3)));
a5=str2double(D((Z(4)+4):(Z(5)+3)));
D1=fgetl(X)
F=strfind(D1,'E')
a6=str2double(D1(1:(F(1)+3)));
a7=str2double(D1((F(1)+4):(F(2)+3)));
a8=str2double(D1((F(2)+4):(F(3)+3)));
a9=str2double(D1((F(3)+4):(F(4)+3)));
a10=str2double(D1((F(4)+4):(F(5)+3)));
D2=fgetl(X)
G=strfind(D2,'E')
a11=str2double(D2(1:(G(1)+3)));
a12=str2double(D2((G(1)+4):(G(2)+3)));
a13=str2double(D2((G(2)+4):(G(3)+3)));
a14=str2double(D2((G(3)+4):(G(4)+3)));
%Folder Creation%
mkdir('E:/XYZ/Spices_data',Spices)
t=linspace(T1,T3,400);
R=8.314
[Cp,H,S]=thermo_data(R,T2,a1,a2,a3,a4,a5,a6,a7,a8,a9,a10,a11,a12,a13,a14,t)
figure(1)
plot(t,Cp,'linewidth',2,'color','b')
xlabel('TEMP')
ylabel('Cp')
figure(2)
plot(t,H,'linewidth',2,'color','g')
xlabel('TEMP')
ylabel('H')
figure(3)
plot(t,S,'linewidth',2,'color','y')
xlabel('TEMP')
ylabel('S')
molecular_mass=molecular_weight(Spices);
saving=(['E:/XYZ/Spices_data/',Spices]);
cd(saving)
saveas(1,'Cp','jpg')
saveas(2,'H','jpg')
saveas(3,'S','jpg')
% w=fopen('molecular.txt''w')
 sprintf('%s \n  %f \n',Spices,molecular_mass);
% fclose(w);
cd('E:/XYZ/')
end
%%Thermal Data function%%
function[Cp,H,S]=thermo_data(R,T2,a1,a2,a3,a4,a5,a6,a7,a8,a9,a10,a11,a12,a13,a14,t)
Cp=zeros(size(t));
H=zeros(size(t));
S=zeros(size(t));
for i=length(t)
    if t(i)>T2
        Cp(i)=(a1+(a2*t(i))+(a3*t(i)^2)+(a4*t(i)^3)+(a5*t(i)^4))*R
        H(i)=(a1+((a2*t(i))/2)+((a3*t(i)^2)/3)+((a4*t(i)^3)/4)+((a5*t(i)^4)/5)+(a6/t(i)))*(R*t(i))
        S(i)=((a1*log(t(i)))+(a2*t(i))+((a3*t(i))/2)+((a4*t(i)^3)/3)+((a5*t(i)^4)/4)+a7)*R
    else
        Cp(i)=(a8+(a9*t(i))+(a10*t(i)^2)+(a11*t(i)^3)+(a12*t(i)^4))*R
        H(i)=(a8+((a9*t(i))/2)+((a10*t(i)^2)/3)+((a11*t(i)^3)/4)+((a12*t(i)^4)/5)+(a13/t(i)))*(R*t(i))
        S(i)=((a8*log(t(i)))+(a9*t(i))+((a10*t(i))/2)+((a11*t(i)^3)/3)+((a12*t(i)^4)/4)+a14)*R
    end
end
end
%%Molecular weight function%%
function[m]=molecular_weight(Spices_Names)
elements=['H','C','N','O','A'];
atomic_mass=[1,12,14,16,40];
m=0;
for i=1:length(Spices_Names)
    for j=1:length(elements)
        if strcmp(Spices_Names(i),elements(j))
            m=m+atomic_mass(j);
            x=j;
        end
    end
    n=str2double(Spices_Names(i));
    if n>1
        m=m+(atomic_mass(x)*(n-1));
    end
end
end
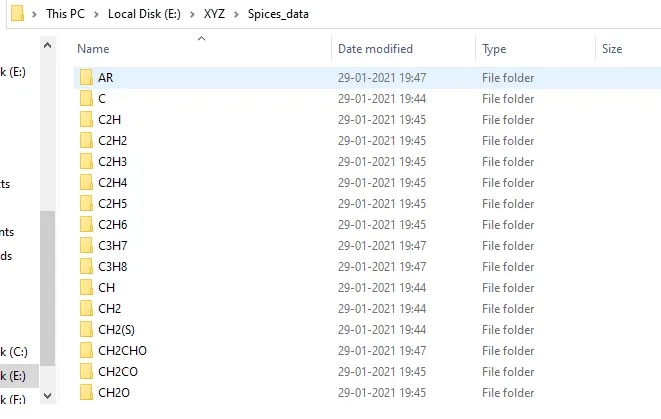
File path for saing folders:
E:\XYZ\Spices_data
Images for O2:
Images for N2:
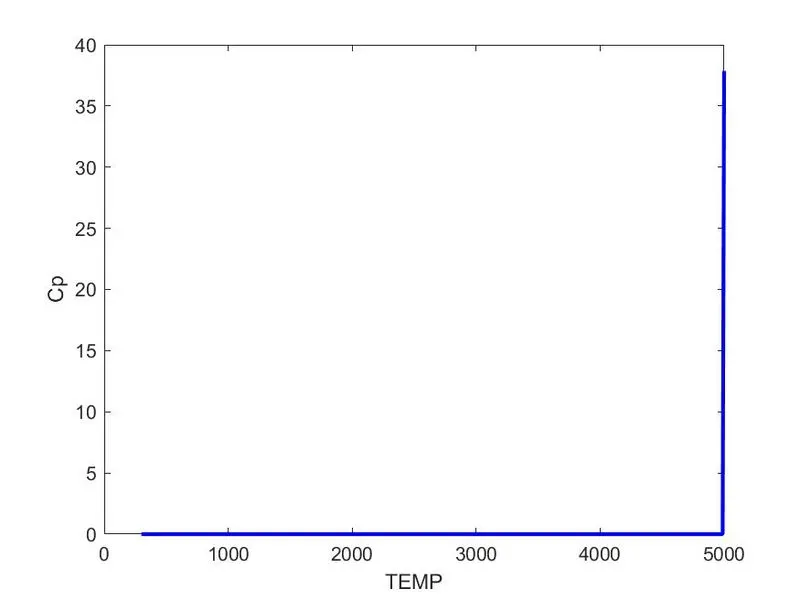
Images for Co2: