Project 1 - Parsing NASA thermodynamic data
PARSING NASA THERMODYNAMIC DATA BY MATLAB
AIM:To write a program to extract 14 co-efficients of NASA thermodynamic data and to calculate Enthaply,Entropy,Specific heat and molecular weight for each species.
OBJECTIVE:
- Write a code in matlab for reading the NASA thermodynamic data.
- calculate the Enthaply,entropy,specific heat.
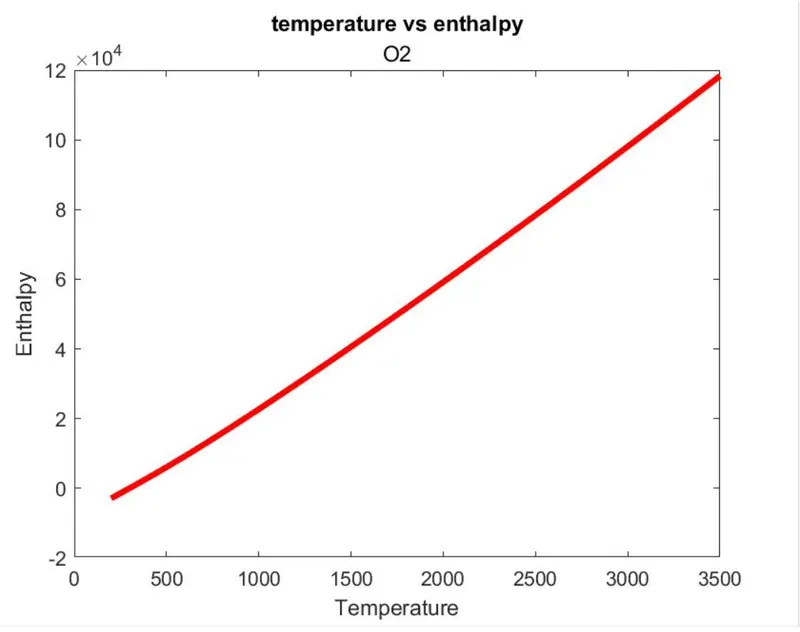
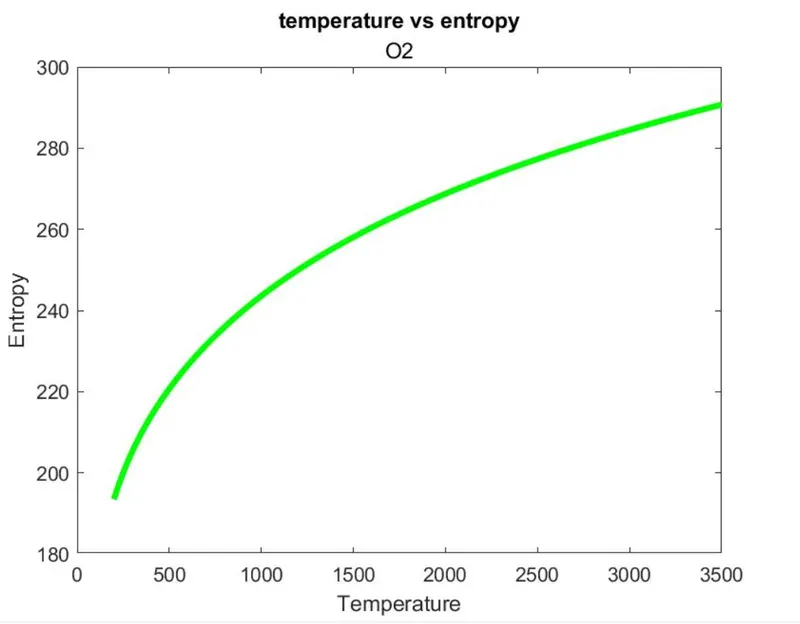
- Write a code to plot the graph for each species.
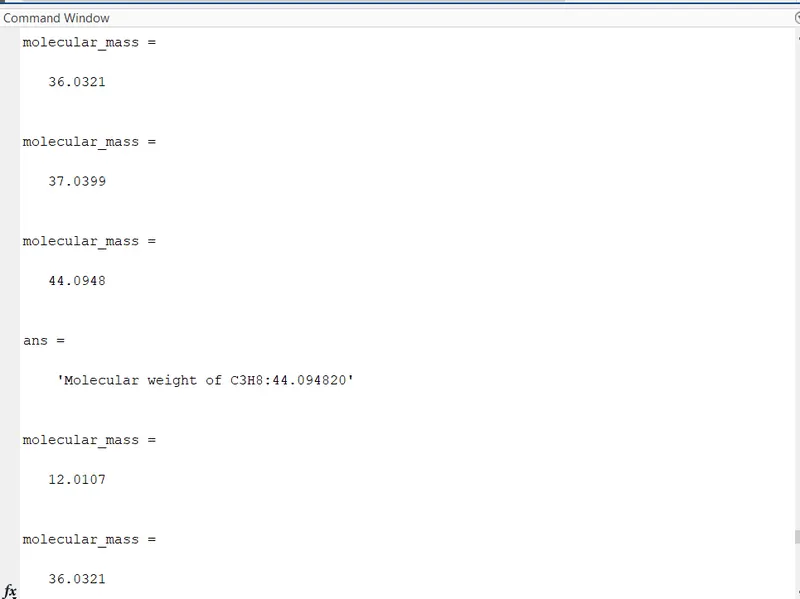
- Calculate the molecular weight and display it in command window.
FILE PARSING:Parsing, syntax analysis, or syntactic analysis is the process of analyzing a string of symbols, either in natural language, computer languages or data structures, conforming to the rules of a formal grammar.
EQUATIONS :The equations given below are the Mathematical equations to calculate Enthaply,Entropy,Specific heat.
Specific heat:

Enthaply:

ENTROPY:

Universal gas constant R=8.314 J⋅K−1⋅mol−1
T is temperature,We take temperature values between local low twmperature and local high temterature.
CODES IN MATLAB:
First part of the code:
clear all
close all
clc
%getting the data and reading the file
f1=fopen('THERMO.dat','r');
fgetl(f1);
tline=fgetl(f1);
a=strsplit(tline,' ');
global_low_temp=str2num(a{2});
global_mid_temp=str2num(a{3});
global_high_temp=str2num(a{4});
- We will start the code by closing everything in the matlab.
- We need to read the NASA thermodynamic data,so we are using fopen command to open the data and giving 'r' to read the data.The same thng we are going to save in a variable called f1.
- fgetl is used to get the information.
- strsplit is used to get the global temperature in the data.
- String is converted to number by using str2num command.
- Each value is stored in the different variable
Second part of the code:
%skipping the lines from 3 to 5
for i=3:5
    skip=fgets(f1);
end
- In the second part we are skipping the lines from 3 to 5 from the data.
- These lines are starting with '!',when a line starting with this format it is a comment in MATLAB.
- We are not going to code these comments as they are used to describe the data.
- For loop is used for the line to 3 to 5.
- fgets command is used to unread or skip the lines.
Third part of the code:
%finding the local temperature
for q=1:53;
tline2=fgetl(f1);
u=strsplit(tline2,' ');
k=strfind(tline2,'G');
v=tline2(k+4:length(tline2)-1);
q=strsplit(v,' ');
loc_low_temp=str2num(q{end-3});
loc_high_temp=str2num(q{end-2});
loc_mid_temp=str2num(q{end-1});
species_name=u{1:end};
- In the third part we should find the local temperature for each species.
- For each species the local local temperatures,local mid and high temperatures may or may not be equal in all the cases.So we need to find the local,mid and high temperature for all the species.
- There are total of 53 species.Using for loop for 53 species we can find required values.
- strfind is used to find a particular values in that line.
- As every line consists of G,we are fing the G in every line.Storing the value of G in a variable called k
- In every line after the value of G plus 4 values the local mid and high temperatures are shown in data.
- So to find the local mid and high temperature for the line we are using (end-3) for local low temp,(end-2) for local high temp,(end-1) is for local mid temperature.These values are taken from the line 'q'.
- Species name will be 1st value in the line which are stored in the variable u.
- As we are using for loop for 53 species,lines will not get repeated.
Fourth part of the code:
%finding the co-efficients

    %LINE 1 of species
    line1=fgetl(f1);
   L= findstr(line1,'E');
   c1=line1(1:L(1)+3);
     c1=str2num(c1);
   c2=line1(L(1)+4:L(2)+3);
      c2=str2num(c2);
   c3=line1(L(2)+4:L(3)+3);
      c3=str2num(c3);
   c4=line1(L(3)+4:L(4)+3);
      c4=str2num(c4);
   c5=line1(L(4)+4:L(5)+3);
      c5=str2num(c5);
      %LINE 2 of species
      line2=fgetl(f1);
    L2=findstr(line2,'E');
   c6=line2(1:L2(1)+3);
      c6=str2num(c6);
   c7=line2(L2(1)+4:L2(2)+3);
      c7=str2num(c7);
   c8=line2(L2(2)+4:L2(3)+3);
      c8=str2num(c8);
   c9=line2(L2(3)+4:L2(4)+3);
      c9=str2num(c9);
   c10=line2(L2(4)+4:L2(5)+3);
      c10=str2num(c10);
      %LINE 3 of species
      line3=fgetl(f1);
        L3=findstr(line2,'E');
   c11=line3(1:L3(1)+3);
      c11=str2num(c11);
   c12=line3(L3(1)+4:L3(2)+3);
      c12=str2num(c12);
   c13=line3(L3(2)+4:L3(3)+3);
      c13=str2num(c13);
   c14=line3(L3(3)+4:L3(4)+3);
c14=str2num(c14); - Here we are going to find the co-efficients for the species.
- Each species contains 14 coefficients,The FIRST 7 coefficients are HIGH-temperature coefficients and the SECOND 7 coefficients are LOW-temperature coefficients.
- For each line we will read the file and finds E position in the line and get the coefficeints.
- str2num is used to convert string to number.
Fifth part of the code:
%creating folder
    mkdir(['C:\Users\akash\OneDrive\Desktop\matlab\New folder\',species_name]);

  %changing the directory and saving the file
  cd(['C:\Users\akash\OneDrive\Desktop\matlab\New folder\',species_name]);

      %calculating the properties
    t=linspace(loc_low_temp,loc_high_temp,500);
    R=8.314;
     for i=1:length(t)
        if t(i)>loc_mid_temp;
            cp(i)=(c1+c2.*t(i)+c3.*t(i).^2+c4.*t(i).^3+c5.*t(i).^4).*R;
            H(i)=(c1+(c2.*t(i))./(2)+(c3.*t(i).^2)./(3)+(c4.*t(i).^3)./(4)+(c5.*t(i).^4)./(5)+(c6)./t(i)).*t(i).*R;
            S(i)=(c1.*log(t(i))+c2.*t(i)+(c3.*t(i).^2)./2+(c4.*t(i).^3)./3+(c5.*t(i).^4)./4+c7).*R;
          else
             cp(i)=(c8+c9.*t(i)+c10.*t(i).^2+c11.*t(i).^3+c12.*t(i).^4).*R;
            H(i)=(c8+(c9.*t(i))./2+(c10.*t(i).^2)./3+(c11.*t(i).^3)./4+(c12.*t(i).^4)./5+(c13)./t(i)).*t(i).*R;
            S(i)=(c8.*log(t(i))+c9.*t(i)+(c10.*t(i).^2)./2+(c11.*t(i).^3)./3+(c12.*t(i).^4)./4+c14).*R;
          end
      end
- Here we find the Enthaply,Entropy and specific heat for each species.
- The temperature values are taken from the loc temperatures.
- linspace is used to check for the multiple temperature values.
- If the temperature(i) is greater than the local mid temperature then cp,h,s values are calculated.These values are high values and vice versa.
- mkdir is used to create the folder and cd is used to change the directory.
Sixth part of the code:
%plotting
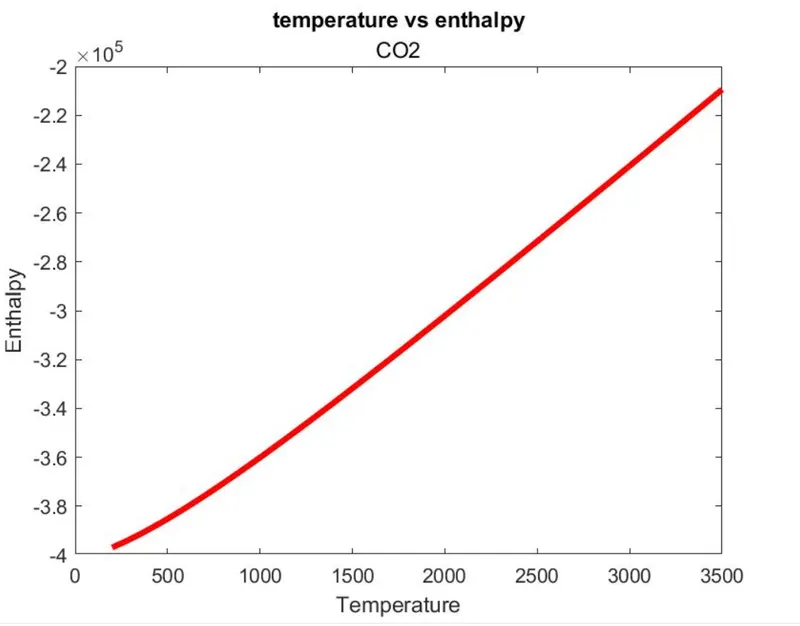
      %temperature vs Enthalpy
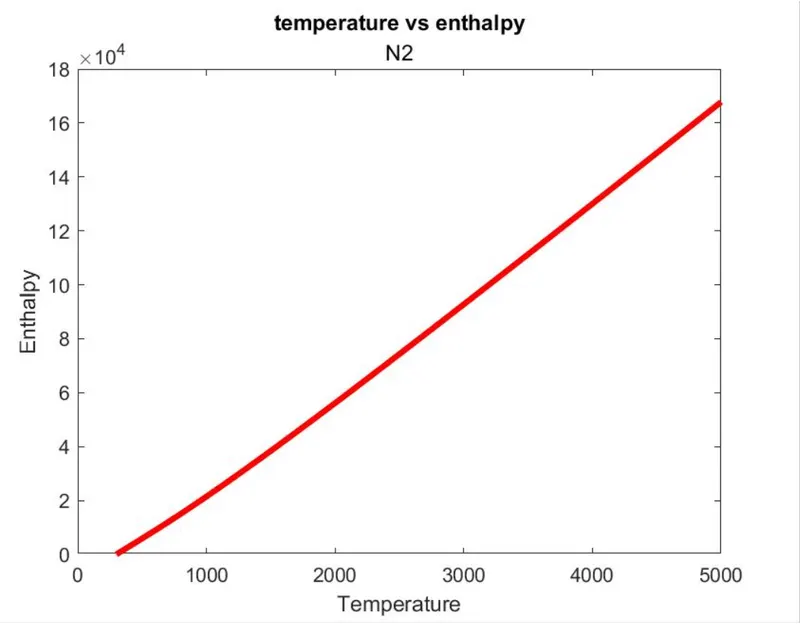
      figure(1)
      plot(t,H,'linewidth',3,'color','r')
      title('temperature vs enthalpy',species_name);
      xlabel('Temperature');
      ylabel('Enthalpy');

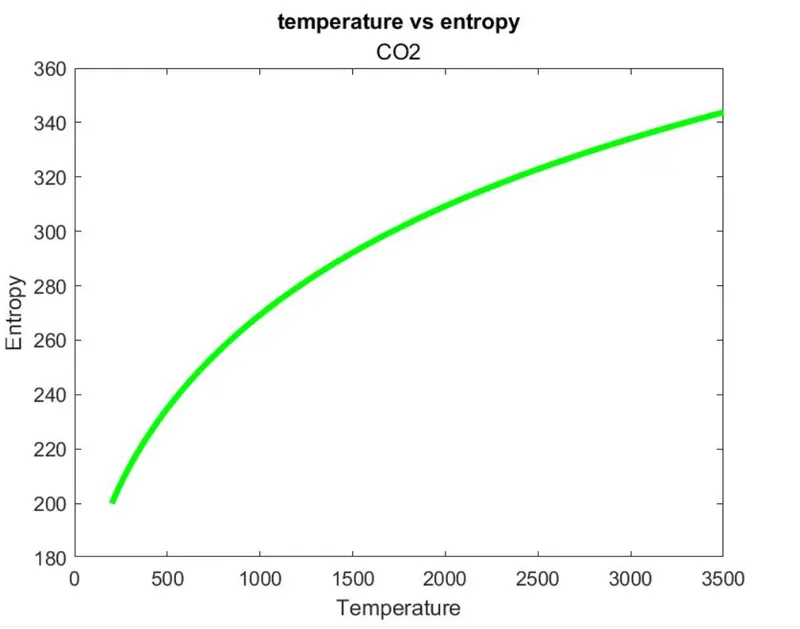
      %temperature vs Entropy

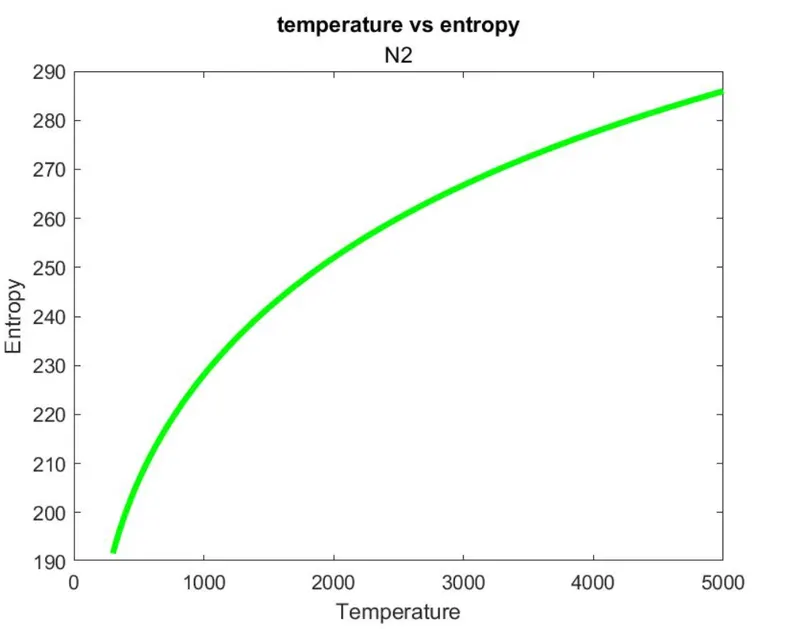
      figure(2)
      plot(t,S,'linewidth',3,'color','g');
      title('temperature vs entropy',species_name);
      xlabel('Temperature');
      ylabel('Entropy');

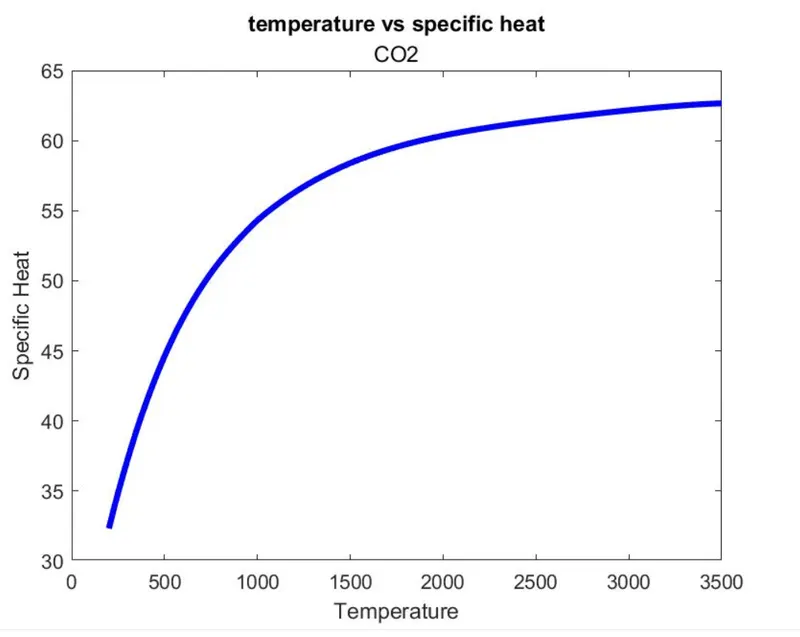
      %temperature vs specific heat

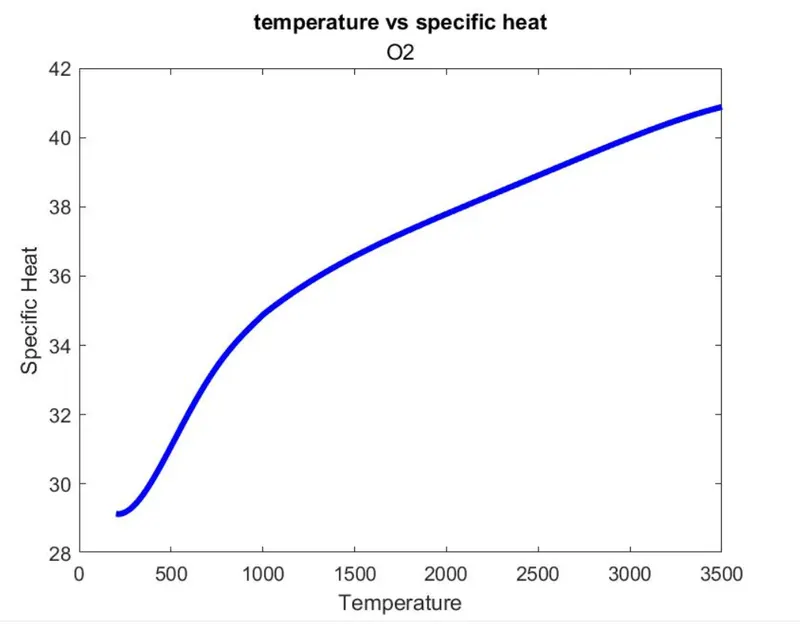
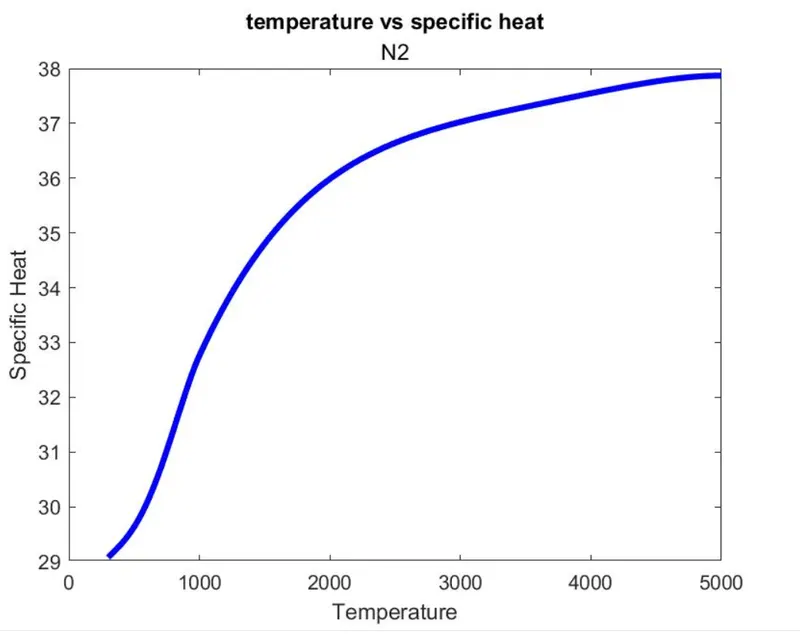
      figure(3)
      plot(t,cp,'linewidth',3,'color','b');
      title('temperature vs specific heat',species_name)
      xlabel('Temperature');
      ylabel('Specific Heat');

      %saving the plots
      saveas(1,'Enthaply.jpg');
      saveas(2,'Entropy.jpg');
saveas(3,'specific heat.jpg');- After the getting the values of the enthaply,entropy and specific heat of the species,we ned to plot the graphs.
- As every species is having the different folder we need to plot the graph for the particular species in same folder.
- There fore we will get each folder for the species and the three plots for the each species.
- Xlabel is taken as temperature in every graph.
- Y label changes for each graph as enthaply,entropy and specific heat.
- Saveas command is used to save the plots.
Seventh part of the code:
  %calculating molecular mass
      elements={'H','O','C','AR','S','N'};
      atomic_mass=[1.00784,15.99,12.0107,39.948,32.065,14.0067];
      molecular_mass=0;
      for i=1:length(species_name);
          for j=1:length(elements);
             if strcmp(species_name(i),elements(j))
                 molecular_mass=molecular_mass+atomic_mass(j)
                    pos=j;
                    break
             end
          end
          num=str2double(species_name(i));
          if num>1
              molecular_mass=molecular_mass+(atomic_mass(pos).*(num-1))
          end
      end
      sprintf('Molecular weight of %s:%f',species_name,molecular_mass)
end
- The last part will be calculating the molecular mass for each species.
- In the data we are having the constituents like 'H','O','C','AR','S','N' which are in comman. We need to take the atomic weight of these constituents which are 1.00784,15.99,12.0107,39.948,32.065,14.0067.
- Molecular weight=Atomic weight +molecular mass.
- Loops are created to calculate the molecular mass.
- strcmp is used to compare the species with the constituents and calculate the molecular mass.
- In components species some constituents are added more than once,for that another loop is created to calculate the molecular mass.
- str2double is used to convert spting to number.
- sprintf is used to display the molecular weight.
COMPLETE CODE:
clear all
close all
clc
%getting the data and reading the file
f1=fopen('THERMO.dat','r');
fgetl(f1);
tline=fgetl(f1);
a=strsplit(tline,' ');
global_low_temp=str2num(a{2});
global_mid_temp=str2num(a{3});
global_high_temp=str2num(a{4});

%skipping the lines from 3 to 5
for i=3:5
    skip=fgets(f1);
end
%finding the local temperature
for q=1:53;
tline2=fgetl(f1);
u=strsplit(tline2,' ');
k=strfind(tline2,'G');
v=tline2(k+4:length(tline2)-1);
q=strsplit(v,' ');
loc_low_temp=str2num(q{end-3});
loc_high_temp=str2num(q{end-2});
loc_mid_temp=str2num(q{end-1});
species_name=u{1:end};

%finding the co-efficients
   %LINE 1 of species
    line1=fgetl(f1);
   L= findstr(line1,'E');
   c1=line1(1:L(1)+3);
     c1=str2num(c1);
   c2=line1(L(1)+4:L(2)+3);
      c2=str2num(c2);
   c3=line1(L(2)+4:L(3)+3);
      c3=str2num(c3);
   c4=line1(L(3)+4:L(4)+3);
      c4=str2num(c4);
   c5=line1(L(4)+4:L(5)+3);
      c5=str2num(c5);
      %LINE 2 of species
      line2=fgetl(f1);
    L2=findstr(line2,'E');
   c6=line2(1:L2(1)+3);
      c6=str2num(c6);
   c7=line2(L2(1)+4:L2(2)+3);
      c7=str2num(c7);
   c8=line2(L2(2)+4:L2(3)+3);
      c8=str2num(c8);
   c9=line2(L2(3)+4:L2(4)+3);
      c9=str2num(c9);
   c10=line2(L2(4)+4:L2(5)+3);
      c10=str2num(c10);
      %LINE 3 of species
      line3=fgetl(f1);
        L3=findstr(line2,'E');
   c11=line3(1:L3(1)+3);
      c11=str2num(c11);
   c12=line3(L3(1)+4:L3(2)+3);
      c12=str2num(c12);
   c13=line3(L3(2)+4:L3(3)+3);
      c13=str2num(c13);
   c14=line3(L3(3)+4:L3(4)+3);
      c14=str2num(c14);

%creating folder
    mkdir(['C:\Users\akash\OneDrive\Desktop\matlab\New folder\',species_name]);

  %changing the directory and saving the file
  cd(['C:\Users\akash\OneDrive\Desktop\matlab\New folder\',species_name]);

      %calculating the properties
    t=linspace(loc_low_temp,loc_high_temp,500);
    R=8.314;
     for i=1:length(t)
        if t(i)>loc_mid_temp;
            cp(i)=(c1+c2.*t(i)+c3.*t(i).^2+c4.*t(i).^3+c5.*t(i).^4).*R;
            H(i)=(c1+(c2.*t(i))./(2)+(c3.*t(i).^2)./(3)+(c4.*t(i).^3)./(4)+(c5.*t(i).^4)./(5)+(c6)./t(i)).*t(i).*R;
            S(i)=(c1.*log(t(i))+c2.*t(i)+(c3.*t(i).^2)./2+(c4.*t(i).^3)./3+(c5.*t(i).^4)./4+c7).*R;
          else
             cp(i)=(c8+c9.*t(i)+c10.*t(i).^2+c11.*t(i).^3+c12.*t(i).^4).*R;
            H(i)=(c8+(c9.*t(i))./2+(c10.*t(i).^2)./3+(c11.*t(i).^3)./4+(c12.*t(i).^4)./5+(c13)./t(i)).*t(i).*R;
            S(i)=(c8.*log(t(i))+c9.*t(i)+(c10.*t(i).^2)./2+(c11.*t(i).^3)./3+(c12.*t(i).^4)./4+c14).*R;
          end
      end
      %plotting
      %temperature vs Enthalpy
      figure(1)
      plot(t,H,'linewidth',3,'color','r')
      title('temperature vs enthalpy',species_name);
      xlabel('Temperature');
      ylabel('Enthalpy');

      %temperature vs Entropy

      figure(2)
      plot(t,S,'linewidth',3,'color','g');
      title('temperature vs entropy',species_name);
      xlabel('Temperature');
      ylabel('Entropy');

      %temperature vs specific heat

      figure(3)
      plot(t,cp,'linewidth',3,'color','b');
      title('temperature vs specific heat',species_name)
      xlabel('Temperature');
      ylabel('Specific Heat');

      %saving the plots
      saveas(1,'Enthaply.jpg');
      saveas(2,'Entropy.jpg');
      saveas(3,'specific heat.jpg');


      %calculating molecular mass
      elements={'H','O','C','AR','S','N'};
      atomic_mass=[1.00784,15.99,12.0107,39.948,32.065,14.0067];
      molecular_mass=0;
      for i=1:length(species_name);
          for j=1:length(elements);
             if strcmp(species_name(i),elements(j))
                 molecular_mass=molecular_mass+atomic_mass(j)
                    pos=j;
                    break
             end
          end
          num=str2double(species_name(i));
          if num>1
              molecular_mass=molecular_mass+(atomic_mass(pos).*(num-1))
          end
      end
      sprintf('Molecular weight of %s:%f',species_name,molecular_mass)
end
ERRORS:

- Corrected by using f1

- corrected by using ^
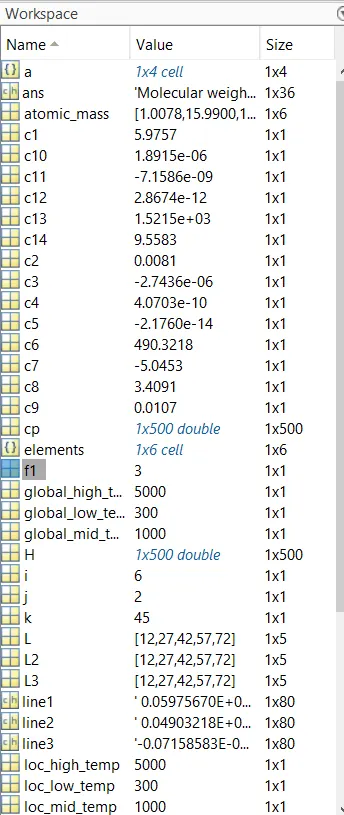
SCREENSHORTS OF FOLDERS AND RESULTS:
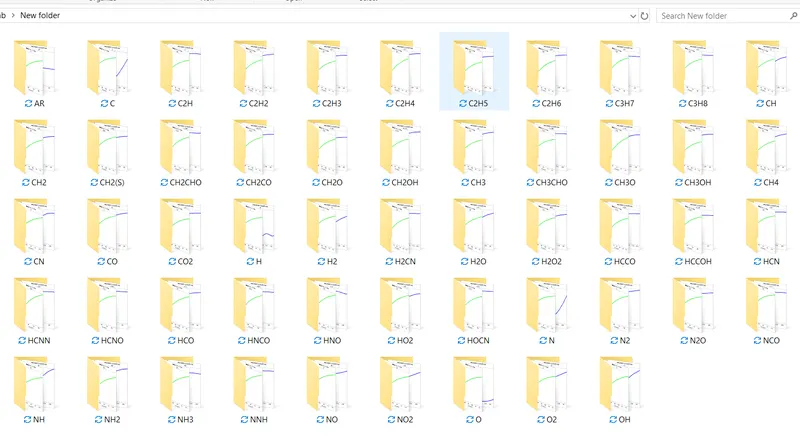
PLOTS OF SPECIES:
O2:
N2:
CO2: