Project 1 - Parsing NASA thermodynamic data
AIM:
1. To parse data from NASA'S Thermodynamic data file.
2.To calculate the Entropy,Enthalpy,Specific heat and Molecular weight of the elements listed in the file.
THESIS:
Parsing is the process of analyzing a string of symbols,either in natural languages,computer languages of data structures,conforming to the rules of a formal grammer . In computational linguistics the term is used to refer to the formal analysis by a computer of a sentence or other string of words into its constituents resulting in a parse tree showing their syntactic relation to each other,which may also contain semantic and other information .the term may also be used to describe a split or seperation.
specific heat:
Specific heat, ratio of the quantity of heat required to raise the temperature of a body one degree to that required to raise the temperature of an equal mass of water one degree.
enthalpy:
Enthalpy is a property of a thermodynamic system, defined as the sum of the system's internal energy and the product of its pressure and volume. It is a convenient state function preferred in many measurements in chemical, biological, and physical systems at a constant pressure.
entropy:
statistical mechanics, entropy is an extensive property of a thermodynamic system. It quantifies the number Ω of microscopic configurations that are consistent with the macroscopic quantities that characterize the system.
Molecular weight :
the relative average weight of a molecule of a substance, expressed by a number equal to the sum of the atomic weights of all atoms in the molecule
code for parsing nasa thermodynamic :
clear all
close all
clc
%step 1: load file
f=fopen('THERMO.dat.txt','r');
fget1(f);%skip first line
tempL=str2num(fget1(f));%store value of temperature in variable
globle_mid_temp=tempL(1);
globle_mid_temp=tempL(2);
globle_high_temp=tempL(3);
%step 2:skip the lines of disclaimer/unwanted lines.
for i=1:3
    fgetl(f);
end
%step 3: create loop for all spicies that calculate data,plot graphs and calculate molecular weight
for k=1:4:212
    line1=fget1(f);%store first line in variable.
    l=strsplit(line1,'');%split all line by space
    ml=length(l);
    spicies=l{1};
    low_temp=str2double(l(m1-3));%store the value of local temperature
    high_temp=str2double(l(m1-2));
    mid_temp=str2double(l(m1-1));
    for
        line2=fget(1);%store second line in variable .
        a=strfind(line2,'E');%find position of E and create individual coefficient
        a1=str2double(line2(1:a(1)+3));
        a2=str2double(line2(1:(a(1)+4):(a(2)+3)));
        a3=str2double(line2(1:(a(1)+4):(a(3)+3)));
        a4=str2double(line2(1:(a(1)+4):(a(4)+3)));
        a5=str2double(line2(1:(a(1)+4):(a(5)+3)));

        line3=fget1(f);%store value of third line in variable.
        b=strfind(line3,'E');%find position of E and create individual coefficient
        a6=str2double(line3(1:b(1)+3));
        a7=str2double(line3(b(1)+4:b(2)+3));
        a8=str2double(line3(b(2)+4:b(3)+3));
        a9=str2double(line3(b(3)+4:b(4)+3));
        a10=str2double(line3(b(4)+4:b(5)+3));

        line4=fget1(f);%store value of third line in variable.
        c=strfind(line4,'E');%find position of E and create individual coefficient
        a11=str2double(line4(1:c(1)+3));
        a12=str2double(line4(c(1)+4:c(2)+3));
        a13=str2double(line4(c(2)+4:c(3)+3));
        a14=str2double(line4(c(3)+4:c(4)+3));
        a15=str2double(line4(c(4)+4:c(5)+3));

        temp_lower=linspace(low_temp,mid_temp,100);%create lower temperature range
        temp_higher=linspace(mid_temp,high_temp,100);%create higher temperature range

        R=8.314;%universal gas constant(J/mol.k)
        %step1 3.1:calculate Cp,H and S
        for j=1:100
            C_p1(j)=(a8+a9*temp_lower(j)+a10*temp_lower(j)^2+a11*temp_lower(j)^3+a12*temp_lower(j)^)*R
            H1(j)=(a8+(a9*temp_lower(j))/2+(a10*temp_lower(j)^2)/3+(a11*temp_lower(j)^3/4+a12*temp_lower(j)^4/5)+a13/temp(j))*temp_lower(j)*R
            S1(j)=(a8*log(temp_lower(j))+a9*temp_lower(j)+(a10*temp_lower(j)^2/+(all*temp_lower(j)^3)/(a12*temp_lower(j)^4)/4+a14)*R
        end
        for
            c_p2(j)=(a1+a2*temp_higher(j)+a3*temp_higher(j)^2+a4*temp_higher(j)^3+a5*temp_higher(j)^4)*R;
            H2(j)=(a1+(a2*temp_lower(j))/2+(a3*temp_lower(j)^2)/3+(a4*temp_lower(j)^3/4+a5*temp_lower(j)^4/5)+a6/temp(j))*temp_lower(j)*R
            S2(j)=(a1*log(temp_lower(j))+a2*temp_lower(j)+(a3*temp_lower(j)^2/+(a4*temp_lower(j)^3)/(a5*temp_lower(j)^4)/4+a7)*R

        end
        %step 3.2:create folder
        nasa_file=spicies;
        mkdir(nasa_file)
        current_dir=pwd;
        cd(nasa_file)

        %step 3.3 : plot Cp vs temperature
        figure(1)
        plot(temp_lower,C_p1,'linewidth',2);
        hold on
        plot(temp_higher,C_p2,'linewidth',2);
        hold off
        xlabel('temperature in k');
        ylabel('specific heat(J/mol.k)');
        title(['temperature vs enthalpy for',species]);
        legend('low temperature','high temperature');
        fig=sprintf('Cp_of_%s.png',spicies);
        saveas(gca,fig);

         %step 3.4 : plot H vs temperature
        figure(2)
        plot(temp_lower,H1,'linewidth',2);
        hold on
        plot(temp_higher,H2,'linewidth',2);
        hold off
        xlabel('temperature in k');
        ylabel('enthalpy(J)');
        title(['temperature vs enthalpy for',species]);
        legend('low temperature','high temperature');
        fig=sprintf('H_of_%s.png',spicies);
        saveas(gca,fig);

         %step 3.4 : plot S vs temperature
        figure(3)
        plot(temp_lower,S1,'linewidth',2);
        hold on
        plot(temp_higher,S2,'linewidth',2);
        hold off
        xlabel('temperature in k');
        ylabel('Entropy(J/k)');
        title(['temperature vs enthalpy for',species]);
        legend('low temperature','high temperature');
        fig=sprintf('S_of_%s.png',spicies);
        saveas(gca,fig);
        cd(current_dir);


    end
end
%step : calculate molecular weight
atom=['H','C','O','N','R','S']; %atoms available in data | R stands for Argon
atm_weight=[1.00784 12.0107 15.0107 15.999 14.0067 39.948 32.065]; % atomic weight of these molecules
M_weight=0;
current_species=char(spicies);%converting  1*1 string cells into a character
for i=length(current_species)
    for j=length(atom)
        if strcmp(current_species(i),atom(j))
            M_weight=M_weight+atm_weight(j)%store values in character match
            position=j;%store position
        end
    end
    %used for multipication into the number of atoms
    n=str2double(current_species(i));
    if n>1
        M_weight=M_weight+atm_weight(position)*(n-1);
    end
    %display molecular weight
    fprintf('molecular weight of %s : %f un',current_species,M_weight)
end
code explanation:
1.all the extra windows and old data is cleared with the help of close all,clear all,clc
2.then we read thermo.dat.txt file to calculate enthalpy,entropy and specific heat
3.to access the next line we have used the command fgetL
4.to split the given value in the line we have used strsplit
5.then we have calculated value for species
6.now we calculate Cp, H & S for lower and higher temperature limits
7.after putting all the values of a in respectivecommands of enthalpy,entropy and specific heat we have to plot the graphs to see the nature of graphs and the values
8.after program get executed the cd(current_dir) command helps to return to the original directory
outputs:
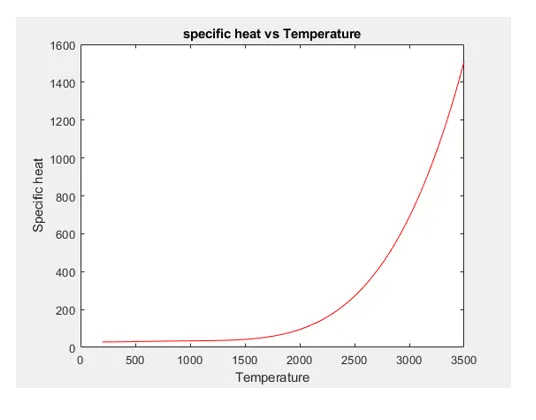
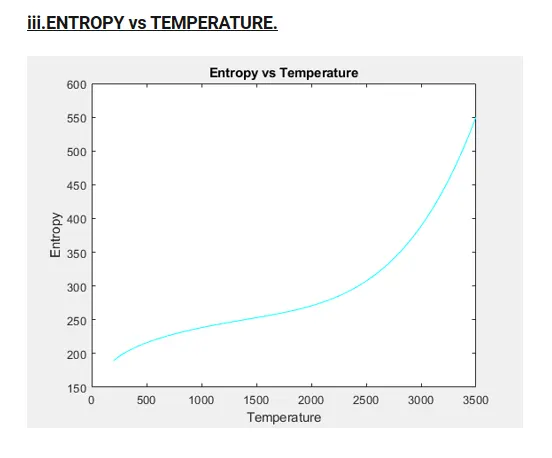
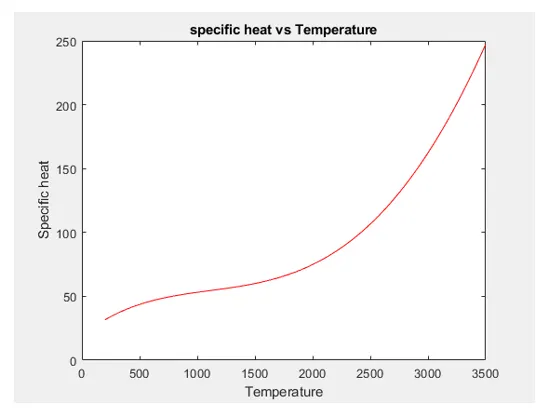
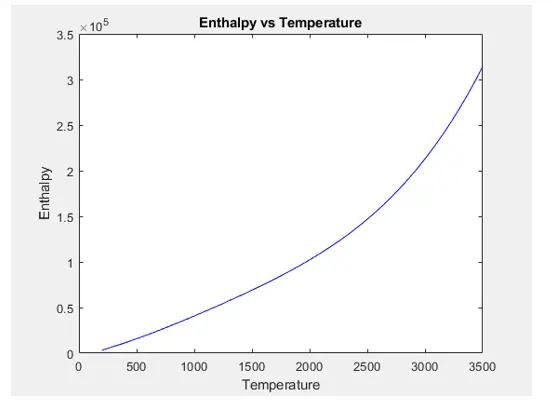
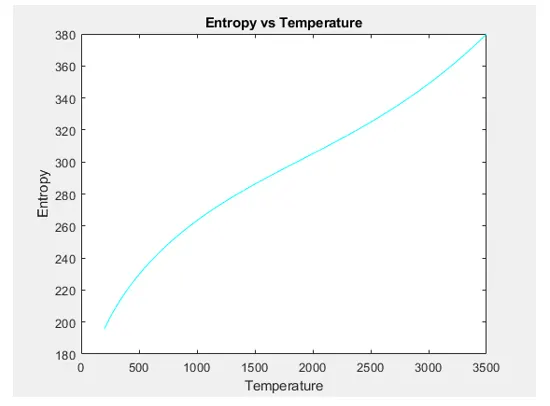
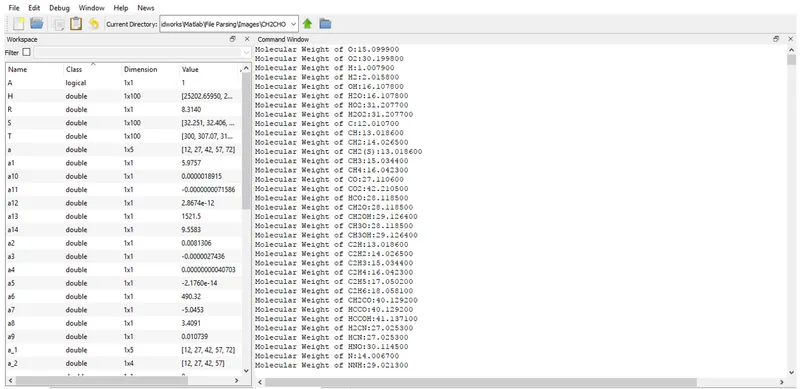
conclusion: the file parsing of nasa thermodynamic data includes several modules & we converted them all into useful form,plotting the relations & saving them automatically into required current location.the different plot for each element shows the relation & trend between thermodynamic properties like enthalpy,entropy,specific heat with respect to temperature.