Project 1 - Parsing NASA thermodynamic data
Parsing NASA thermodynamic data using MATLAB/OCTAVE
Objective: The objective of the project is to write a program which can extract required coefficients from a file containing NASA thermodynamic data, and to calculate parameters such as enthalpy, entropy, molar weight and specific heat, as well as plotting the graphs of the parameters obtained.
Report:
The entire project consists of the main program, which calls multiple functions to extract the coefficients, names, temperatures and plotting the graphs. The project also mostly deals with extracting strings from the data file. A string is an array of characters, just like a matrix is an array of numbers. The difference between a string and a matrix is that a string is stored and assigned a character class (char) within the program, whereas it is (double) fo a matrix. A step wise summary is given below regarding the logic used throughout the project, with each program for the function is explained in every step.
1) Main Program:
%program for parsing NASA thermodynamic data

clear all
close all
clc

R = 8.314;                             %gas constant
f = fopen('THERMO.dat','r');           %opening the file THERMO.dat, and specifying the function to only read the file

for i=1:5;                             %skipping unwanted lines
    skip=fgetl(f);
end

line=0;                                %specifying a counter to count the lines in the file
for i=1:400
    L1 = fgetl(f);                     %keyword to get a line

    if strcmp(L1,"END") == 1           %searching for "END" string
        break                          %terminating the loop when the read function reaches the last line
    else
    line = line+1;                     %increment for the counter
    end
end

specie =(line)/4                       %No. of species in the file
frewind(f)                             %rewinds the read function back to the beginning of the file

folder = 'elements';                   %creating the folder where the plots for the elements are stored
mkdir(folder);                         %specifying the directory for storing the folders

for i=1:5;                             %skipping unwanted lines again
    skip=fgetl(f);
end

for j=1:specie                                       %for loop runs for the no. of species calculated
  [sp_line,species_name] = sp_name(f);               %function for extracting the name of the specie
  [TLOW,THIGH,TMEDIUM] = local_temp(sp_line);        %function for extracting the local temperatures of the specie
  T = linspace(TLOW,THIGH,100);                      %specifying the temperature range for the plots by using the extracted local temps.
  E = coeff(f);                                      %function for extracting the coefficients of the specie in the data file
  CP = spec_heat(TMEDIUM,T,E,R);                     %function for calulating specific heat
  H = enthalpy(TMEDIUM,T,E,R);                       %function for calulating enthalpy
  S = entropy(TMEDIUM,T,E,R);                        %function for calulating entropy
  M = molarw(species_name);                          %function for calulating molar weight
  plots_nasa(T,H,S,CP,species_name,folder);          %function for plotting graphs for the specie using extracted data
end
fclose(f);                                           %closing the file
The main program begins with the standard clear all, close all and clc to clear the workspace, close open windows and clear the command window every time the program is run. The gas constant is specified. The NASA data file is opened in MATLAB using the 'fopen' command. The command asks for the name of the file, which is THERMO.dat, and also asks for the action to be performed on the file, which is read(r). Next, the 'fgetl' command is used to read a line from the file. Every time this command is used, it reads the line below the current one. In the NASA file, the first five lines are extra information to be skipped. So a for loop with fgetl is used to skip the first 5 lines. A counter is assigned as 0. This counter will count the total number of lines in the file. The file has "END" at the bottom of the file. So the for loop is executed in such a way that it terminates when the "END" word is reached. This is detected by using the 'strcmp' command, which compares two strings. When the strcmp gives an output 1 (true condition), the loop terminates using the 'break' keyword. Otherwise the line variable is incremented by 1 till the loop ends. Next, the line output is divided by 4, since each specie has 4 lines, and saved as no. of species. Then the 'frewind' command is used to rewind the read function back to the top of the file. The folder called elements is created to store the specie plots. The unwanted lines are skipped again. Now, using the no.of species, the for loop is executed for calling the required functions such as name extraction, plotting and calculating various parameters, into the main program. Every iteration works for one specie at a time. After the loops are completed, the 'fclose' command is used to close the file.
2) Function for extracting the specie name:
%function for extracting the specie name

function[sp_line,species_name] = sp_name(f)
sp_line = fgetl(f);                                %specifying the line as a string
species_name = sp_line(1:6);                       %extracting the first 6 elements of the string
end
This function extracts the name of the specie. First, the line is stored as a string. Then the first 6 characters of the string are selected and stored. The longest species name is 6 characters long, and hence the number 6 is considered. For shorter names, the extra blank characters after the name are considered.
3) Function for extracting the local temperatures:
%function for extracting the local temperatures of the specie

function[TLOW,THIGH,TMEDIUM] = local_temp(sp_line)
Y = strsplit(sp_line,'  ');                             %splitting the string at '  ' (double space)
Z = numel(Y);                                           %calculating the number of elements created in stringsplit

if Z == 8
TLOW = str2num(Y{5});                                   %converting the string to numeric value
THIGH = str2num(Y{6});
TMEDIUM = str2num(Y{7});

elseif Z == 9
TLOW = str2num(Y{6});
THIGH = str2num(Y{7});
TMEDIUM = str2num(Y{8});

elseif Z == 10
TLOW = str2num(Y{7});
THIGH = str2num(Y{8});
TMEDIUM = str2num(Y{9});
endif
end
This function extracts the local temperatures (i.e. low, medium and high temperatures) for the specie. First, the 'strsplit' command is used. The command splits the string at specified delimiters. In this case, the delimiter is a double space(' '). So the strsplit command splits the string using the delimiter. Now the string is split into multiple smaller strings and stored in variable 'Y'. Now, the no. of strings of the variable is counted using the 'numel' command. The strings are counted because the no. of strings after splitting the string are not the same for every specie. It varies from 8 to 10. So the if condition is used for all 3 outputs for numel. On finding the correct output of numel, the low, high and medium temperatures are extracted in that order. The 'str2num' command then converts the specific strings that represent the temperature to numeric values(i.e from char to double).
4) Function for extracting the coefficients from the data file:
%function for extracting the coefficients from the data file

function[E] = coeff(f)

f1 = fgetl(f);                     %selecting the first line with coefficients
Q = strfind(f1,'E');               %finding 'E' within the string

%line 1 of coefficients
a1 = f1(1:Q(1)+3);                 %selecting the part of the string representing the first coefficient, using the position of 'E'
A1 = str2num(a1);                  %converting the coefficient from string to numeric value
a2 = f1(Q(1)+4:Q(2)+3);            %second coefficient
A2 = str2num(a2);
a3 = f1(Q(2)+4:Q(3)+3);            %third coefficient
A3 = str2num(a3);
a4 = f1(Q(3)+4:Q(4)+3);            %fourth coefficient
A4 = str2num(a4);
a5 = f1(Q(4)+4:Q(5)+3);            %fifth coefficient
A5 = str2num(a5);

f2 = fgetl(f);                     %selecting the second line with coefficients
R = strfind(f2,'E');               %finding 'E' within the string

%line 2 of coefficients
b1 = f2(1:R(1)+3);
B1 = str2num(b1);
b2 = f2(R(1)+4:R(2)+3);
B2 = str2num(b2);
b3 = f2(R(2)+4:R(3)+3);
B3 = str2num(b3);
b4 = f2(R(3)+4:R(4)+3);
B4 = str2num(b4);
b5 = f2(R(4)+4:R(5)+3);
B5 = str2num(b5);

f3 = fgetl(f);                     %selecting the third line with coefficients
S = strfind(f3,'E');               %finding 'E' within the string

%line 3 of coefficients
c1 = f2(1:S(1)+3);
C1 = str2num(c1);
c2 = f2(S(1)+4:S(2)+3);
C2 = str2num(c2);
c3 = f2(S(2)+4:S(3)+3);
C3 = str2num(c3);
c4 = f2(S(3)+4:S(4)+3);
C4 = str2num(c4);

E = [ A1 A2 A3 A4 A5 B1 B2 B3 B4 B5 C1 C2 C3 C4 ];           %storing the values in a matrix

 end
The main data within the NASA file are the coefficients. There are 14 coefficients for every specie, with the first 7 are high temperature coefficients and the next 7 are low temperature coefficients. The coefficients are useful for calculating parameters such as enthalpy, entropy and specific heat.
First, the function utilises the fgetl command to move to the line below the one containing the specie name and the local temperatures. This line is assigned a value. Next, the 'strfind' command is used to find a specific character within a specified string, in this case the latest line extracted. 'E', as in exponent, is the character assigned to the command, which in turn checks for the letter. 'E' is chosen because of its proximity to the end of the number. The strfind gives an output which indicates the position numbers at which the 'E' exists within that line's string. Knowing the positions of 'E', the coefficients can be split easily. The coefficient is extracted by assigning the string for the coefficients within the line string using the output of strfind. For the first coefficient, the first character is chosen as the initial position (i.e. position 1). For the final position, the first position for 'E' from strfind is considered. Since the number format is in 'E+00' or 'E-00', logically the last term of the range within the line string should include the 3 characters coming after 'E'. So the final position is given as 'Q(1)+3', where Q(1) indicates the first position of 'E' determined by strfind Q and '+3' meaning the position 3 characters after 'E'. After the required coefficient is extracted, the string is converted to number using 'str2num'. For the next coefficient, the same procedure is followed, but now the initial and final positons are assigned with respect Q(1) and Q(2). For the third coefficient it is with respect to Q(2) and Q(3) and so on. This is done for the second and third lines of coefficients as well. After all the 14 coefficients are extracted and converted to numbers, the numbers are stored in an array to be accessed later on.
5) Function for calculating the specific heat:
%function for calulating specific heat

function[CP] = spec_heat(TMEDIUM,T,E,R)

%Cp = R(A1 +A2.T + A3.T^2 + A4.T^3 + A5.T^4)

for i = 1:length(T)
  if T(i) <= TMEDIUM
    CP = (E(8) + E(9).*T + E(10).*T.^2 +E(11).*T.^3 + E(12).*T.^4).*R;       %lower temperature range
  else
    CP = (E(1) + E(2).*T + E(3).*T.^2 +E(4).*T.^3 + E(5).*T.^4).*R;          %upper temperature range
  endif
endfor
end
For calculating the specific heat, the function takes the extracted medium temperature, the temperature range, the coefficients and the gas constant as the inputs. The formula for calculating the specific heat is:
Cp = R(A1 + A2.T + A3.T^2 + A4.T^3 + A5.T^4)
where A1 through A5 are the coefficients given in the data file, and T is the temperature range. In the data file, the first 7 coefficients are high temperature ones and the next 7 are low temperature ones. So by using a for loop to go through every temperature in the range, the if condition is utilised to check the temperature. If the temperature is below the medium temperature, the second set of coefficients (8 through 12 in this case) are counted. Otherwise the first set (1 through 5) are considered.
6) Function for calculating the enthalpy:
%function for calulating enthalpy

function[H] = enthalpy(TMEDIUM,T,E,R)

%H = RT(A1 +A2.T/2 + A3.T^2/3 + A4.T^3/4 + A5.T^4/5 + A6/T)

for i = 1:length(T)
  if T(i) <= TMEDIUM
    H = (E(8) + E(9).*T./2 + E(10).*(T.^2)./3 +E(11).*(T.^3)./4 + E(12).*(T.^4)./5 + E(13)./T).*R.*T;     %lower temperature range
  else
    H = (E(1) + E(2).*T./2 + E(3).*(T.^2)./3 +E(4).*(T.^3)./4 + E(5).*(T.^4)./5 + E(6)./T).*R.*T;         %upper temperature range
  endif
endfor
end
The inputs are same as that for the previous code. The same procedure is also followed for this code, with the only difference being the formula for calculating the enthalpy and the number of coefficients (1 through 6 and 8 through 13).
H = RT(A1 +A2.T/2 +A3.(T^2)/3 + A4.(T^3)/4 + A5.(T^4)/5 + A6/T)
%function for calulating entropy

function[S] = entropy(TMEDIUM,T,E,R)

%S = R(A1.ln(T) +A2.T + A3.T^2/2 + A4.T^3/3 + A5.T^4/4 + A7)

for i = 1:length(T)
  if T(i) <= TMEDIUM
    S = (E(8).*log(T) + E(9).*T + E(10).*(T.^2)./2 +E(11).*(T.^3)./3 + E(12).*(T.^4)./4 + E(14)).*R;           %lower temperature temperature
  else
    S = (E(1).*log(T) + E(2).*T + E(3).*(T.^2)./2 +E(4).*(T.^3)./3 + E(5).*(T.^4)./4 + E(7)).*R;               %upper temperature range
  endif
endfor
end
The procedure is same as the previous two codes, only exception being the new formula and the no. of coefficients.
S = R(A1.ln(T) + A2.T + A3.(T^2)/2 + A4.(T^3)/3 +A5.(T^4)/4 +A7)
8) Function for calculating the molar weight of the species:
%function for calulating molar weight

function[M] = molarw(species_name)

Elements = {'H','C','N','O','AR'};           %elements present in the data file
Atomic_wt = [1 12 14 16 40];                 %atomic weight of the corresponding elements

M = 0;                                       %setting the molar weight as zero
for i = 1:length(species_name)               %for loop to check the characters in the specie name string
  for j = 1:length(Elements)                 %for loop which considers the elements by sequence
    if strcmp(species_name(i),Elements(j))   %comparing element matrix with the name
      M = M + Atomic_wt(j);                  %adding the atomic weight of the element when previous stmt is true
      q = j;
    endif
    endfor
 k = str2num(species_name(i));               %converting the name(string) to number
 if k>1
   M = M + Atomic_wt(q)*(k-1);               %adding atomic weight of elements which are more than one
endif
endfor

disp(species_name)                           %display species name in command window
disp(M)                                      %display molar weight in command window

end
This function calculates the molar weight of the species. First, an array of strings called 'Elements' is created, which contains all the elements present within the file in string format. Another array of numbers called 'Atomic Weight' is also created, which contains the atomic weight of the elements present in the file. The values are entered corresponding to the atomic weight of the elements in the 'Elements' array. Then, a value (M) is set as zero. This value will give the atomic weight of the species after the entire code is run. Two for loops are executed. The first loop scans the name of the species extracted previously, which each loop considering one letter or number. Here, the loop can encounter either a number or letter.
Case 1: If the loop encounters a letter, the inner loop will be executed. The inner loop goes through each and every element of the 'Elements' array with every iteration. Next, the strcmp command is used to compare the letter within the species name with the element. If the condition becomes true, the value of M is changed by adding the corresponding atomic weight of the element in the Atomic Weight array to M.
Case 2: If the loop encounters a number, the inner loop's strcmp command will never become true. But the number of the inner loop iteration is stored in 'q'. Now, the program exits the inner loop. Here, the str2num command converts the character of the species name to number. If it is a letter, the command will give a false output and program goes for the next iteration. If it is a number, the output gives the value of the number within the species name. This number will always be a whole number greater than 1. So, an if condition greater than 1 is given.
Now, the value of 'q' stored in the previous loop comes into play, since it specifies the atomic weight to be chosen. When the inner loop encounters a number, it terminates immediately, without altering the value of 'q', i.e 'q' is the element which comes up in the iteration before the number.
The atomic weight 'M' is modified by adding the extra atomic weight of the multiple elements. 'k-1' has to be considered since the strcmp only adds the atomic weight of just one element. Hence the number following the element has to be subtracted by one.The outer loop terminates. Then the display command is used to display the name of the species and the molar weight calculated below it in the command window.
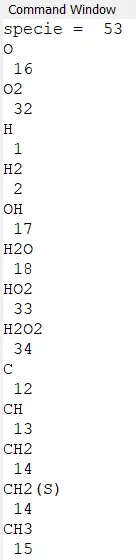
9) Function for plotting the graphs:
%function for plotting the graphs for the specie

function[P] = plots_nasa(T,H,S,CP,species_name,folder)

d = pwd;                                %specifying the drive for storing the folders
cd(folder);                             %changing directory to folder
Tdata = sprintf('%s',species_name);     %specifying the folder name for the plots
mkdir(Tdata);

%plotting Temperature vs Enthalpy
figure(1)
plot(T,H,'linewidth',3,'color','g')
title(species_name)
xlabel('Temperature')
ylabel('Enthalpy')

%plotting Temperature vs Entropy
figure(2)
plot(T,S,'linewidth',3,'color','b')
title(species_name)
xlabel('Temperature')
ylabel('Entropy')

%plotting Temperature vs Specific Heat
figure(3)
plot(T,CP,'linewidth',3,'color','r')
title(species_name)
xlabel('Temperature')
ylabel('Specific Heat')

%saving the plots as png files
cd(Tdata)
saveas(1,'Enthalpy.png')
saveas(2,'Entropy.png')
saveas(3,'Specific_heat.png')
cd(d)
end
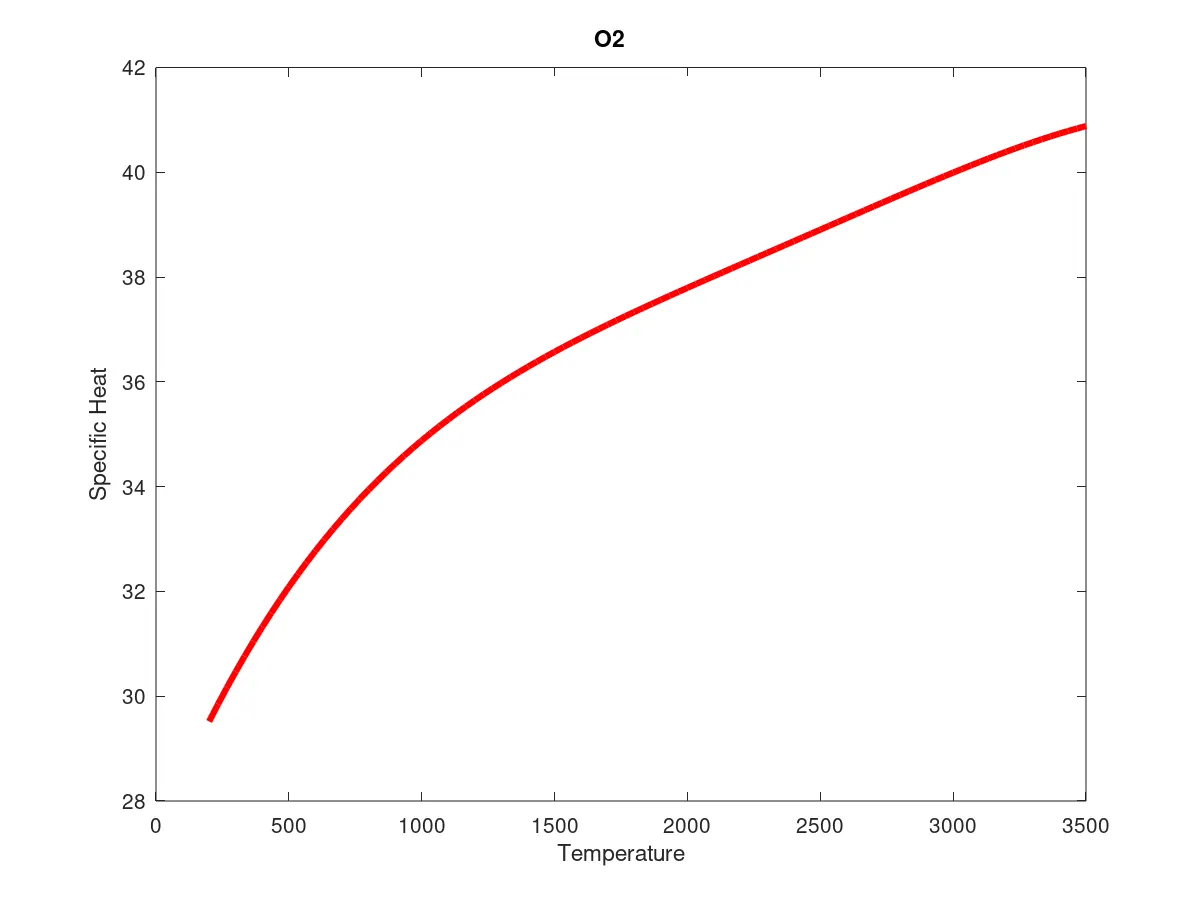
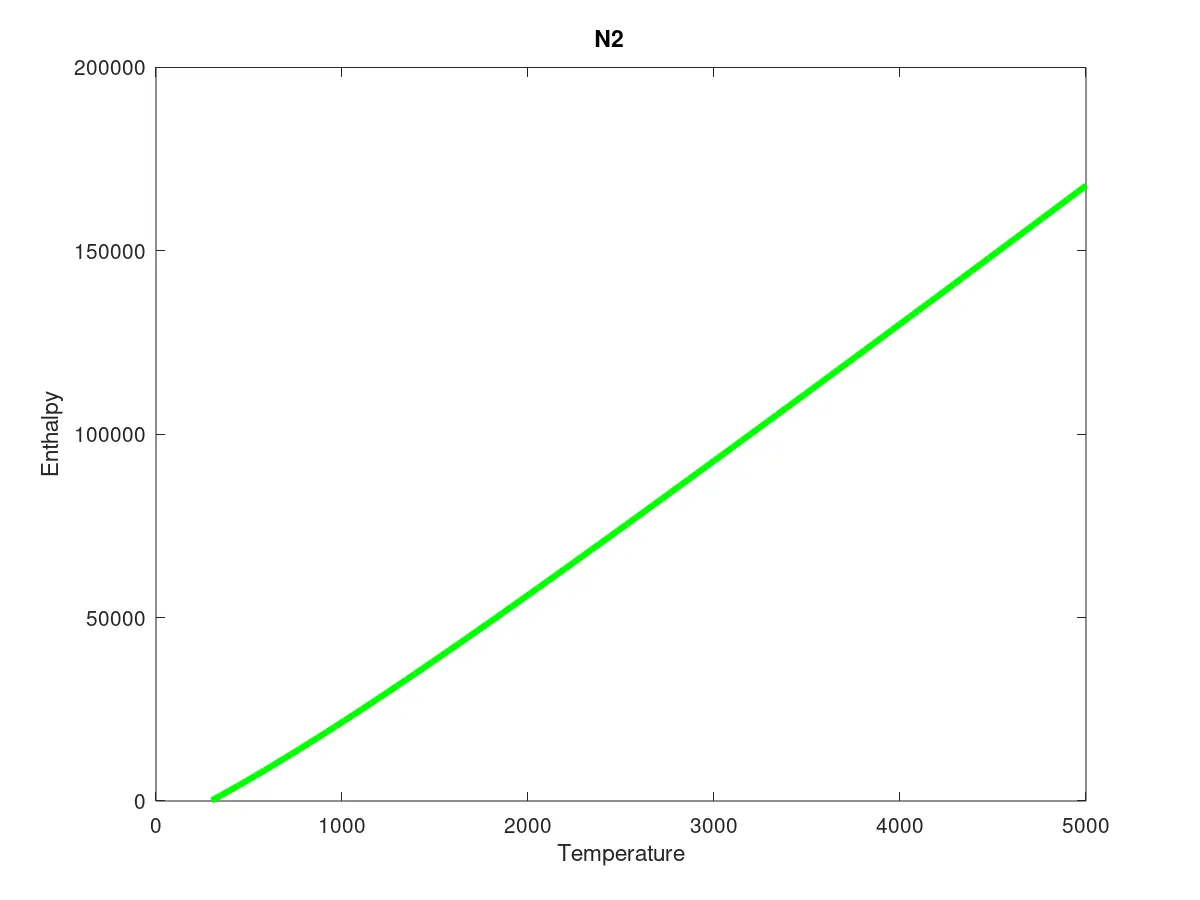
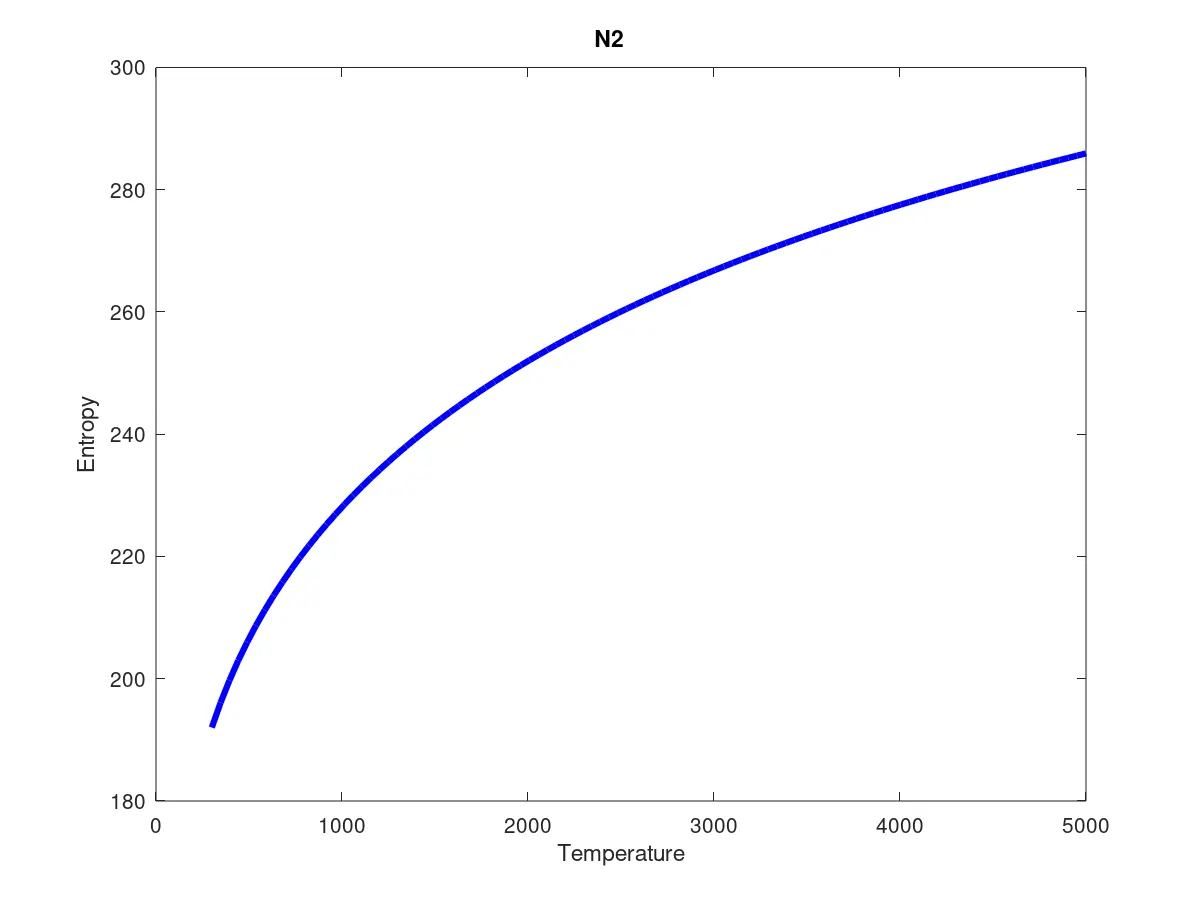
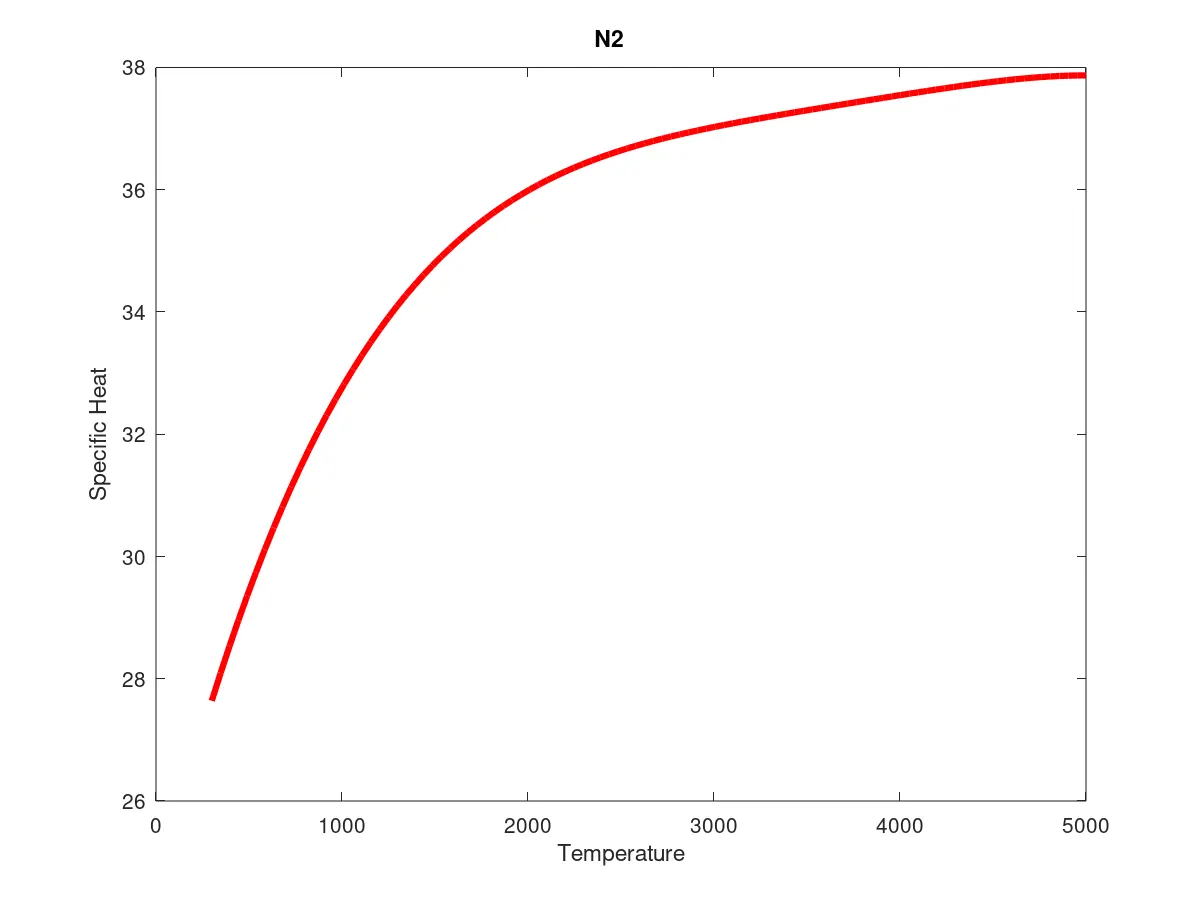
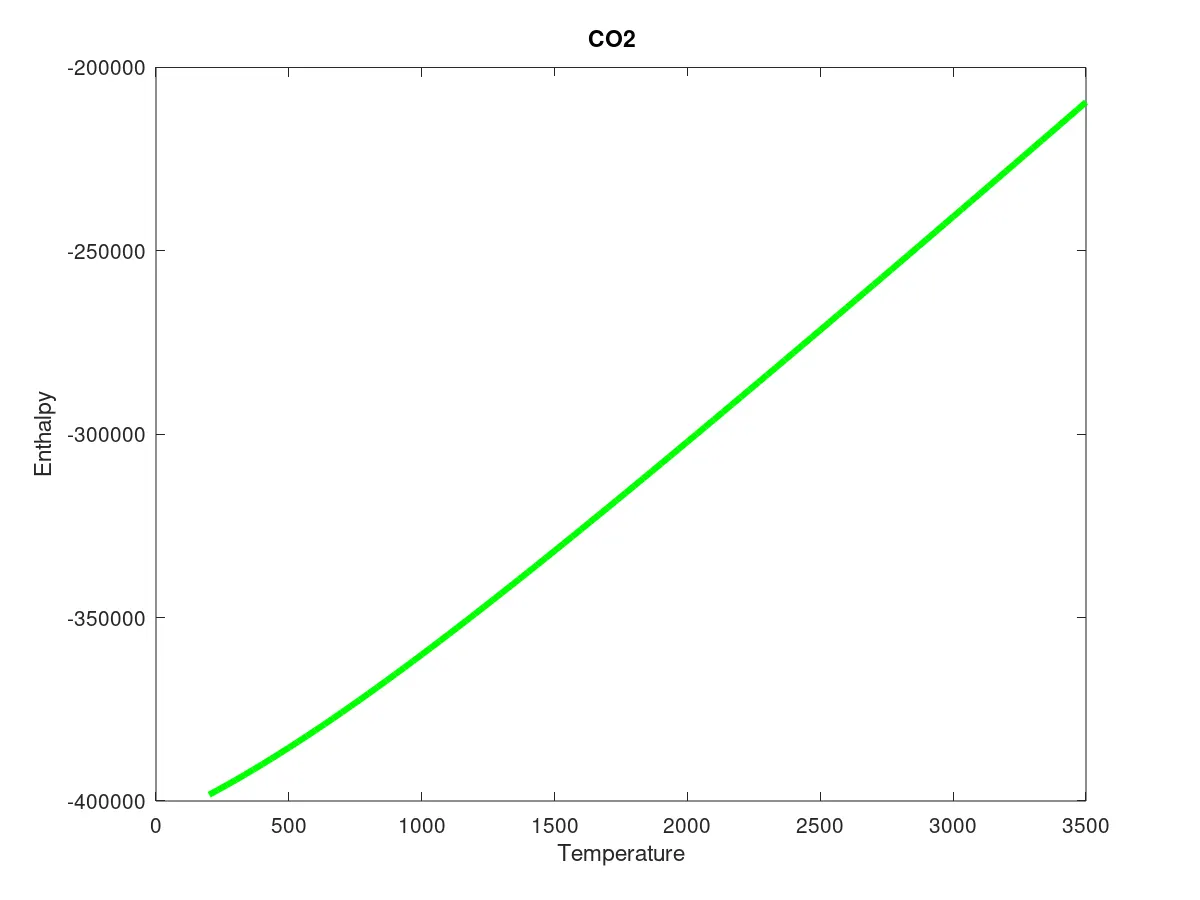
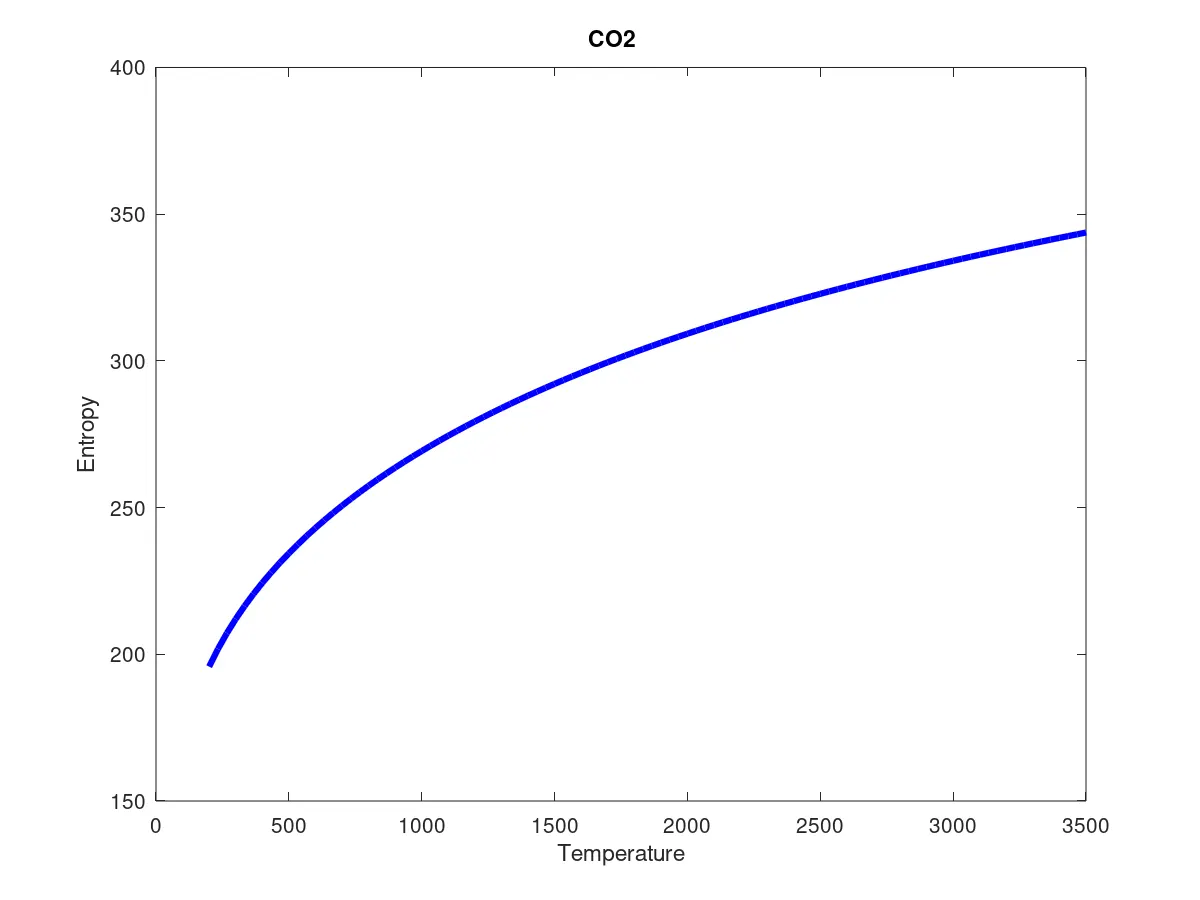
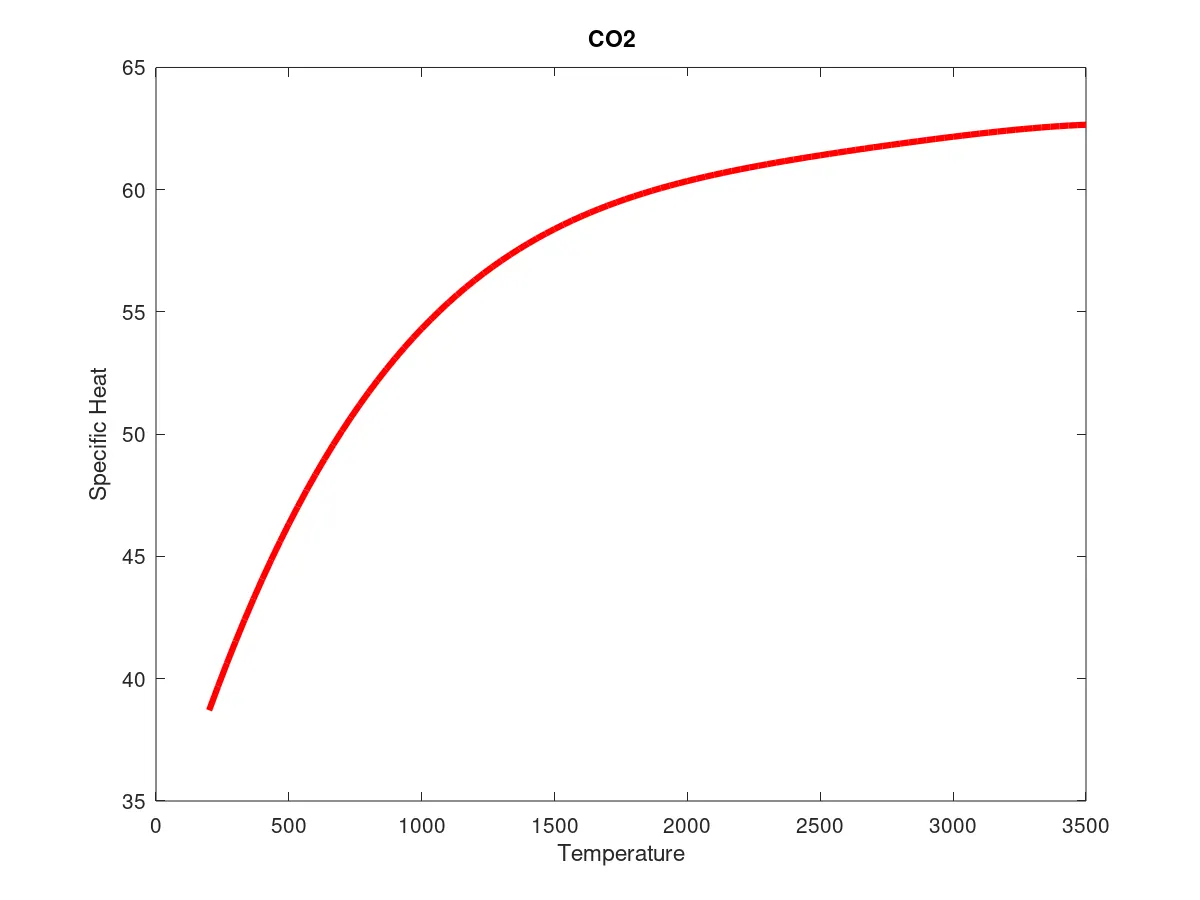
For plotting and storing the graphs, it is necessary to first specify the name and location where the plots will be stored. This is achieved by first identifying the current folder using 'pwd' . The 'folder' , which was created in the main program, is called by changing the directory using 'cd'(change directory). For each and every specie, a folder is created for storing the plots and the name of that folder is given using 'sprintf' . Then a new directory is created within the specie folder to specify the location for storing the plots. The 3 plots, namely Temperature vs Enthalpy, Entropy and Specific Heat are plotted and the required parameters for the plots are given. After the plots are created, the plots are converted to png files using 'saveas' . The directory is set to default and the function is terminated.
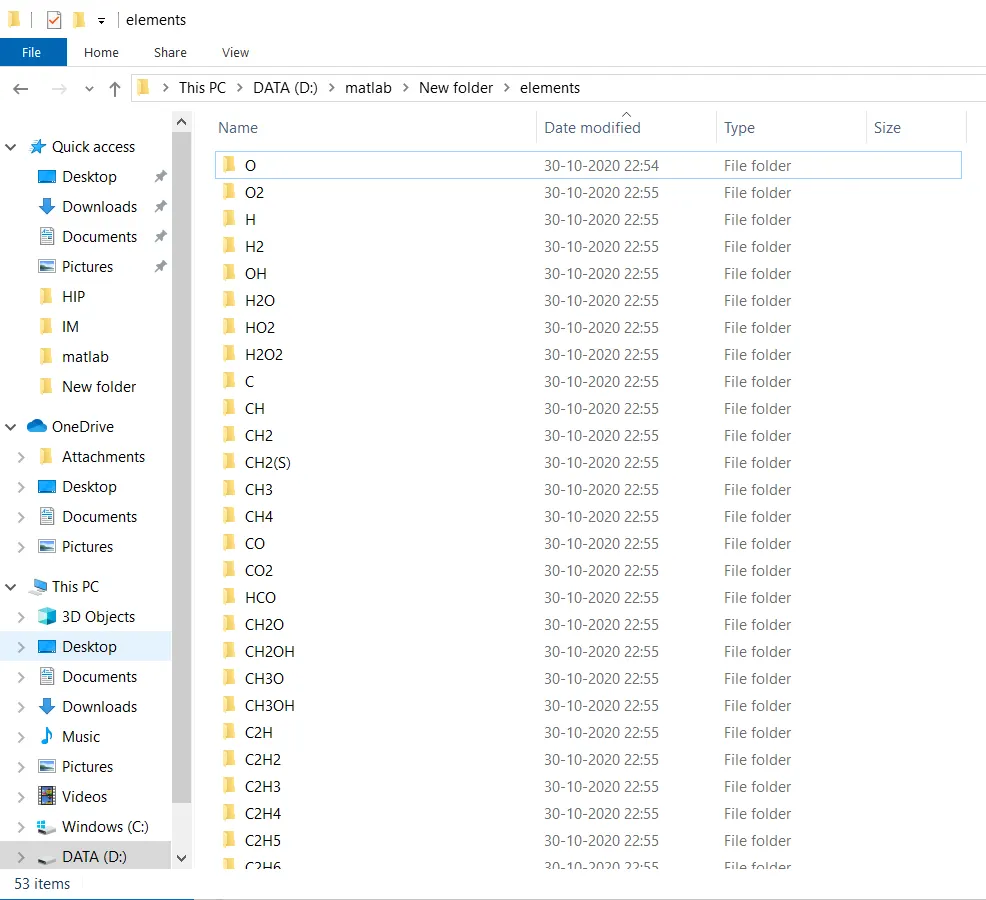
Screenshot showing the location of the folders
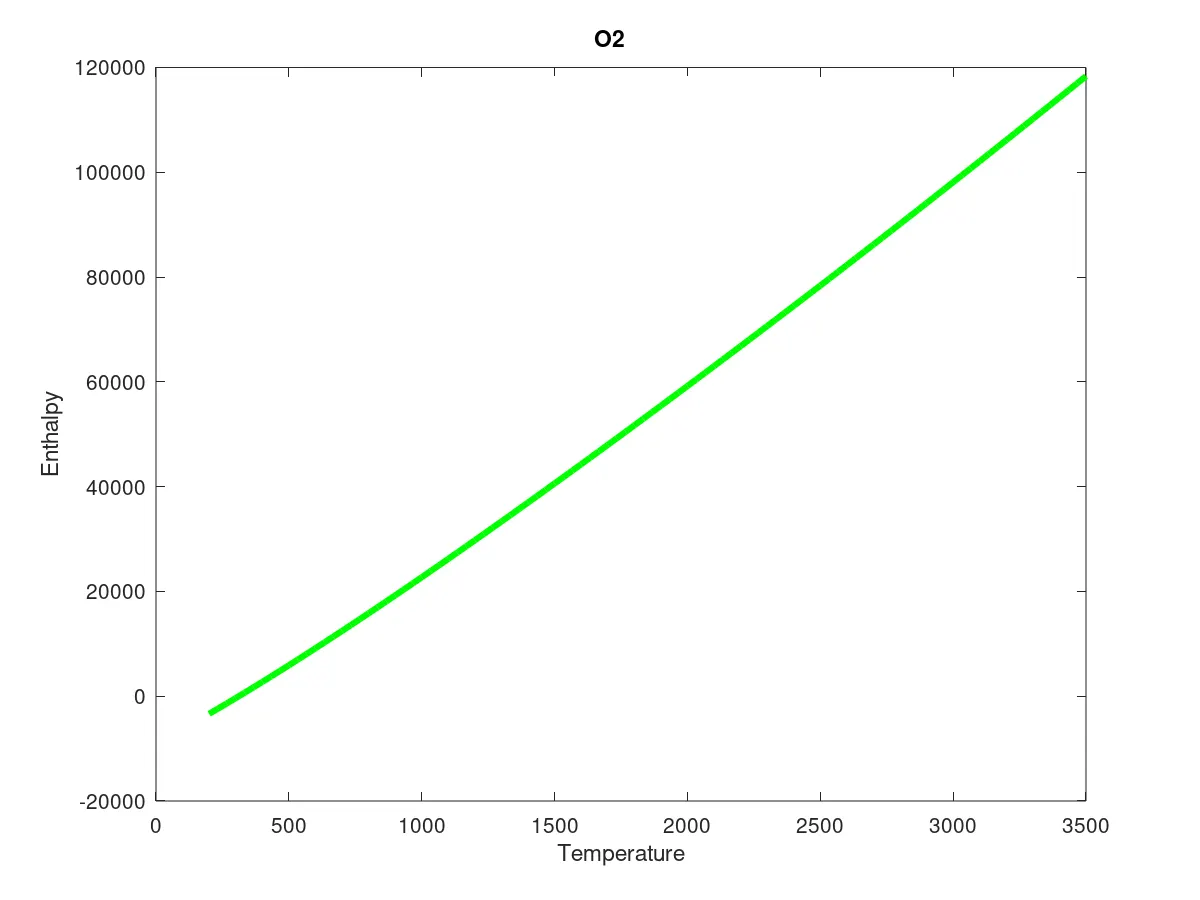
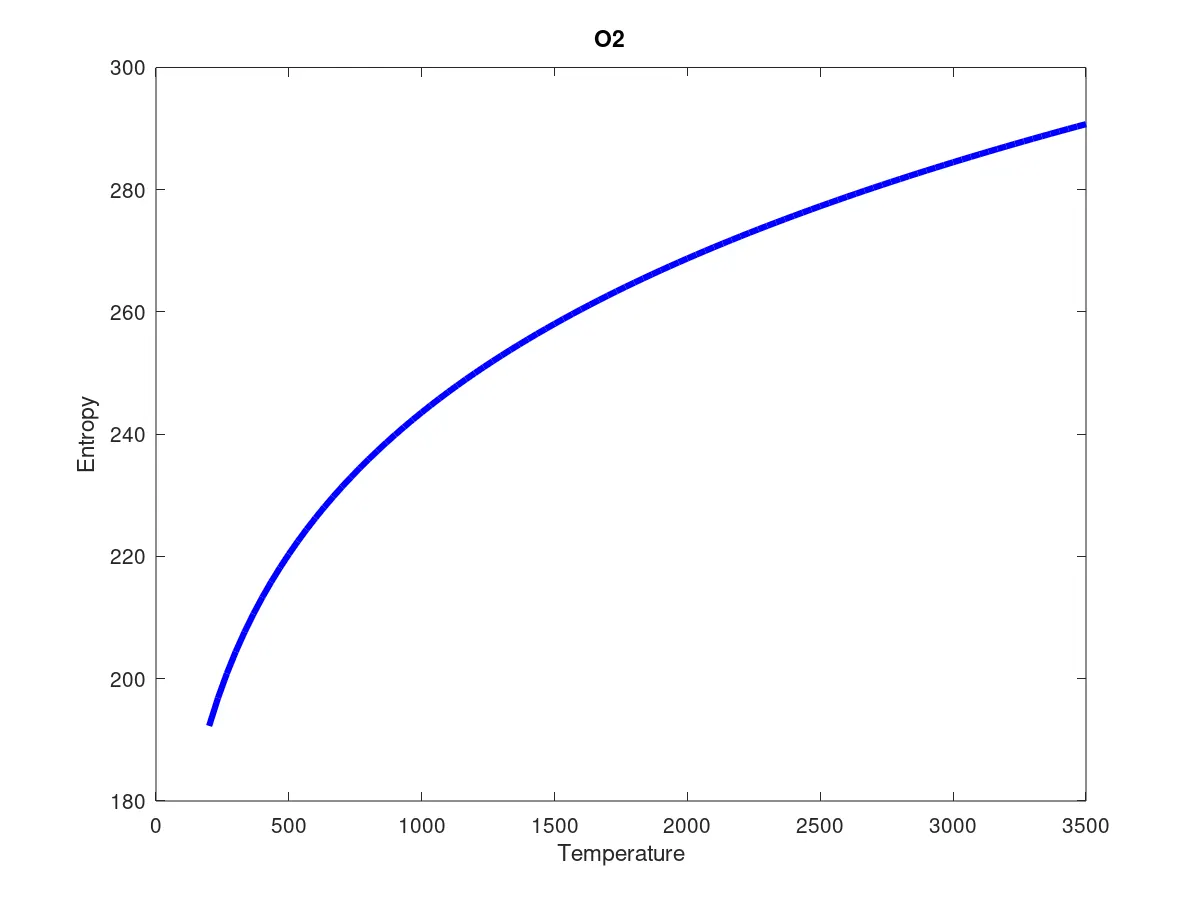
1) Plots for O2
i)Temperature vs Enthalpy
ii) Temperature vs Entropy
iii)Temperature vs Specific Heat
2) Plots for N2
i)Temperature vs Enthalpy
ii) Temperature vs Entropy
iii)Temperature vs Specific Heat
3)Plots for CO2
i)Temperature vs Enthalpy
ii) Temperature vs Entropy
iii)Temperature vs Specific Heat
Errors encountered:
The program threw an error within the main program:

The error was from the line (L1 == 'END'). The line is used in the if condition for encountering the END word at the bottom of the data file. This line only works for MATLAB and not OCTAVE. So for OCTAVE, the line is modified by introducing the string compare (strcmp) command, which compares L1 and 'END'.
Conclusion:
The NASA thermodynamic data file parsing project using MATLAB/OCTAVE is completed successfully, using string and file commands to read the files line by line, and extracting the required data from those lines. Data such as specie names, temperatures and coefficients are obtained, which are used to calculate properties such as specific heat, enthalpy, entropy and molar weight for all the species. The required plots are created and saved within the folders specified within the program.
References:
https://www.mathworks.com/help/matlab/ref/strcmp.html
https://techoverflow.net/2019/07/09/fixing-octave-string-compare/