Project 1 - Parsing NASA thermodynamic data
Aim
To parse NASA file eveluate thermodynamic properties and plot graphs
Objective
- To Calculate the molecular weight of each species
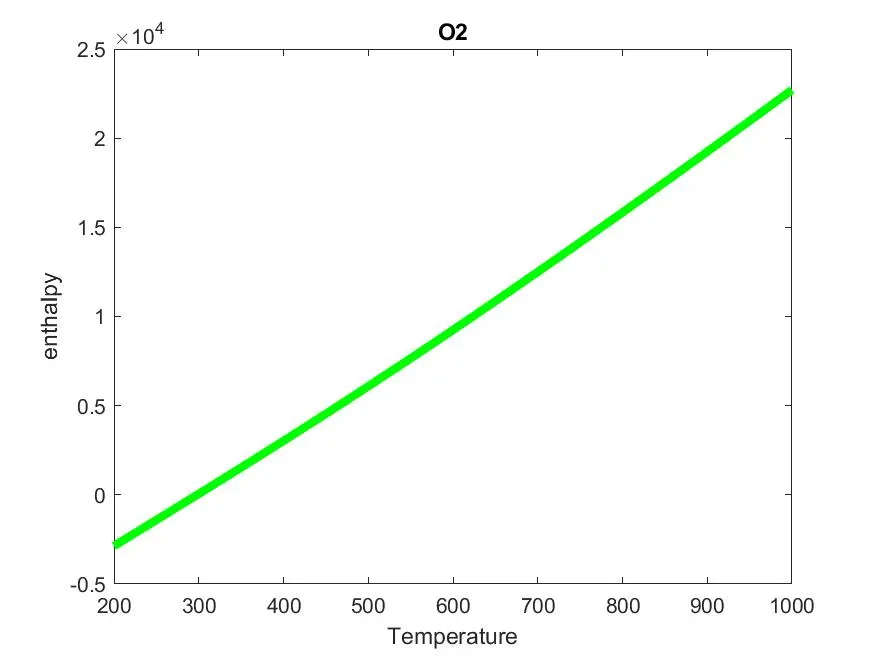
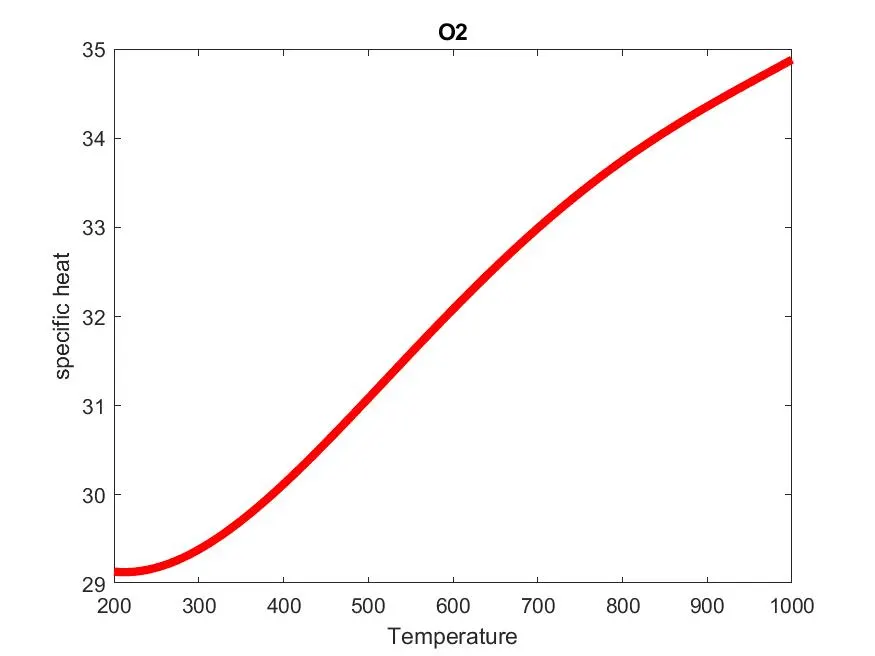
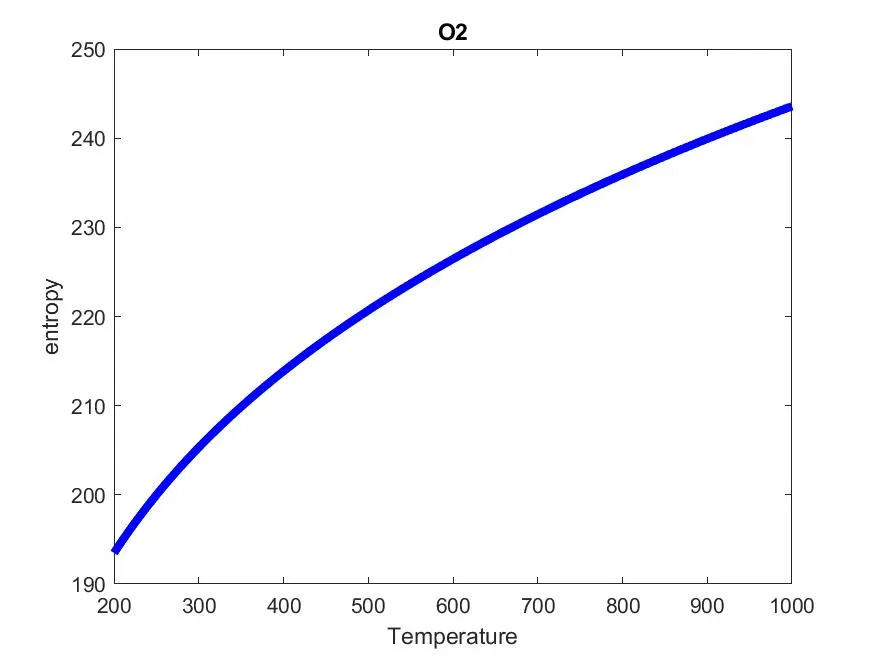
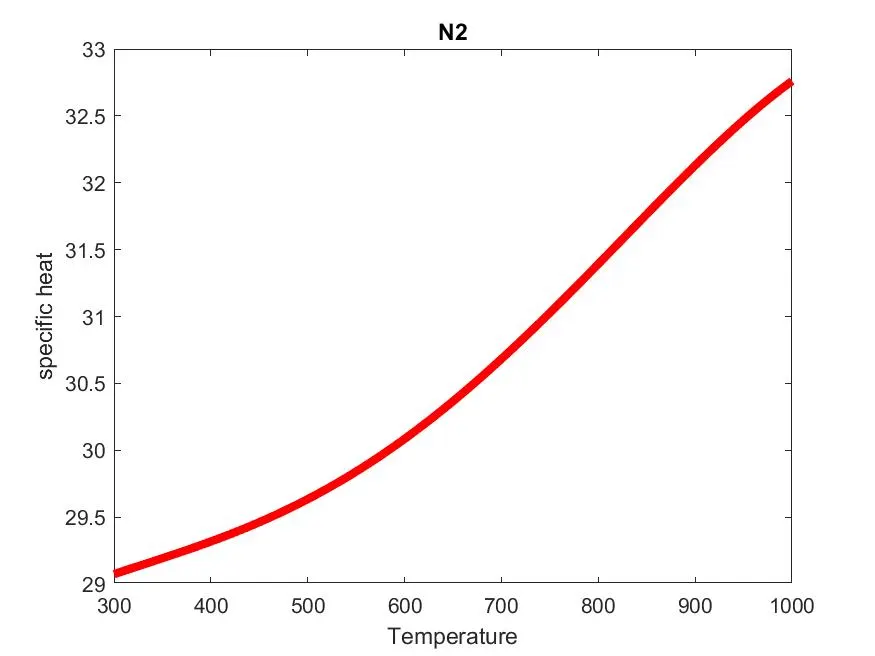
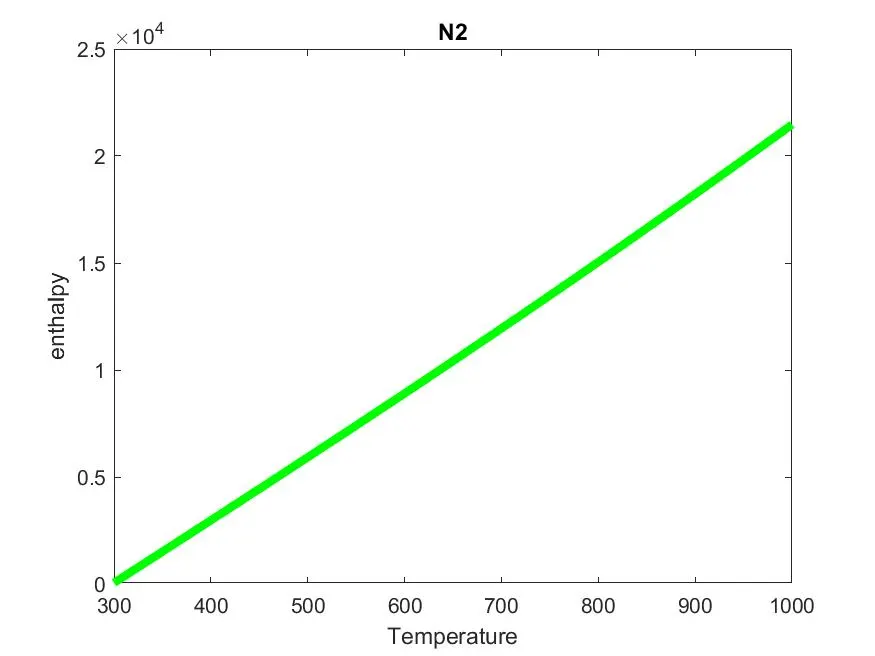
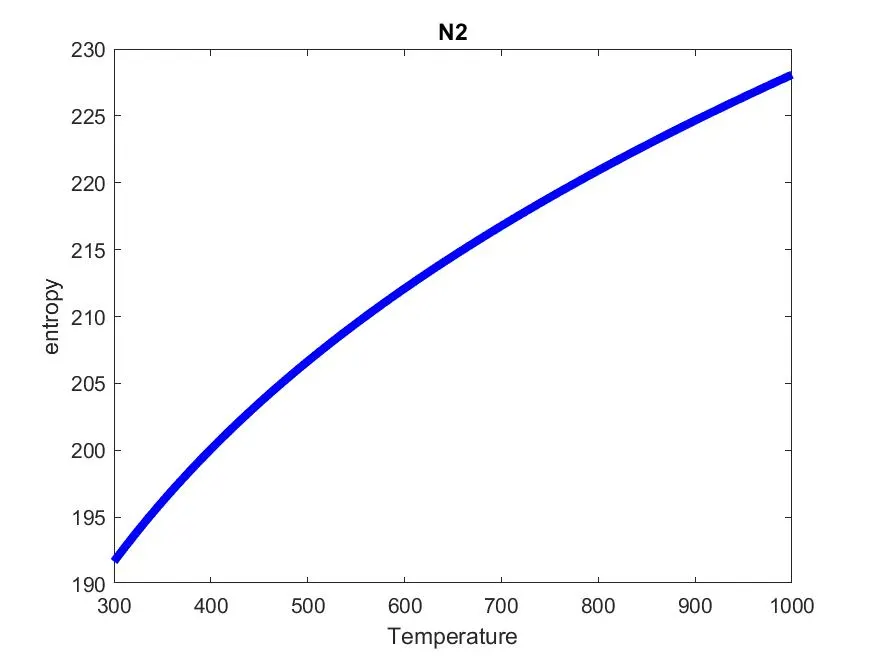
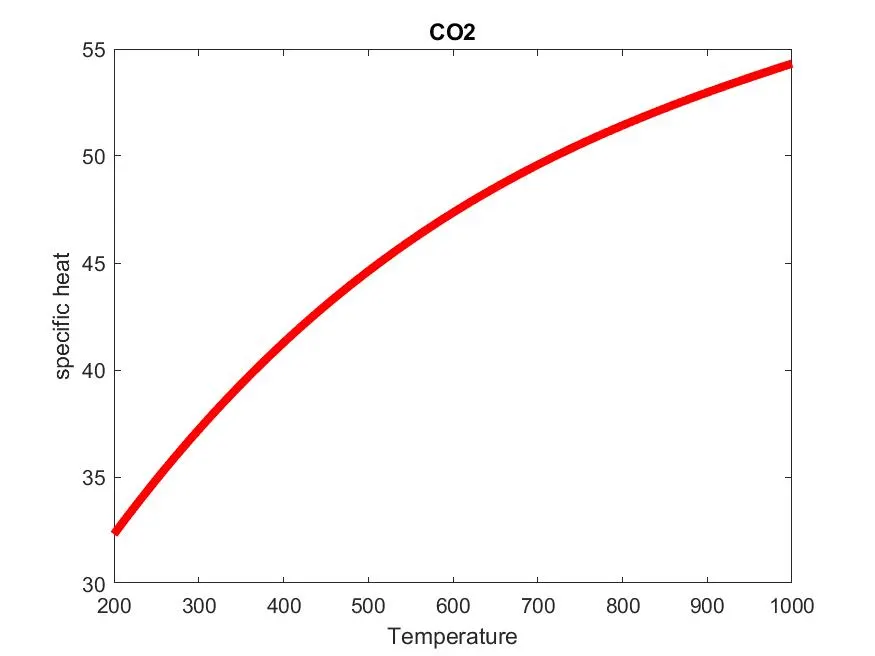
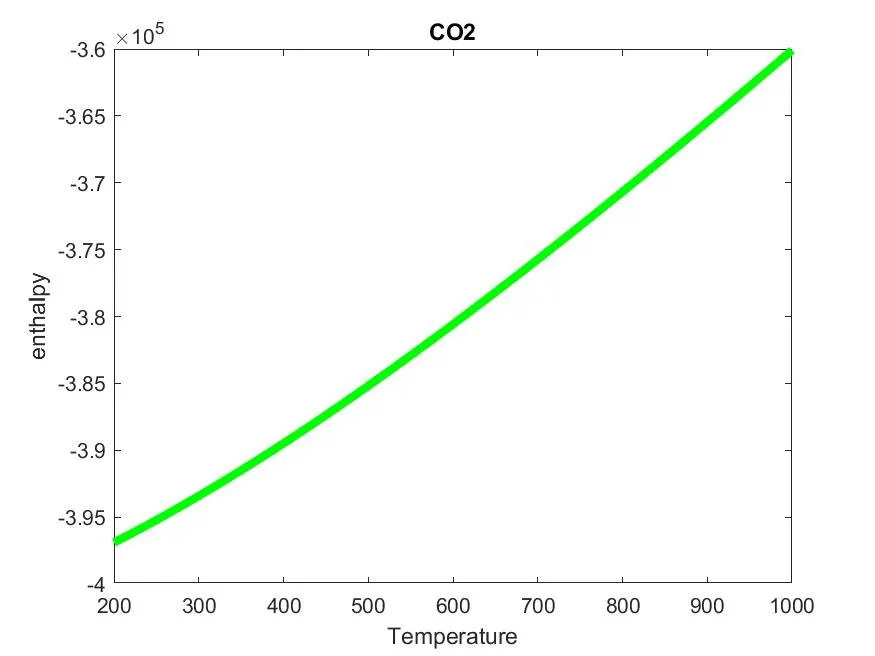
- To Plot the Cp, Enthalpy and Entropy for the local temperature range specific for each species.
- To Save the plots as images with appropriate names and dump them in separate folders for each species with suitable name. All these should be generated automatically
- To plot for o2, N2 and Co2 species.
Theory
File parsing
File parsing basically refers to how information can be read from a particular text file (or) any type of file, and how that information can be used in a computer program. If we known file parsing then we will be able to read data from "external files" or "external database" and we can include that data in our collection. when we talk about big data processing, usually there is an interface between the "program" and "large amount of data", either the data is stored in a file (or) it comes from a server. Here in this case, "File parsing" can be defined as the ability to read a file i.e, to take data from the file and the ability to store usefull information in it.
Thermodynamic data
Here, we take data provided by NASA, which includes study on elements for different thermodynamics of its behaviour on different thermal conditions and its corresponding thermodynamic data value for each elemants.
Molecular weight
Molecular weight is a measure of the sum of the atomic weight values of the atoms in a molecule. Molecular weight is used in chemistry to determine stoichiometry in chemical reactions and equations. Molecular weight is commonly abbreviated by M.W. or MW. Molecular weight is either unitless or expressed in terms of atomic mass units (amu)
Atomic Weight
The total weight of an atom is called the atomic weight. It is approximately equal to the number of protons and neutrons, with a little extra added by the electrons.
Enthalpy
Enthalpy is a thermodynamic quantity equivalent to the total heat content of a system. It is equal to the internal energy of the system plus the product of pressure and volume. Enthalpy is determined by this below equation:

where,
h = Enthalpy
R = Universal gas constant
T = Temperature
a = Co-efficients
Entropy
Entropy is a thermodynamic quantity representing the unavailability of a system's thermal energy for conversion into mechanical work, often interpreted as the degree of disorder or randomness in the system.Entropy is determined by this below equation:

where,
s = Entropy
R = Universal gas constant
T = Temperature
a = Co-efficients
Specific heat
The specific heat is the amount of heat per unit mass required to raise the temperature by one degree celsius. The relationship between heat and temperature change is usually expressed in the form shown below where `c_p`is the specific heat

where,
`c_p`= Specific heat
R = Universal gas constant
T = Temperature
a = Co-efficients
Universal Gas Constant
The gas constant is denoted by the symbol R. It is equivalent to the Boltzmann constant, but expressed in units of energy per temperature increment per mole, i.e.. the pressure-volume product rather than energy per temperature increment per particle.

Code Explanation
- Here in this program we use "fopen" to `open a particular datafile, in this program we are opening "THERMO.data", this is a file that consists of thermal datas of 53 elements.
- We use "t_line" as a pointer to point out, i.e... to specify a particular line inside the given datafile.
- We use "fgetl('variable')" to store a particular line into a cell.
- The first five line is stored in a cell called comments using fgetl().
- Here "strsplit" is used to split a whole string into seperate strings.
- Here "str2num" can be used to convert a particular string into an actual number, by using this we get only 5 digits of a number, we don't get the complete number by using this "str2num", i.e.... we don't get the accurate number.
- Instead of using "str2num" we use "str2double", by using this the string is converted into number and accuracy of the number increases i.e... we get full digit of a particlar number.
- Using "strfind" a decimal point is located in the line containing the local temperature values and these local temperature values are stored as numbers.
- Using the "str¦nd" command 'E' is located in the lines containing the temperature co-efficients and local temperature values are stored as a number in a for loop in a single array called "coeffs".
- So by using these above mentioned commands and the procedure in which these commands are used in the above main program we get plots of each species and molecular weight for each species is calculated inside the for loop, and these plots are saved in a folder containing the name of these species.
- The "coeffs" array is replaced in each loop by the co-efficients of each species.
Main Code
clear all
close all
clc
% open file for reading
f1=fopen('THERMO.dat','r');
% reading header information
line_1=fgetl(f1);
%reading global temperature
line_2=fgetl(f1);
A=strsplit(line_2,' ')
global_low_temp=str2double(A{2})
global_mid_temp=str2double(A{3})
global_high_temp=str2double(A{4})
%To avoid the next 3 lines
for i=1:3
Aviod=fgetl(f1);
end
for j=1:53
line_3=fgetl(f1)
x=strsplit(line_3,'G ')
x1=x{1}
x2=strsplit(x1,' ')
species_name=x2{1}
y=x{2}
y1=strsplit(y,' ')
%for line3 local temperatures
local_low_temp=str2double(y1{2});
local_mid_temp=str2double(y1{3});
local_high_temp=str2double(y1{4});
%for line_4
line_4=fgetl(f1);
a=findstr(line_4,'E');
c1=str2double(line_4(1:a(1)+3));
c2=str2double(line_4(a(1)+4:a(2)+3));
c3=str2double(line_4(a(2)+4:a(3)+3));
c4=str2double(line_4(a(3)+4:a(4)+3));
c5=str2double(line_4(a(4)+4:a(5)+3));
%for line_5
line_5=fgetl(f1);
b=findstr(line_5,'E');
c6=str2double(line_5(1:b(1)+3));
c7=str2double(line_5(b(1)+4:b(2)+3));
c8=str2double(line_5(b(2)+4:b(3)+3));
c9=str2double(line_5(b(3)+4:b(4)+3));
c10=str2double(line_5(b(4)+4:b(5)+3));
%for line6
line_6=fgetl(f1)
c=findstr(line_6,'E');
c11=str2double(line_6(1:c(1)+3));
c12=str2double(line_6(c(1)+4:c(2)+3));
c13=str2double(line_6(c(2)+4:c(3)+3));
c14=str2double(line_6(c(3)+4:c(4)+3));
R=8.314
T=linspace(local_low_temp,local_high_temp,100);
[cp,h,s]=cp_h_s(c1,c2,c3,c4,c5,c6,c7,c8,c9,c10,c11,c12,c13,c14,T,R,local_mid_temp);
mkdir(species_name)
% ploting_graphs Temperature vs entropy
figure(1);
plot(T,s,'linewidth',4,'color','b');
title( species_name);
xlabel('Temperature');
ylabel('entropy');%plotinggraphs Temperature vs enthalpy
figure(2);
plot(T,h,'linewidth',4,'color','g');
title( species_name);
xlabel('Temperature');
ylabel('enthalpy');
%ploting_graphs Temperature vs specific heat
figure(3);
plot(T,cp,'linewidth',4,'color','r');
title( species_name);
xlabel('Temperature');
ylabel('specific heat');
cd(species_name)
%saving the plots
saveas(figure(1),'T vs s.jpg');
saveas(figure(2),'T vs h.jpg');
saveas(figure(3),'T vs cp.jpg');
cd('..')
MM = molecular_mas(species_name);
k=sprintf('%s MM = %f',species_name,MM);
disp(k)
end
fclose(f1)
Sub Program 1
%Function to find Specific heat, Enthalpy, Entropy
function [cp,h,s]=cp_h_s(c1,c2,c3,c4,c5,c6,c7,c8,c9,c10,c11,c12,c13,c14,T,R,local_mid_temp)
if(T>local_mid_temp)
cp=(c1+c2.*T+c3.*T.^2+c4.*T.^3+c5.*T.^4)*R;
h=(c1+c2.*T/2+c3.*T.^2/3+c4.*T.^3/4+c5*T.^4/5+c6./T)*R.*T;
s=(c1*log(T)+c2*T+c3*T.^2/2+c4*T.^3/3+c5*T.^4/4+c7)*R;
else
cp=(c8+c9*T+c10*T.^2+c11*T.^3+c12*T.^4)*R;
h=(c8+c9*T/2+c10*T.^2/3+c11*T.^3/4+c12*T.^4/5+c13./T)*R.*T;
s=(c8*log(T)+c9*T+c10*T.^2/2+c11*T.^3/3+c12*T.^4/4+c14)*R;
end
Sub Program 2
%Function to find Molecular Mass
function MM = molecular_mas(species_name)
species = upper(species_name);
elements=['H','C','N','O','A'];
Atomic_weight =[1.00794 12.0107 14.0067 15.9994 39.948];
MM=0;
for i=1:length(species)
for j=1:length(elements)
if strcmp(species(i),elements(j))
MM=MM+Atomic_weight(j);
u=j;
end
end
n=str2num(species(i));
if n>1
MM=MM+Atomic_weight(u)*(n-1);
end
end
end
Results
File Parsing of NASA Thermodynamic data was done successfully.

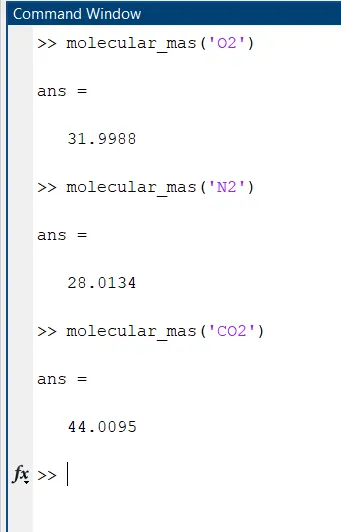
Molecular Weight Outputs
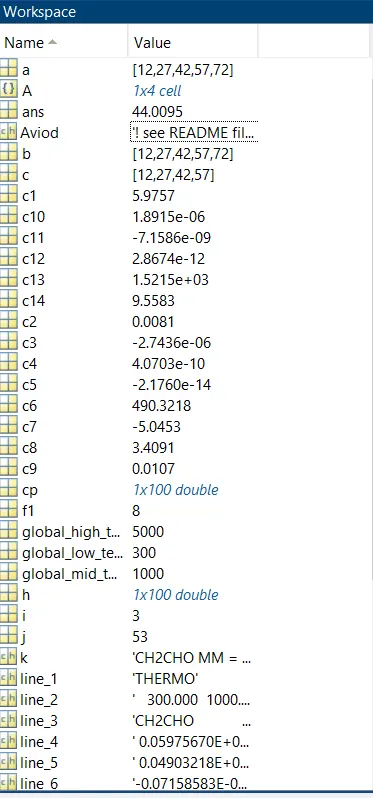
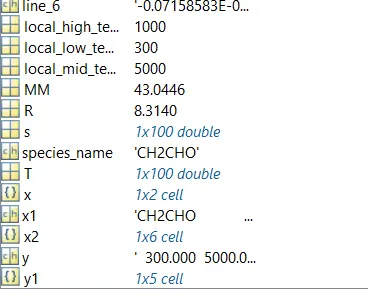
Workspace Outputs
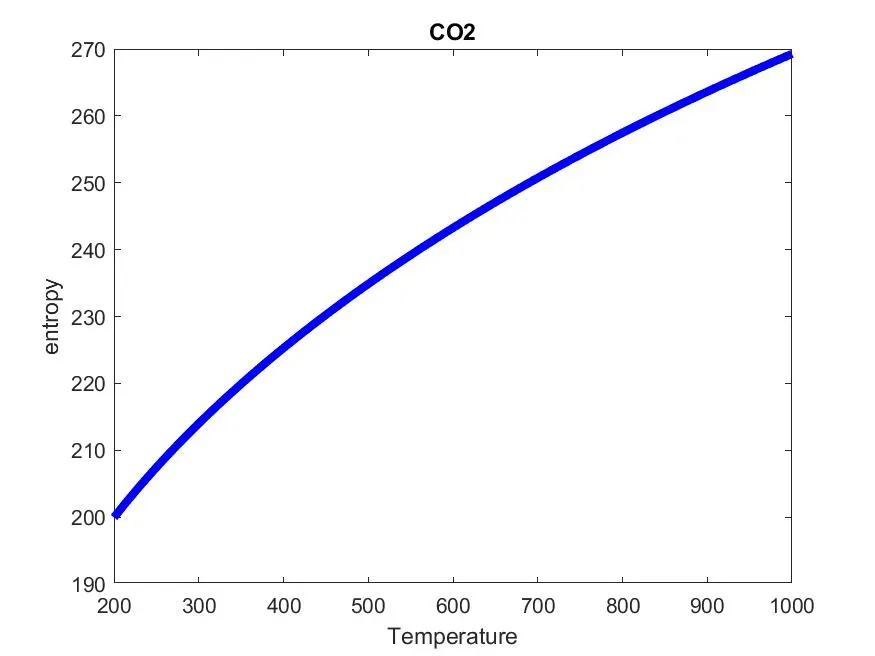
Plots for o2, N2 and Co2 species