Project 1 - Parsing NASA thermodynamic data
Objective: To parse the thermodynamic data and obtain useful information about the species
Theory: The dataset consists of species name and a set of 14 co-efficients. These co-efficients, a1 to a14, are used to calculate Enthalpy, Entropy and Specific heat of the species at any given temperature in the given range.
We will be writing a MATLAB code that will extract the species data from the file and use it to plot the values of Enthalpy, Entropy and Specific heat over the temperature range.
Code:
clear all
close all
clc

a=fopen('THERMO.txt', 'r'); %Opening the dataset file

%for loop to bring the line position to the first species, which is the 6th
%line
for i=1:6
b=fgetl(a);

ind_low = 4+findstr(b, 'G');   %the location of the first digit of all temperature ranges
ind_high = 13+findstr(b, 'G'); %is same for all species, hence we can use
ind_mid = 23+findstr(b, 'G');  %the first species to calculate the locations

end

%for loop to run the code for all the species
for j=1:inf  %The loop end is inf incase we do not know the number of species in the dataset

    if j>1             %We need to move the line down only in case of the 2nd species onwards, since for
        b=fgetl(a);    %first species we are already at required line due to previous for loop
    end

    if b(1:3) == 'END'; %End condition for the for loop.
        break
    end

    str = split(b); %Splitting the line into strings
    species_name = str{1}; %saving first eleemnt of the string into the variable species_name

%Extracting the temperature limits from the data
t1 = str2num(b(ind_low:ind_low+6));
t3 = str2num(b(ind_high:ind_high+7));
t2 = str2num(b(ind_mid:ind_mid+7));

b = fgetl(a);
%Extracting the co-efficients
ind = findstr(b,'E');
c(1) = str2num(b(1:ind(1)+3));
c(2) = str2num(b(16:ind(2)+3));
c(3) = str2num(b(31:ind(3)+3));
c(4) = str2num(b(46:ind(4)+3));
c(5) = str2num(b(61:ind(5)+3));

b = fgetl(a);
ind = findstr(b,'E');

c(6) = str2num(b(1:ind(1)+3));
c(7) = str2num(b(16:ind(2)+3));
c(8) = str2num(b(31:ind(3)+3));
c(9) = str2num(b(46:ind(4)+3));
c(10) = str2num(b(61:ind(5)+3));

b = fgetl(a);
ind=findstr(b,'E');
c(11) = str2num(b(1:ind(1)+3));
c(12) = str2num(b(16:ind(2)+3));
c(13) = str2num(b(31:ind(3)+3));
c(14) = str2num(b(46:ind(4)+3));

T1 = linspace(t1, t2, 100); %Low to medium temerature range
T2 = linspace(t2, t3, 100); %Medium to High temperature range

%Calculating the high and low values for both the temperature ranges
for k=1:100

Cp_high = 8.314*(c(1) + c(2).*T2 + c(3).*T2.^2 +c(4).*T2.^3 +c(5).*T2.^4);
H_high = 8.314.*T2.*(c(1) + c(2).*T2./2 + c(3).*(T2.^2)./3 +c(4).*(T2.^3)./4 +c(5).*(T2.^4)./5 +c(6)./T2);
S_high = 8.314*(c(1).*log(T2) + c(2).*T2 + c(3).*(T2.^2)./2 +c(4).*(T2.^3)./3 +c(5).*(T2.^4)./4 +c(7));

Cp_low = 8.314*(c(8) + c(9).*T1 + c(10).*T1.^2 +c(11).*T1.^3 +c(12).*T1.^4);
H_low = 8.314.*T1.*(c(8) + c(9).*T1./2 + c(10).*(T1.^2)./3 +c(11).*(T1.^3)./4 +c(12).*(T1.^4)./5 +c(13)./T1);
S_low = 8.314*(c(8).*log(T1) + c(9).*T1 + c(10).*(T1.^2)./2 +c(11).*(T1.^3)./3 +c(12).*(T1.^4)./4 +c(14));

end

f1 = figure;
f2 = figure;
f3 = figure;

%Creating variables that will be used for naming the plots according to the
%species name
spht = strcat(species_name,' Specific Heat');
enth = strcat(species_name, ' Enthalpy');
ent = strcat(species_name, ' Entropy');

%Plotting and saving the graphs
mkdir(species_name); %creating a directory with the species name
cd(species_name); %making the directory current
figure(f1); %making f1 the current figure
plot(T2, Cp_high, 'color', 'r'); hold on;
plot(T1, Cp_low, 'color', 'r');
xlabel('Temperature, K');
ylabel('Specific Heat, KJ/KG.K');
saveas(gcf, spht);

figure(f2);
plot(T2, H_high, 'color', 'g'); hold on;
plot(T1, H_low, 'color', 'g');
xlabel('Temperature, K');
ylabel('Enthalpy, KJ/KG');
saveas(gcf, enth);

figure(f3);
plot(T2, S_high, 'color', 'b'); hold on;
plot(T1, S_low, 'color', 'b');
xlabel('Temperature, K');
ylabel('Entropy, KJ/K');
saveas(gcf, ent);
cd ..;

%Calculating the molecular weight of the species
elements = ['C', 'H', 'O', 'N', 'Ar'];
wt = [12 1 16 14 40];
mw=0; %initialising the molecular weight

for l = 1:length(species_name)
    x=str2num(species_name(l)); %converting the ith instance of the character into a number
    if x>1
        mw = mw+(x-1).*wt(M); %If the number is greater than 1, it means multiple elements.
    end						  %It then used the weight at the Mth position to calculate mass
							  %the value of M is taken from the previous iteration of the m loop below
    for m = 1:length(elements)
        if strcmp(elements(m),species_name(l)) == 1; %Comparing the lth letter in the species name to the mth letter in the elements
            mw = mw + wt(m);
            M=m; %Storing the location of m in M. If the next letter in the l loop is a number this M will be used to calculate mass
            break; %If there is a match, the break command will be used to go to the next i loop and check if the next letter is a number
        end
    end

end
fprintf("The molecular weight of %s is %d \n", species_name, mw); %Printing the molecular weight
end
Explanation:
1.
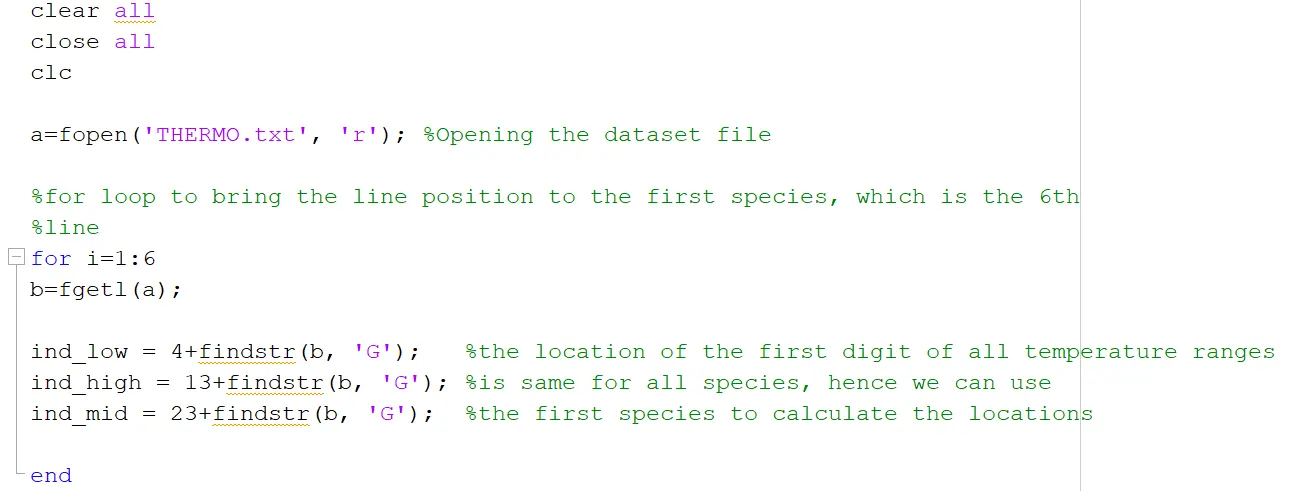
First we open the given dataset file and run a for loop to get the 6th line, which is the first species name line. This line also contains the low, mid and high temperature limits.
Since the location of these termperature values are the same for all species in all lines, we will use the first species to store this location as ind_low, ind_med and ind_high.
We use findstr command to find the value of 'G' in the line string 'b' and use it to find the index of the temperature limits.
2. Next we run a for loop to extract the data and plot the graphs for all the species
We run it to infinity in case we do not know the total number of species in the dataset. We use an end condition for the loop, which is the string 'END'
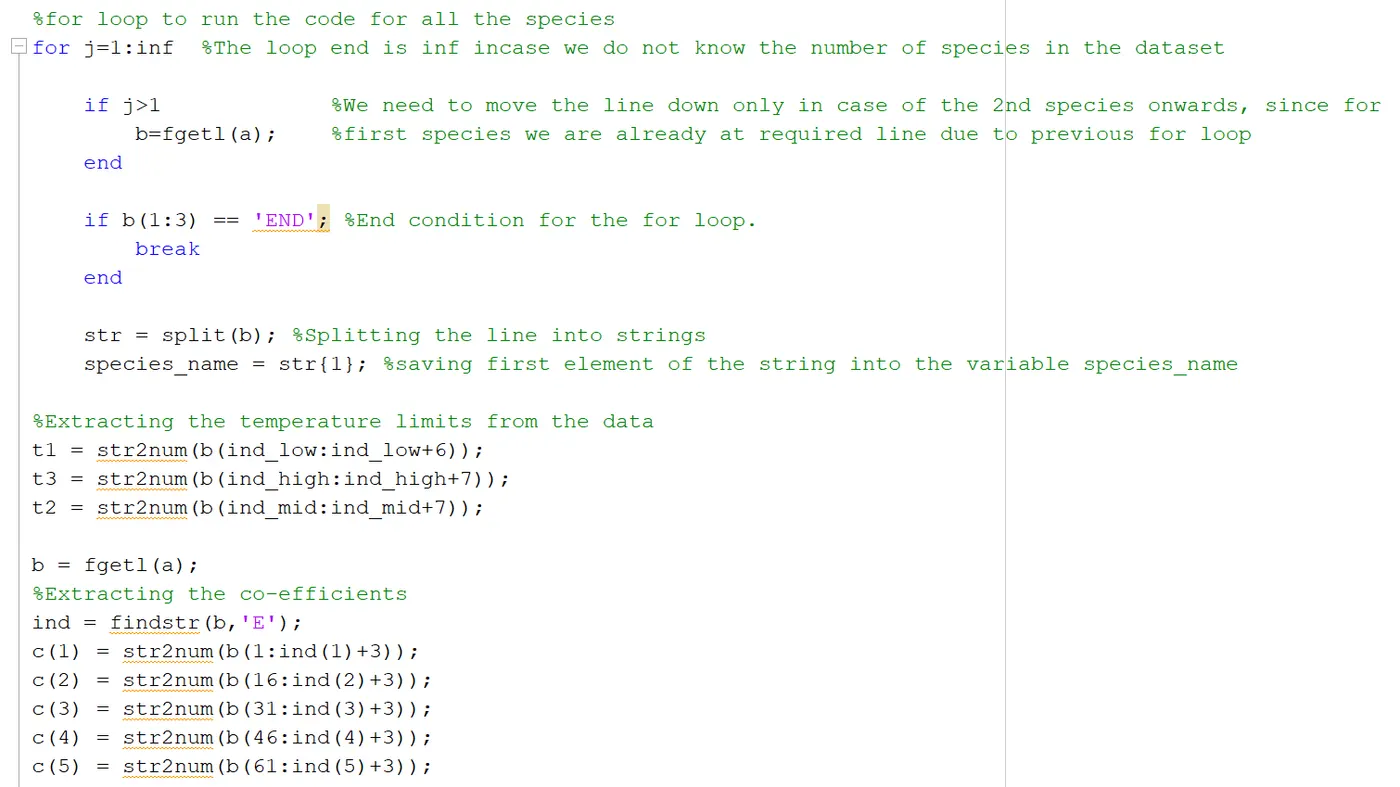
We extract the species name and save it. Then we extract the first 5 co-efficients, and similarly the rest of the co-efficients.
We save them in an array "c"
3. Next we will use the co-efficients to calculate the values of enthalpy, entropy and specific heat
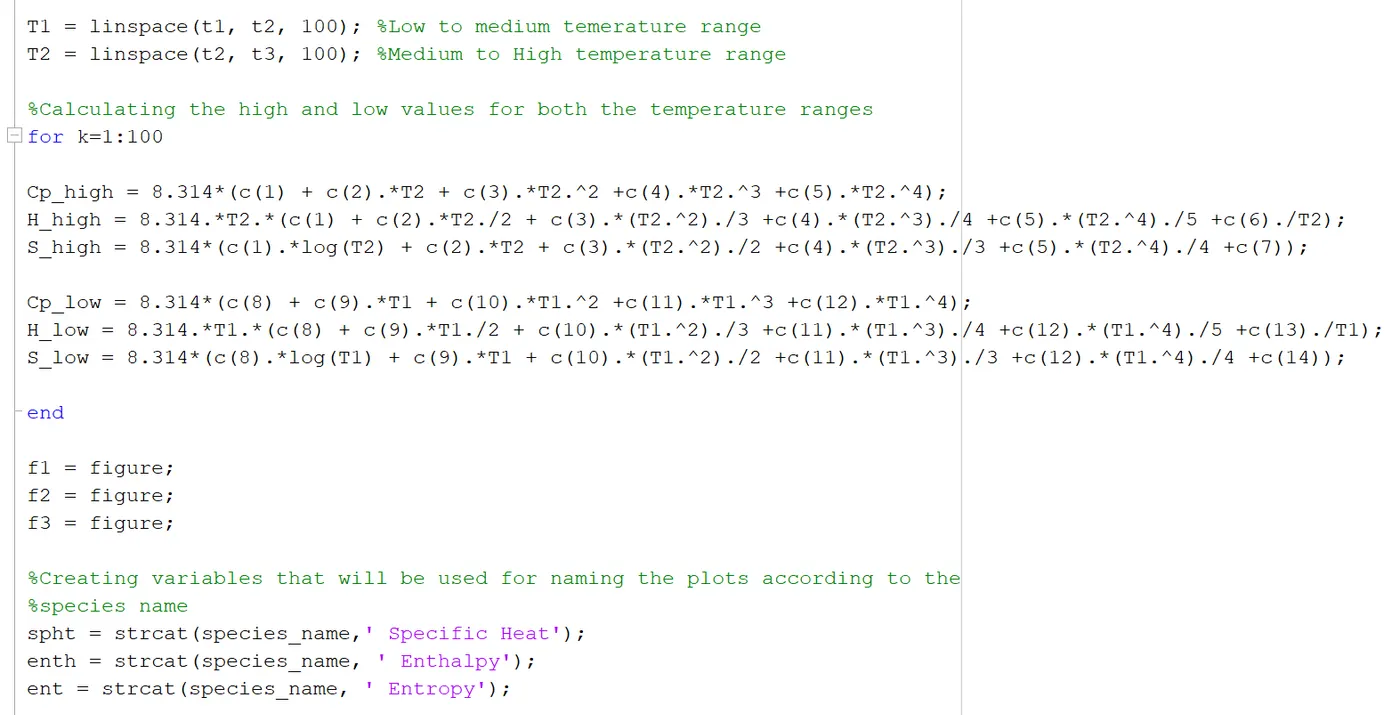
First we create the temperature ranges from low to mid and from mid to high.
Then we run a for loop to calculate the Cp, H and S values for both the low and high ranges.
Then we define 3 figure variables which we will use for making current figures and saving them.
Then we create three variables which we will use for naming the saved plots.
4. We plot the values calculated above against the time arrays and save the results as a png file
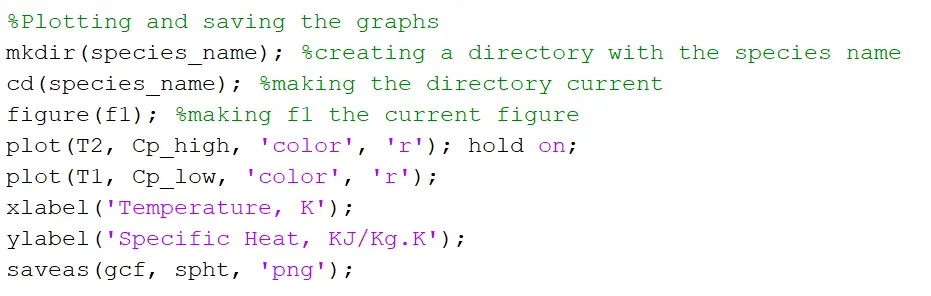
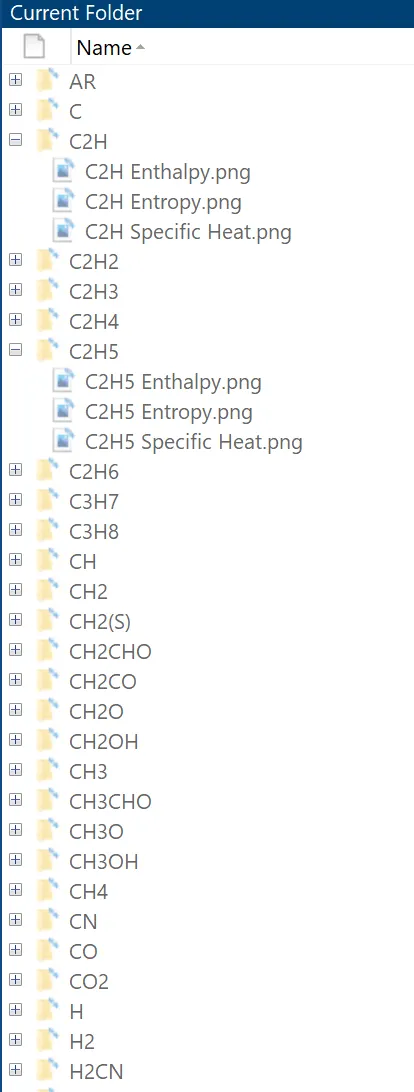
We use mkdir command to make a directory of the species name in the current directory and then set it as the current directory using the cd command
The plots are saved in this folder using the saveas command.
Similary we plot and save the Enthalpy and Entropy values.
5. To calculate the molecular weight of the species, we will create an array which contains the individual elements, and a second array which contains their corresponding atomic weights.
Then we will compare the characters in the species with the element array and return the matching weights.
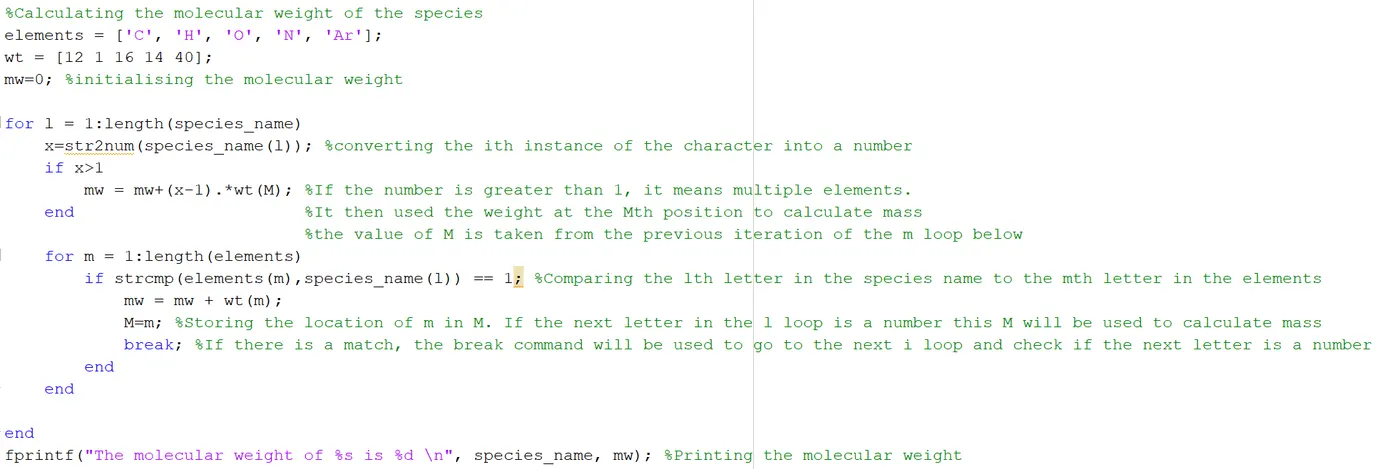
We first check if the instantaneous character in the species name is a number. It will never be the case in the first iteration, but in the later ones, if it is, then we calculate the molecular weight according to the index of match in the previous for loop. We save that index as M, as shown in the above image.
We have used a nested for loop to compare the species name and the elements.
If there is a match in the second for loop, the loop is terminated with the break statement and the first loop is executed where the first few lines will check if the current character is a number and accordingly calculate molecular weight.
Then we use fprintf command to print out the molecular weight of the element.
Output:
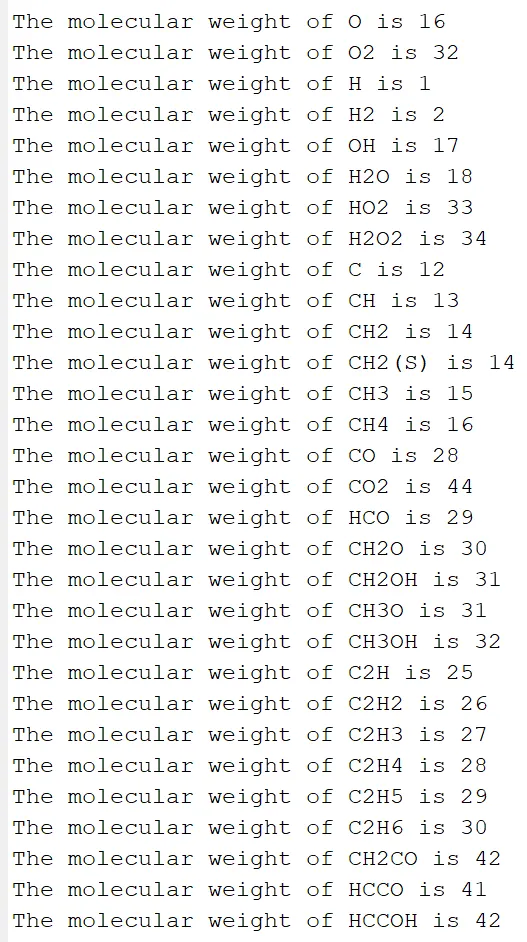
Molecular weights:
Screenshot of the folders:
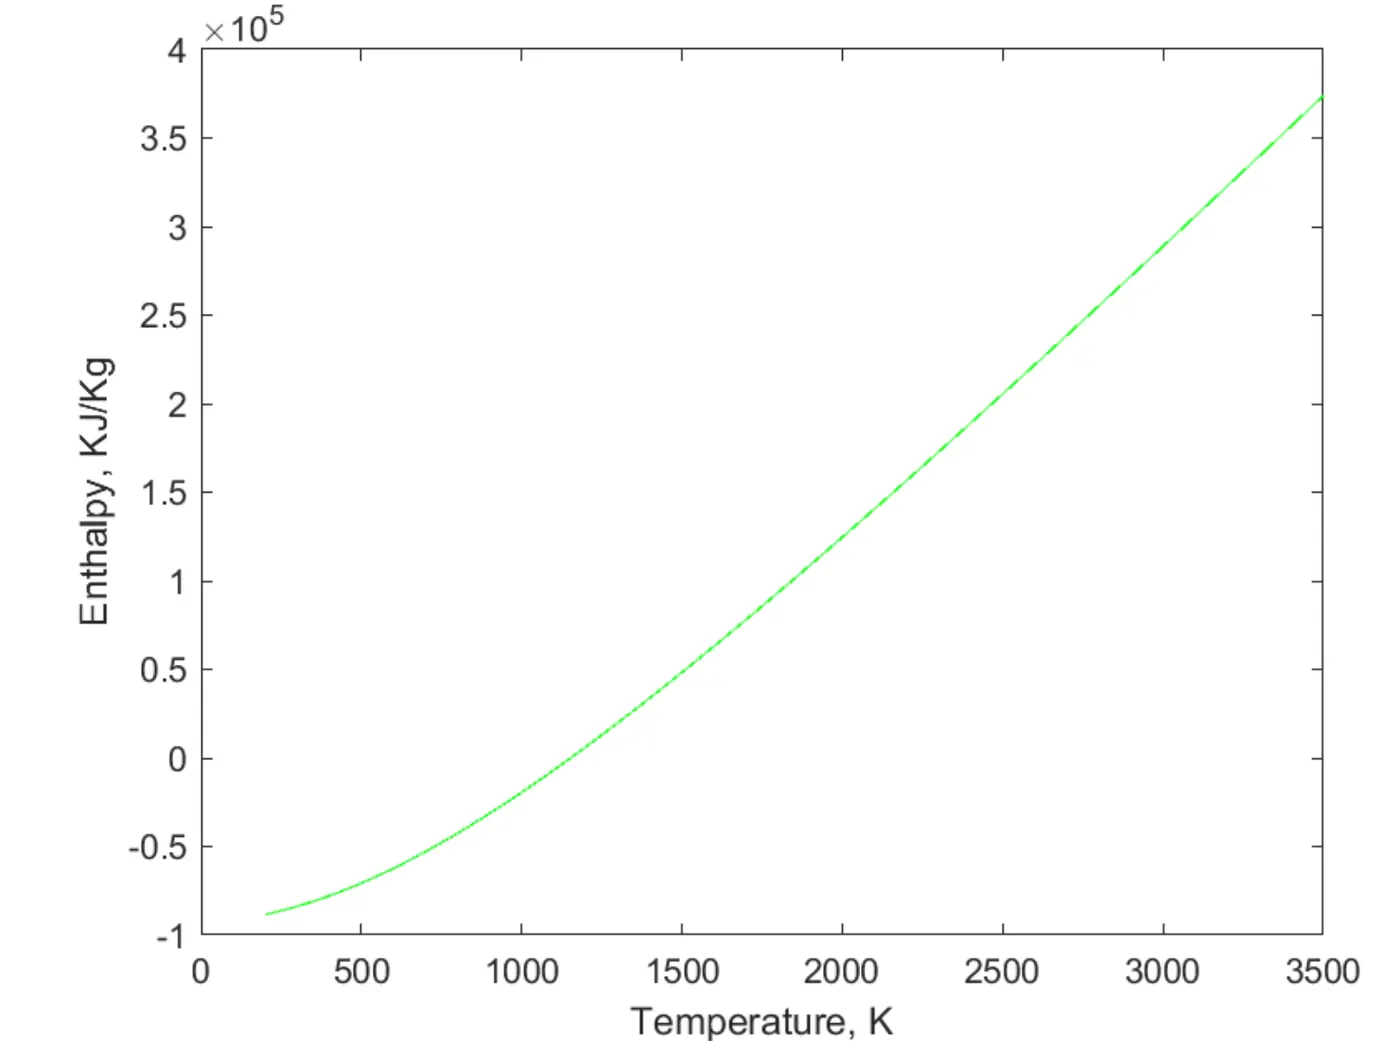
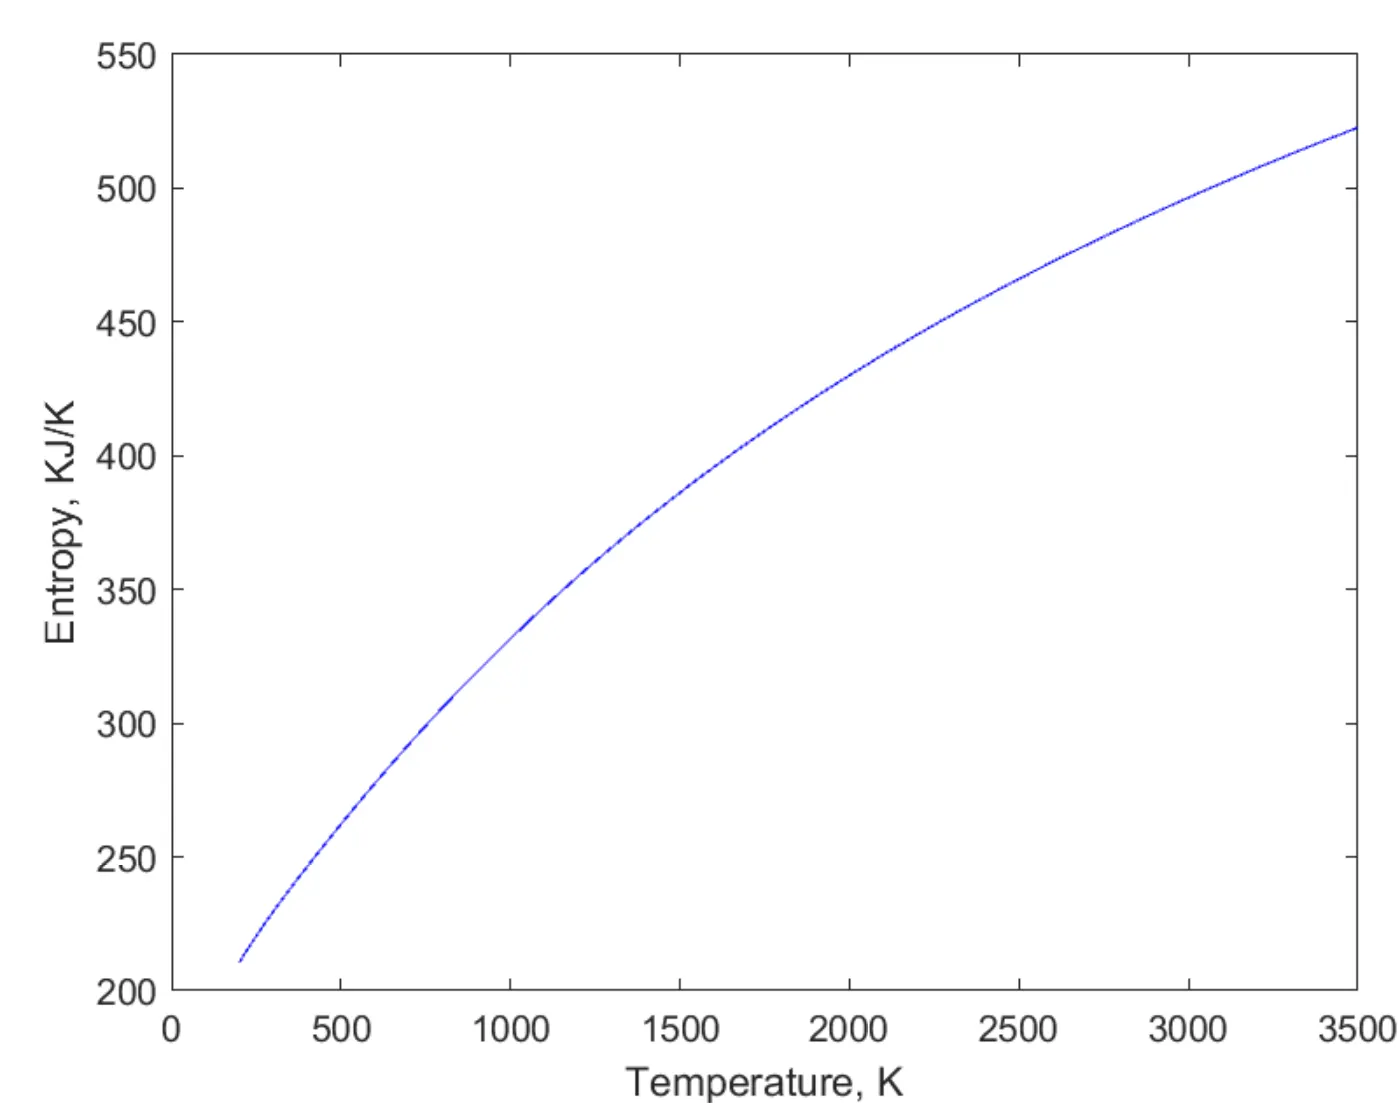
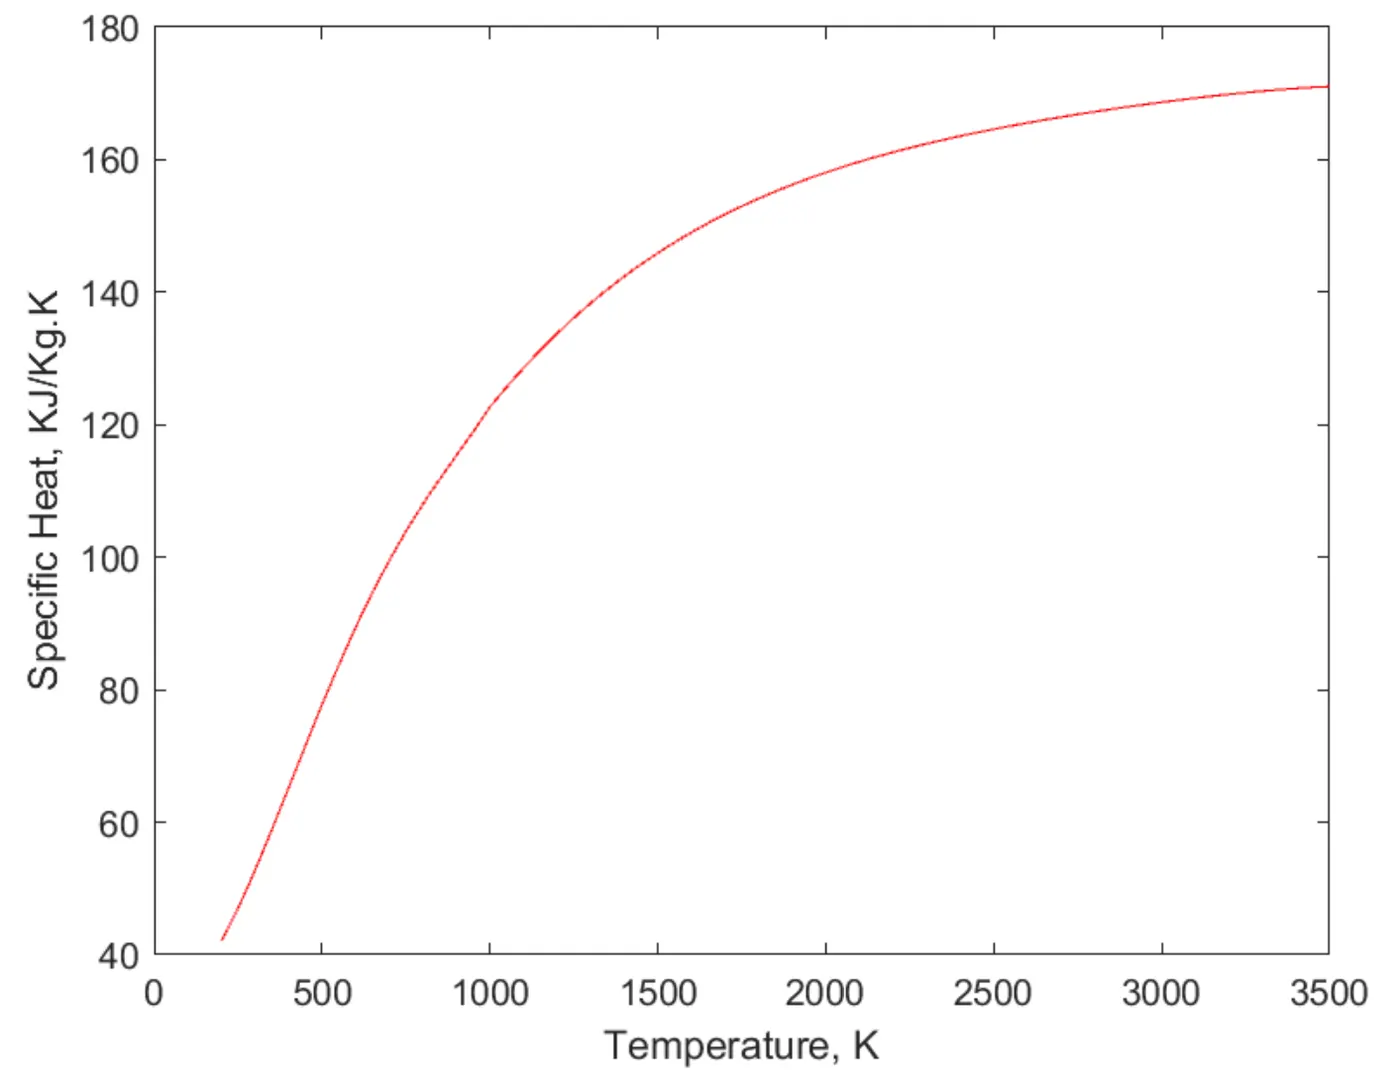
Plots for C2H6:
Errors:
Following error was thrown when trying to extract the first element of the str cell into the species_name variable:

It was due to using parenthesis "()" instead of "{}" for cell arrays.

The split command splits the given text into a string array.
Since the resulting array is a cell, we cannot use () to call its elements.
After replacing the round brackets with curly brackets, the error was fixed.
