Parsing NASA thermodynamic data using MATLAB
Parsing NASA Thermodynamic Data
Introduction:-
NASA came up with polynomials that can be used to evaluate thermodynamic properties such as Cp, H, and S. They have also documented the coefficients that are required to evaluate these polynomials for 1000+ species.
This Project deals with distinguishing the species from the NASA Thermodynamic Data
Given Inputs & Formulae:-
- Specific Heat (Cp), Enthalpy (H), Entropy (S).
- a1 to a7 are coefficients.
- Here R is the universal gas constant, T is the temperature

To find:-
- Write a function that extracts the 14 coefficients and calculates the enthalpy, entropy, and specific heats for all the species in the data file.
- Calculate the molecular weight of each species and display it in the command window.
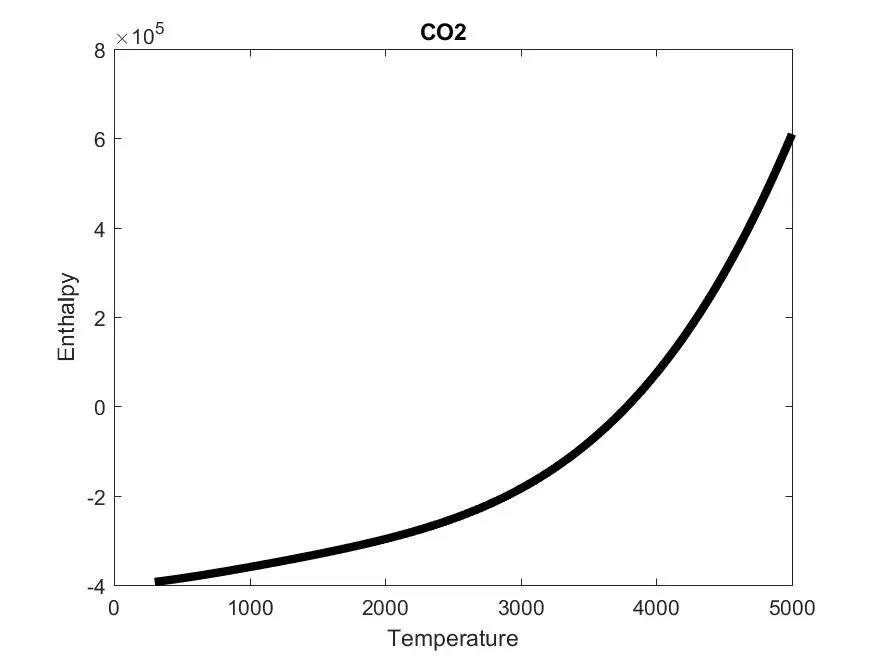
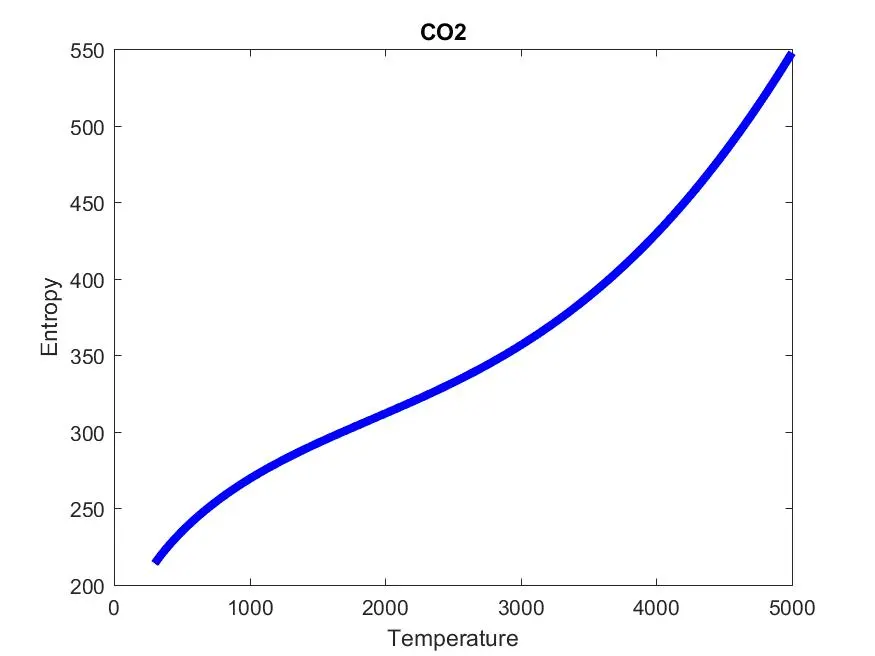
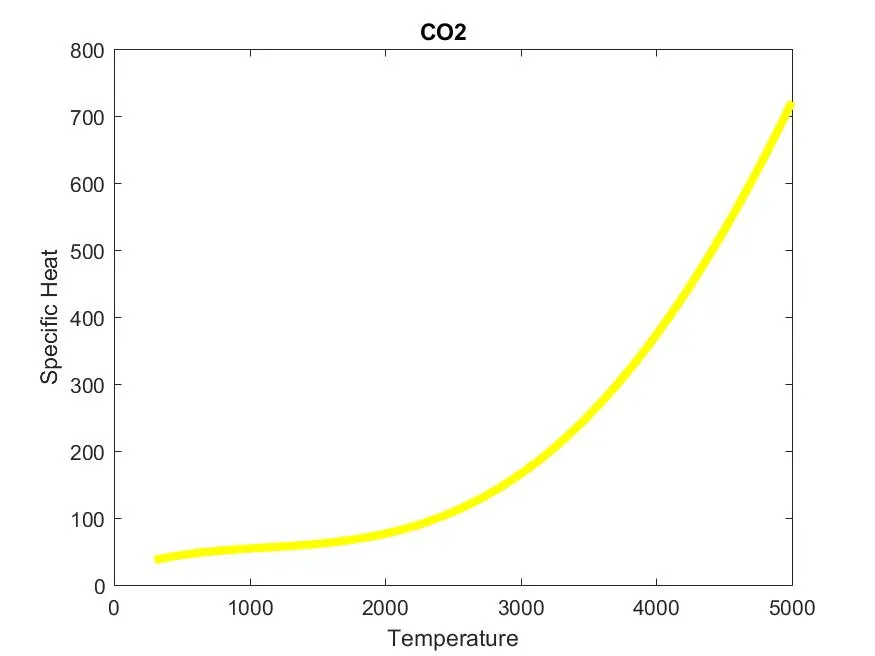
- Plot the Cp, Enthalpy, and Entropy for the local temperature range (low temperature: high temperature) specific for each species.
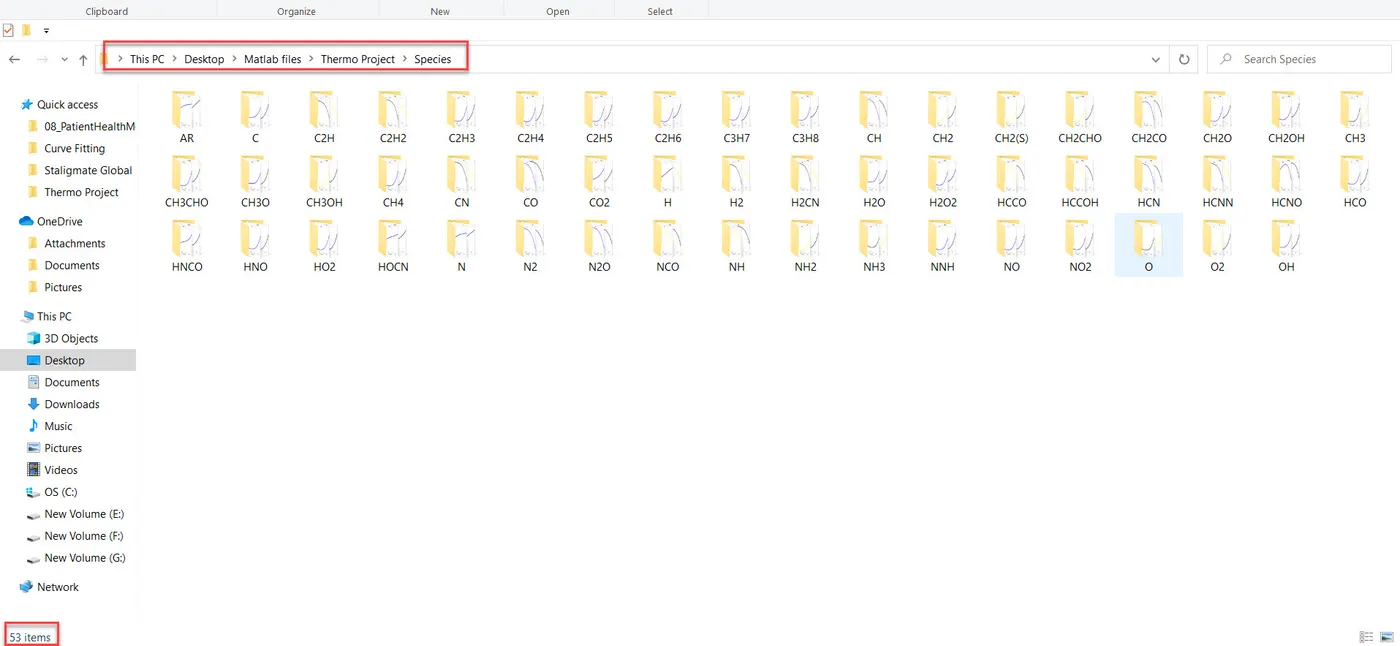
- Save the plots for N2, O2, CO2 as images with appropriate names and dump them in separate folders for each species with a suitable name. All of these should be generated automatically.
File Parsing:-
- File Parsing usually refers to how information can be read from a particular text file or any type of file.
- Analyze how that information can be read in a computer program
- Once the data is analyzed we can transform it and plot accordingly.
Given Data:- NASA Thermodynamic Data
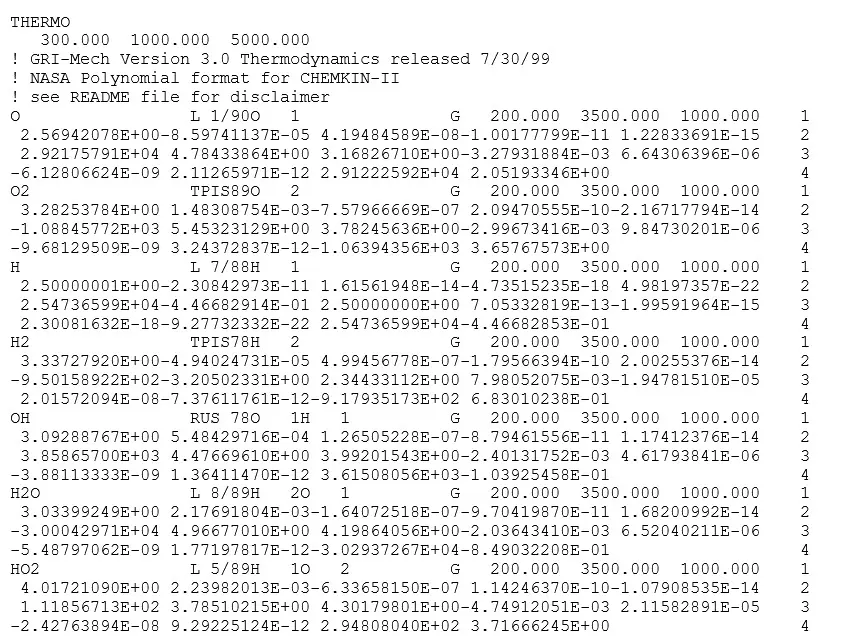
- The data is not arranged properly and will gonna explain in detail how it can be sorted out File Parsing could be done.
- Let's break into a simpler way
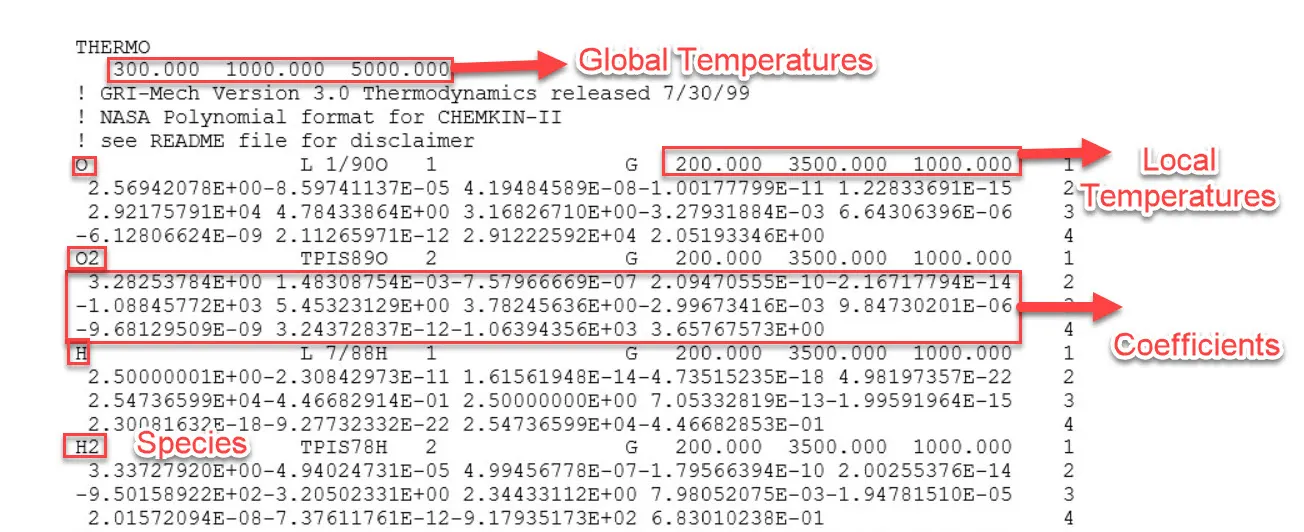
Molecular_Weight_Function code:-
function MW = Molecular_Weight_Function(species)

%Atoms Hydrogen, Carbon, Nitrogen, Oxygen & Argon are considered
Atoms = ['H', 'C', 'N', 'O', 'A'];

%Atomic weight is taken precisely upto .4 decimals
Atomic_weight = [1.0078 12.0107 14.0067 15.9994 39.948];

MW = 0;

for i=1:length(species)
    for j=1:length(Atoms)
        if strcmp(species(i),Atoms(j))
           MW = MW + Atomic_weight(j);
           u = j;
        end
    end
%increase in number of same molecules
    n = str2num(species(i));
    if n>1
        MW = MW + Atomic_weight(u)*(n-1);
    end
end
end
Molecular_Weight_Function code:-
close all
clear all
clc
%Opening and reading THERMO data file
file = fopen('THERMO.dat','r')

%Heading skip
line1 = fgetl(file)

%Global Temperature values skip
line2 = fgetl(file)

%Next 3 lines are comments, so skip
des_1 = fgetl(file)
des_2 = fgetl(file)
des_3 = fgetl(file)

A = strsplit(line2,' ');
Global_low_temperature = str2num(A{2})
Global_mid_temperature = str2num(A{3})
Global_high_temperature = str2num(A{4})

%species information from THERMO file
for i=1:53

    species= fgetl(file);

    species_name = species(1:6)

Line_1 = fgetl(file);

L1 = strfind(Line_1,'E');

a1 = str2num(Line_1(1:(L1(1)+3)));

a2 = str2num(Line_1((L1(1)+4):(L1(2)+3)));

a3 = str2num(Line_1((L1(2)+4):(L1(3)+3)));

a4 = str2num(Line_1((L1(3)+4):(L1(4)+3)));

a5 = str2num(Line_1((L1(4)+4):(L1(5)+3)));


Line_2 = fgetl(file);

L2 = strfind(Line_2,'E');

a6 = str2num(Line_2(1:(L2(1)+3)));

a7 = str2num(Line_2((L2(1)+4):(L2(2)+3)));

a8 = str2num(Line_2((L2(2)+4):(L2(3)+3)));

a9 = str2num(Line_2((L2(3)+4):(L2(4)+3)));

a10 = str2num(Line_2((L2(4)+4):(L2(5)+3)));


Line_3 = fgetl(file);

L3 = strfind(Line_3,'E');

a11 = str2num(Line_3(1:(L3(1)+3)));

a12 = str2num(Line_3((L3(1)+4):(L3(2)+3)));

a13 = str2num(Line_3((L3(2)+4):(L3(3)+3)));

a14 = str2num(Line_3((L3(3)+4):(L3(4)+3)));

%creating folder for each species
mkdir(['C:UsersBINDUDesktopMatlab filesThermo ProjectSpecies',species_name]);

%Temperature ranges assumed for calculation purpose
Temperature = linspace(300,5000,100);

%Universal gas constant
R =8.314;

%calculation of properties based on the lower and upper temperature
for j = 1:length(Temperature)
    if Temperature(j)<3000

%formulae to calculate Specific Heat (Cp), Enthalpy (H), Entropy (S)

Cp = (a1+a2.*Temperature+a3.*Temperature.^2+a4.*Temperature.^3+a5.*Temperature.^4).*R;
H = (a1+(a2.*Temperature)./2+(a3.*Temperature.^2)/3+(a4.*Temperature.^3)/4+(a5.*Temperature.^4/5)+a6./Temperature).*Temperature.*R;
S = (a1*log(Temperature)+a2.*Temperature+(a3.*Temperature.^2)/2+(a4.*Temperature.^3)/3+(a5.*Temperature.^4)/4+a7).*R;
    else
Cp = (a8+a9.*Temperature+a10.*Temperature.^2+a11.*Temperature.^3+a12.*Temperature.^4).*R;
H = (a8+(a9.*Temperature)/2+(a10.*Temperature.^2)/3+(a11.*Temperature.^3)/4+(a12.*Temperature.^4/5)+a13./Temperature).*Temperature.*R;
S = (a8.*log(Temperature)+a9.*Temperature+(a10.*Temperature.^2)/2+(a11.*Temperature.^3)/3+(a12.*Temperature.^4)/4+a14).*R;
    end
end

%plotting

%Temperature vs Entropy
figure(1)
plot(Temperature,S,'linewidth',4,'color','b')
title(species_name)
xlabel('Temperature')
ylabel('Entropy')

%Temperature vs Enthalpy
figure(2)
plot(Temperature,H,'linewidth',4,'color','k')
title(species_name)
xlabel('Temperature')
ylabel('Enthalpy')

%Temperature vs Specific heat
figure(3)
plot(Temperature,Cp,'linewidth',4,'color','y')
title(species_name)
xlabel('Temperature')
ylabel('Specific heat')

directory = (['C:UsersBINDUDesktopMatlab filesThermo ProjectSpecies',species_name]);   %changing the filepath to save the plots
cd(directory)

%saving the plots

saveas(1,'Entropy.jpg');
saveas(2,'Enthalpy.jpg');
saveas(3,'Specific heat.jpg');

cd('C:UsersBINDUDesktopMatlab filesThermo Project')       %switching the directory back to read thermodat file for molecular weight calculation

MW = Molecular_Weight_Function (species_name)

end

fclose(file)
Code Explanation:-
- open and read the given THERMO data file
- skipping the first line with fgetl command and the second line is important as it had global temperature ranges for which the thermodynamic properties are valid
- from the 3rd line, we can see every other block follows a particular structure with species and local temperatures.
- Global Temperatures are extracted in an array A and split using strsplit command.
- str2num is used to convert the strings into numbers. Global_low_temperature, Global_mid_temperature, Global_high_temperature are extracted.
- 53 species information by using for loop i=1:53
- strsplit command to extract the first species name
- findstr command to extract the local temperatures for each line.
- continued the same for each species to find 14 coefficients.
- solving the equations to calculate Specific Heat (Cp), Enthalpy (H), Entropy (S)
- mkdir command to create folders for each species and saving the plots
- plots are saved as jpg files
- To calculate the molecular weights separate program is created where the species and their weights are inputs and proper array's are used.
- strcmp is used to compare Atoms & Atomic Weights
- molecular weights are shown in the command window
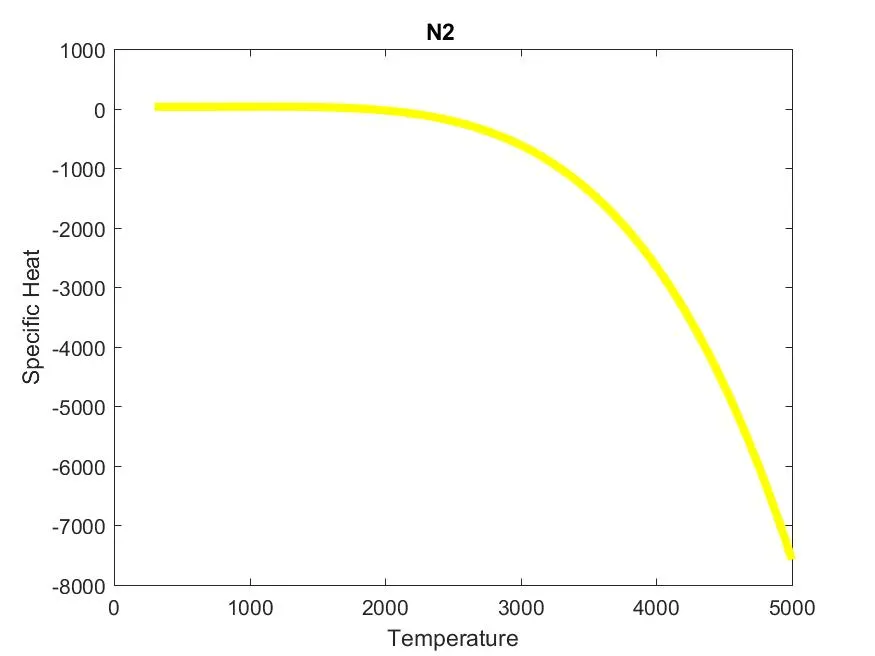
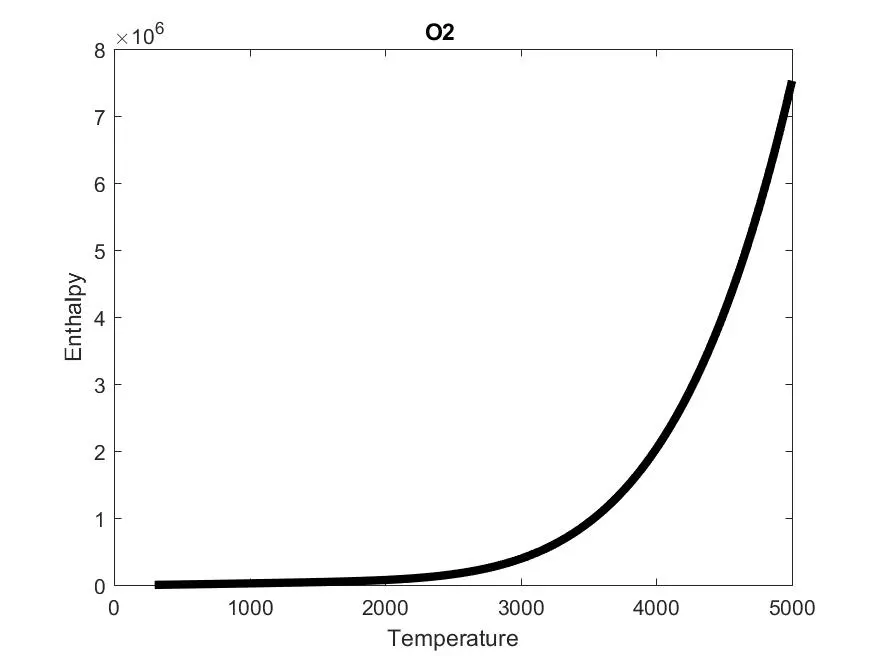
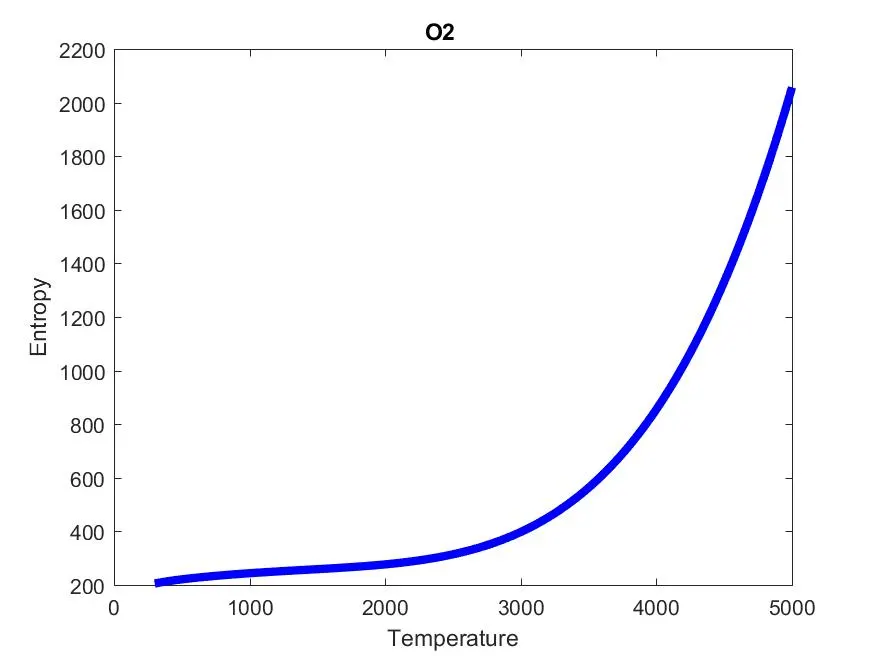
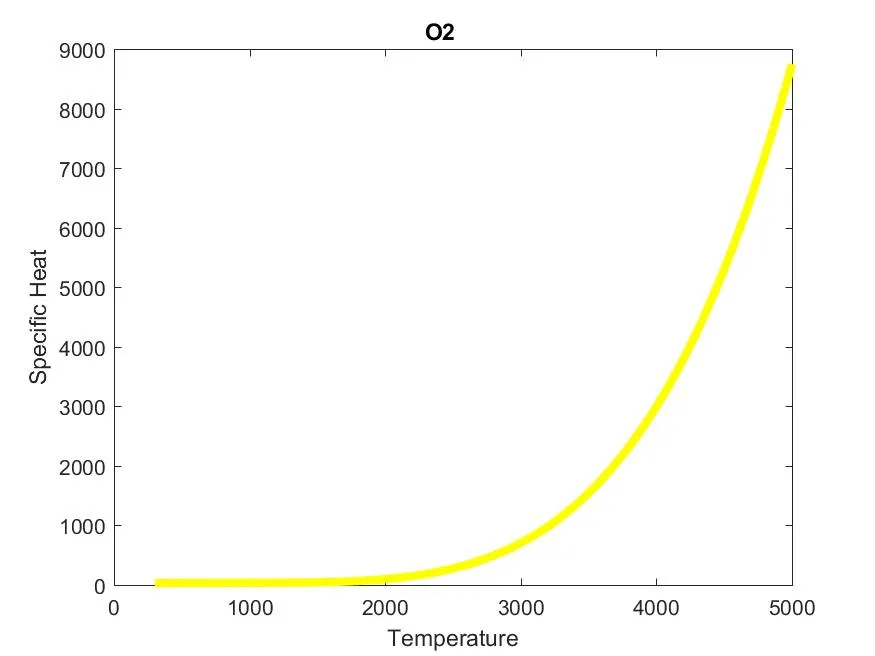
- Required plots are attached and all species and provided with screenshots.
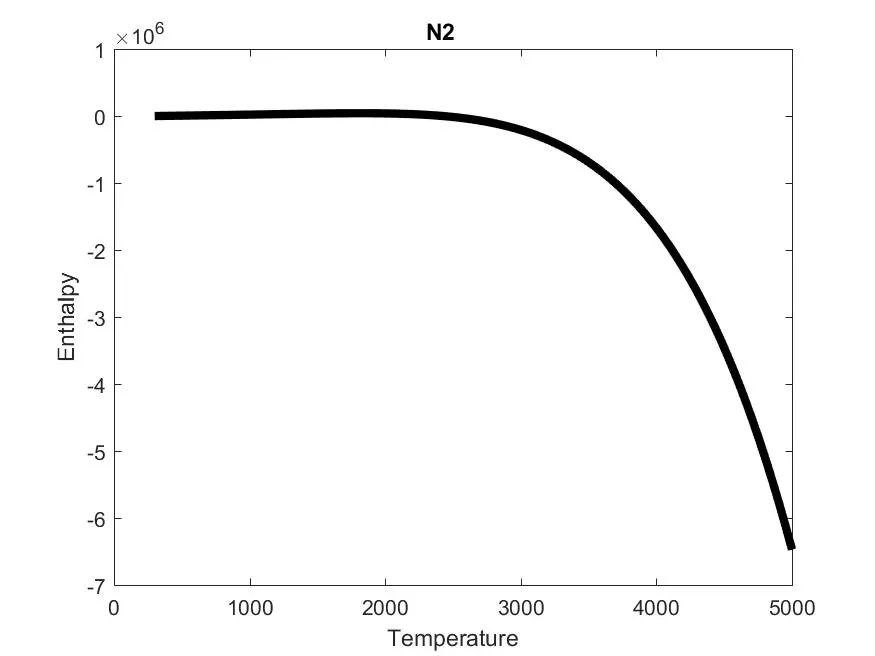
Plots showing Specific Heat (Cp), Enthalpy (H), Entropy (S) for N2:-
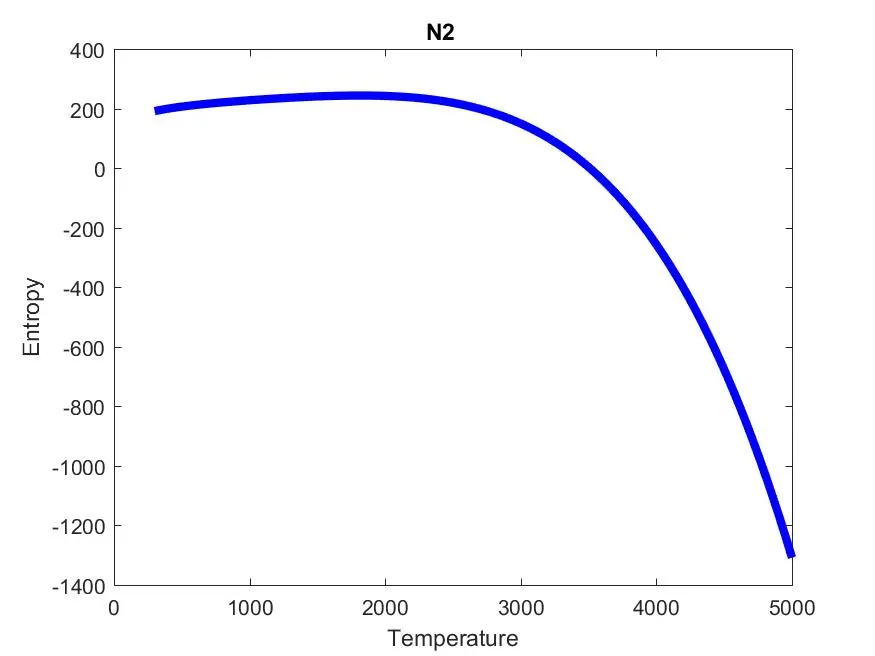
Plots showing Specific Heat (Cp), Enthalpy (H), Entropy (S) for O2:-
Plots showing Specific Heat (Cp), Enthalpy (H), Entropy (S) for CO2:-
Plot data that are saved automatically:-
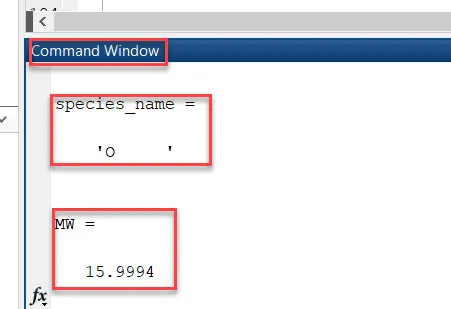
Molecular Weight from command window:-
- The file is saved in a plain text document as it's a lengthy data output Command Window
Species plots link:- https://drive.google.com/drive/folders/1E1twOedCBsxMptVRN_06K4kZK9D_j5Vs?usp=sharing
Conclusion:-
Therefore Parsing of NASA Thermodynamic Data is done and required plots are attained with the molecular weights and stored respectively.