Parsing NASA thermodynamic data
FILE PARSING OF NASA THERMODYNAMIC DATA
OBJECTIVE: To parse data of NASA's thermodynamic data file and to calculate the thermodynamic properties of various gas species.
NASA THERMODYANAMIC DATA:
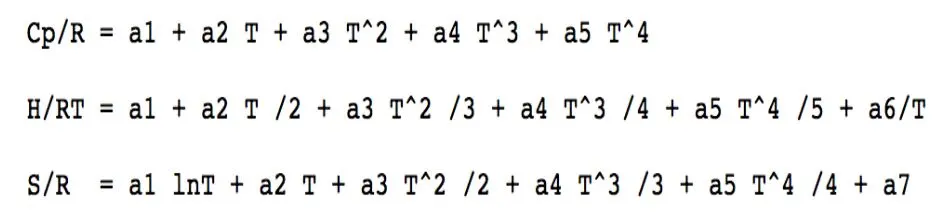
NASA came up with polynomials that can be used to evaluate thermodynamic properties such as Cp, H and S. They have also documented the co-efficients that are required to evaluate these polynomials for 1000+ species and to create a function that extracts the 14 co-efficients and calculates the enthalpy, entropy and specific heats for all the species in the data file. You will be reading this file NASA thermodynamic data.Also to calculae the molecular weight of each species.
Formula:
PARSER:
A parser is a compiler or interperter component that breaks data into smaller elements for easy translation into another language. A parser takes input in the form of a sequence of tokens or program instructions and usually builds a daa structur in the form of a parse or an abstract syntax tree.
A parser is commonly used as a component of an interpeter or a compiler.
The process of parsing involves three stages:
1.Lexical Analysis: A Lexical analyzer is used to produce tokens from a stream of input string characters which are broken into small components to form meaningful expressions.
2.Syntacic Analysis: Checkswhether the generated tokens form a meaningful expression.This makes use of context free grammar that defines algorithm procedures fro components.These work to form an expression and define the particular order in which tokens mustbe placed.
3.Semantic Parsing:The final parsing stage in wich the meaning and implications of the validated expression are determined and neccessary actions are taken.
In the program we will be parsing the data and calculating the coefficients for finding the specific heat,Enthalp,Entropy for various species.
PROGRAM:
clear all
close all
clc

%universal gas constant
R=8.314;

% Reading Header

f1 = fopen('THERMO.dat','r');
Header = fgetl(f1);

%reading global temperature line

Global_temp = fgetl(f1);
C = strsplit(Global_temp,' ');
global_low_temp = str2double(C{2}); %global low temperature
gobal_mid_temp  = str2double(C{3}); %global mid temperature
gobal_high_temp = str2double(C{4}); %global high temperature

%%skipping 3 lines
fgetl(f1);
fgetl(f1);
fgetl(f1);

%using for loop to consider 53 elements

for i = 1:53
    line = fgetl(f1); %reading the line
    A = strsplit(line,' '); %separating variable
    species = A(1); %Name first variable as species
    Q = strfind(line, 'G');
local_low_temp = line(Q+3:55);
local_high_temp = line(Q+13:65);
local_mid_temp = line(Q+23:75);
lt = str2double(local_low_temp); %local low temperature
ht = str2double(local_high_temp); %local high temperature
mt = str2double(local_mid_temp); %local mid temperature

% line 1 reading the coefficient data

cfline1 = fgetl(f1);
X = strfind(cfline1, 'E');
a1 = cfline1(1:X(1)+3);
a1 = str2double(a1); %storing 1st coefficient
a2 = cfline1(X(1)+4:X(2)+3);
a2 = str2double(a2); %storing 2nd coefficient
a3 = cfline1(X(2)+4:X(3)+3);
a3 = str2double(a3); %storing 3rd coefficient
a4 = cfline1(X(3)+4:X(4)+3);
a4 = str2double(a4); %storing 4th coefficient
a5 = cfline1(X(4)+4:X(5)+3);
a5 = str2double(a5); %storing 5th coefficient

% line2 - reading coefficient dat of 2nd line

cfline2 = fgetl(f1);
G = strfind(cfline2, 'E');
a6 = cfline2(1:G(1)+3);
a6 = str2double(a6); % storing 6th coefficient
a7 = cfline2(G(1)+4:G(2)+3);
a7 = str2double(a7); %storing 7th coefficient
a8 = cfline2(G(2)+4:G(3)+3);
a8 = str2double(a8); %storing 8th coefficient
a9 = cfline2(G(3)+4:G(4)+3);
a9 = str2double(a9); %storing 9th coefficient
a10= cfline2(G(4)+4:G(5)+3);
a10= str2double(a10); %storing 10th coefficient

%line 3 - reading coefficient data of 3rd line

cfline3 = fgetl(f1);
I = strfind(cfline3, 'E');
a11 = cfline3(1:I(1)+3);
a11 = str2double(a11); %storing 11th coefficient
a12 = cfline3(I(1)+4:I(2)+3);
a12 = str2double(a12); %storing 12th coefficient
a13 = cfline3(I(2)+4:I(3)+3);
a13 = str2double(a13); %storing 13th coefficient
a14 = cfline3(I(3)+4:I(4)+3);
a14 = str2double(a14); % storing 14th coefficient

%ranging the temperature, low temperature to high temperature

T=linspace(lt,ht,500);

%specific Heat
Cp=specific_heat(a1,a2,a3,a4,a5,a6,a7,a8,a9,a10,a11,a12,a13,a14,T,R,lt,ht,mt);

%Entropy
S=entropy(a1,a2,a3,a4,a5,a6,a7,a8,a9,a10,a11,a12,a13,a14,T,R,lt,ht,mt);

%Enthalpy
H=enthalpy(a1,a2,a3,a4,a5,a6,a7,a8,a9,a10,a11,a12,a13,a14,T,R,lt,ht,mt);

%saving as folder
spec=char(species);
fd = sprintf('%s',spec);
cur_dir=pwd;
mkdir(spec);
cd(spec);

%plot1, specific heat (cp) vs temperature(T)

figure(1);
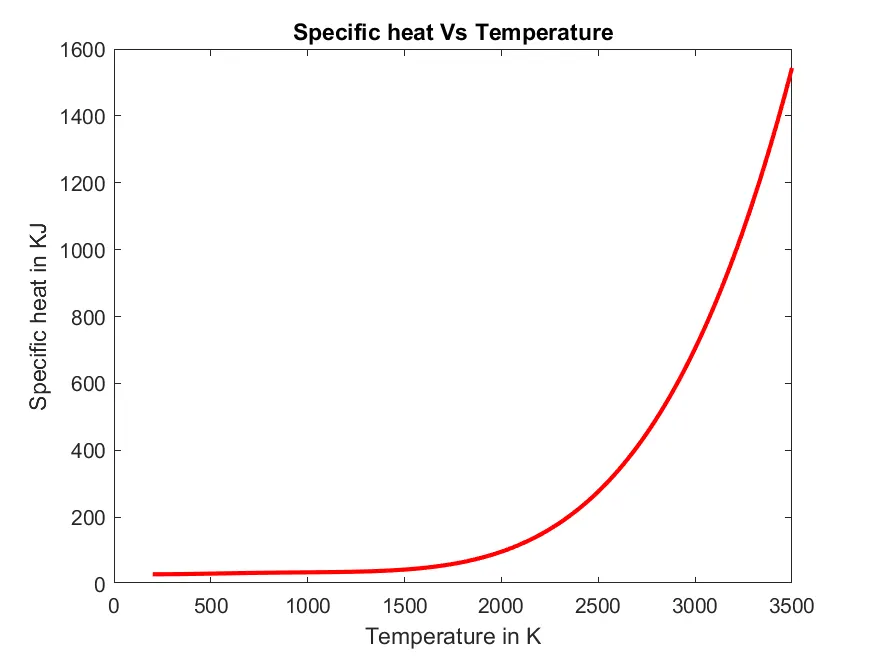
plot(T,Cp,'linewidth',2,'color','r');
xlabel('Temperature in K');
ylabel('Specific heat in KJ');
title('Specific heat Vs Temperature');

%plot2, Enthalpy(H) Vs yemperature (T)

figure(2);
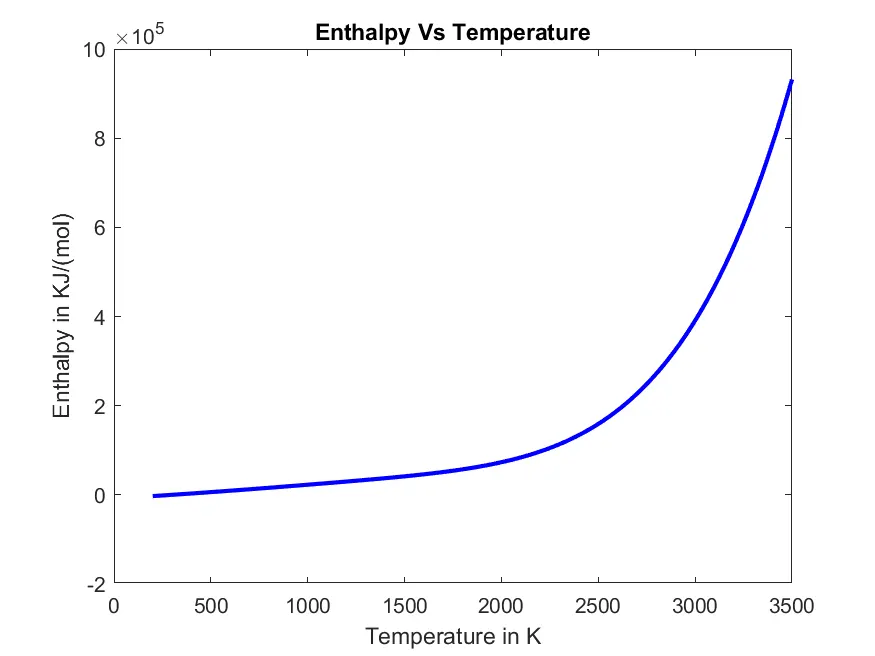
plot(T,H,'linewidth',2,'color','b');
xlabel('Temperature in K');
ylabel('Enthalpy in KJ/(mol)');
title('Enthalpy Vs Temperature');

%plot 3 , Entropy (S) Vs (Temperature (T)

figure(3);
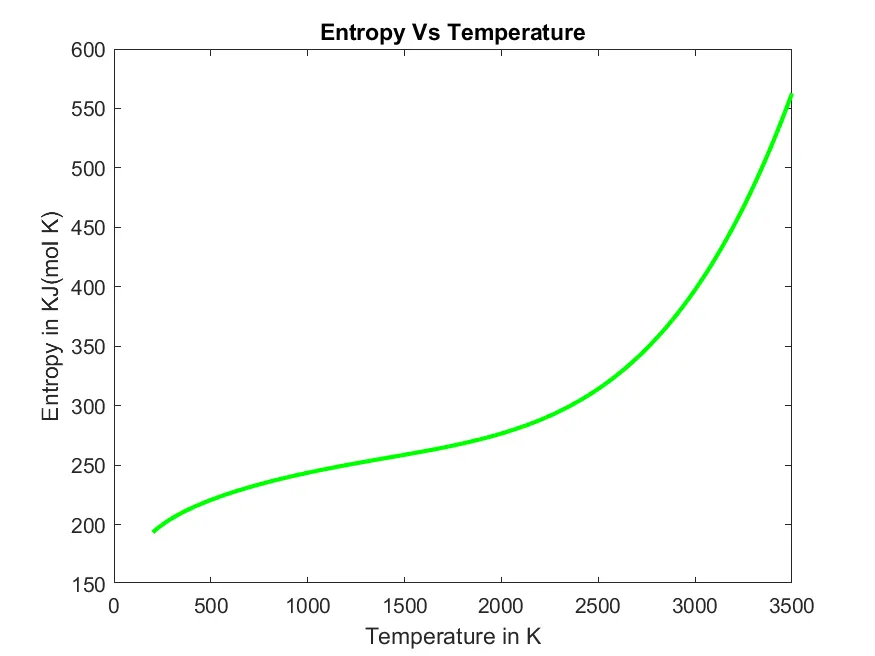
plot(T,S,'linewidth',2,'color','g');
xlabel('Temperature in K');
ylabel('Entropy in KJ(mol K)');
title('Entropy Vs Temperature');

% saving the plots that is generated

saveas(figure(1),'cp.png');
saveas(figure(2),'h.png');
saveas(figure(3),'s.png');
cd(cur_dir);
% Molecular_mass(species)
M=molecular_mass(species)
f2 = fopen('molecular mass','W');
fprintf('%s n %s n %f n','species','Molecular mass',M)
fclose(f2)
end

fclose(f1);
The command used are fopen,fgetl,strsplit,str2double.Here we are going to open the THEMO.dat file for reading by using the command fopen and assingning to the variable called f1.
Then, the fgetl(f1) is the acts like a line cursor, which will retrive the next time while running this command for the second time ans so on.
After reading the second line we have splitted with strsplit command by giving the string name as GlobalTemp and the delimeter used for spliy is (' ').The it is assigned to the variable called temp. This will split the whole line into number of cells then the sting values are converted into number by using the command called str2double.
Function for Specific Heat:
function Cp=specific_heat(a1,a2,a3,a4,a5,a6,a7,a8,a9,a10,a11,a12,a13,a14,T,R,lt,ht,mt)
if T>=mt
    Cp=(a1+a2.*(T)+a3.*(T.^2)+a4.*(T.^3)+a5.*(T.^4))*R;
else
    Cp=(a8+a9.*(T)+a10.*(T.^2)+a11.*(T.^3)+a12.*(T.^4))*R;
end
Fuction for Ethalpy:
function H=enthalpy(a1,a2,a3,a4,a5,a6,a7,a8,a9,a10,a11,a12,a13,a14,T,R,lt,ht,mt)
if T>=mt
    H=(a1.*T+a2.*(T.^2)./2+a3.*(T.^3)./3+a4.*(T.^4)./4+a5.*(T.^5)./5+a6)*R;
else
    H=(a8.*T+a9.*(T.^2)./2+a10.*(T.^3)./3+a11.*(T.^4)./4+a12.*(T.^5)./5+a13)*R;
end
Fuction for Entropy:
function S=entropy(a1,a2,a3,a4,a5,a6,a7,a8,a9,a10,a11,a12,a13,a14,T,R,lt,ht,mt)
if T>=mt
    S=(a1.*log(T)+a2.*T+a3.*(T.^2)./2+a4.*(T.^3)./3+a5.*(T.^4)./4+a7)*R;
else
    S=(a8.*log(T)+a9.*T+a10.*(T.^2)./2+a11.*(T.^3)./3+a12.*(T.^4)./4+a14)*R;
end
Funtion for Molecular Mass:
%Function_for_Molecular_weight%
function M = molecular_mass(species)
atoms={'H','c','N','O','AR'};
AtomicWeight=[1 12 14 16 40];
M=0;

for i=1:length(species)
    for j=1:length(AtomicWeight)
        if (strcmp(species(i),atoms(j))==1)
            M=M+AtomicWeight(j);
            g=j;
        end
    end

    %Adding the weights of the repeating atoms
    n=str2double(species(i));
    if n>1
        p=(n-1);
        M=M+AtomicWeight(p)*(n-1);
    end
end

end
REPORT:
> The program uses the following commands 'fopen' command opens the thermodynamic data file [THERM.dat] and stores it to file called 'f1'.
'fgetl' of f1 command takes the values of the first line of THERM.dat file.
> The second line in the file represents gobal temperaures, thus the values are stored for temperature calculations.
>Since the temperature are inside the string we use 'strsplit' command that splits the string in the specified delimeter , here (' ') space is the delimeter after splitting the values are assigned to variables (global low,mid,and high temperatures) using 'str2double' command string value is converted to the numeric value.
> A temperature range with 500 values between gobal high and low temperature is made by using 'linspace' command the number of value is specified bt 'linspace' command.
> Preallocations are made to store the properties or daaof all the elements present in the file.
> Then skipping the 3 comment lines present in the THERM.dat file has command 'fgetl' of f1.
> command 'cd(pwd)' opens a presen working directory 'mkdir' command makes a new folder with the name specified inside brackets.
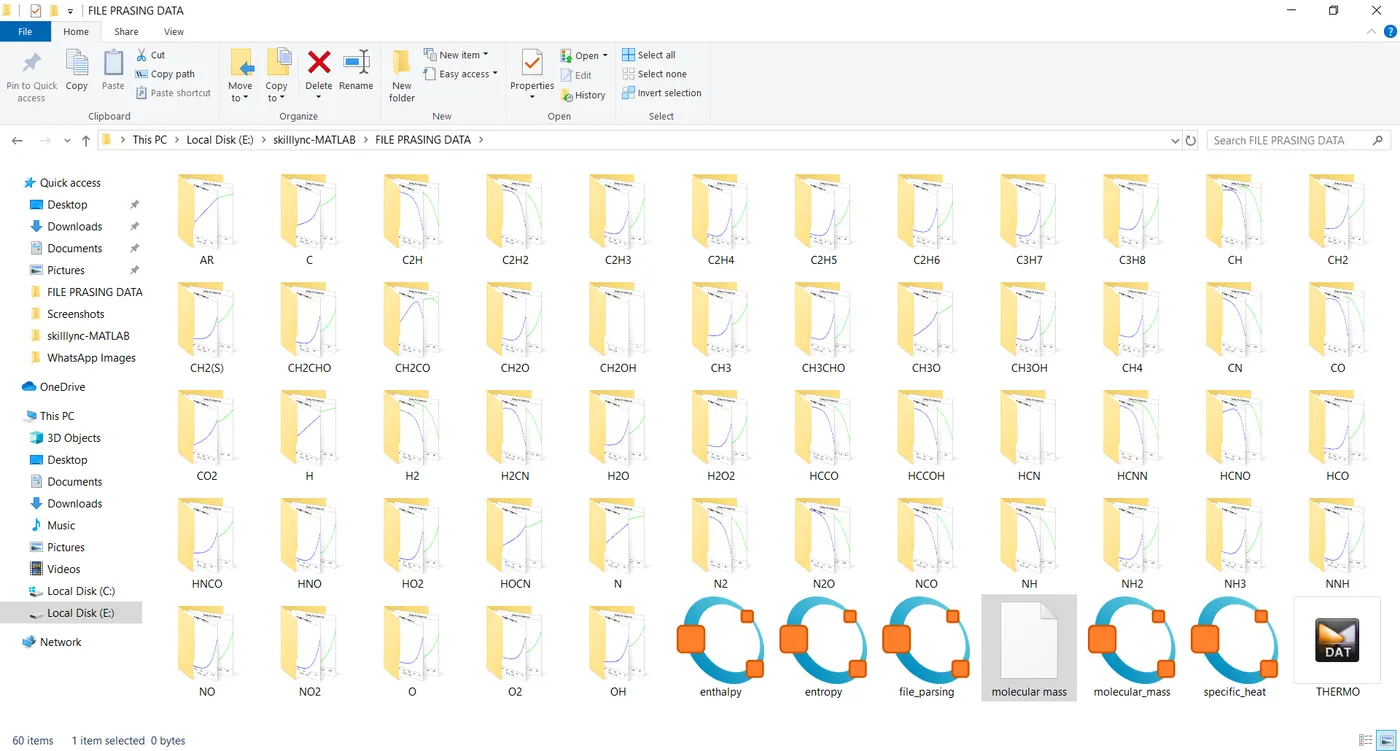
> A folder named 'Elements is created in the working which is used to store all the related output files of the program.
> Command 'cd()' makes the new folder as the directory. At last a 'for' loop must 'j' times where j is number of elements.
> After the loop gets executed, cd is used to get back to the original directory.
PLOTTING:
Plotting is done various gases as shown below:
Plots for O2:
Plots for N2:
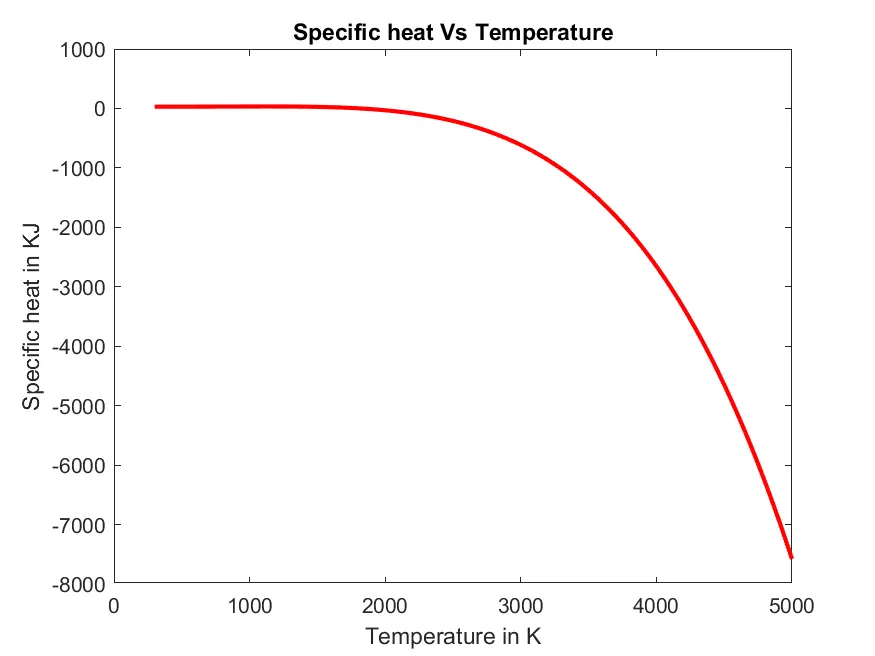
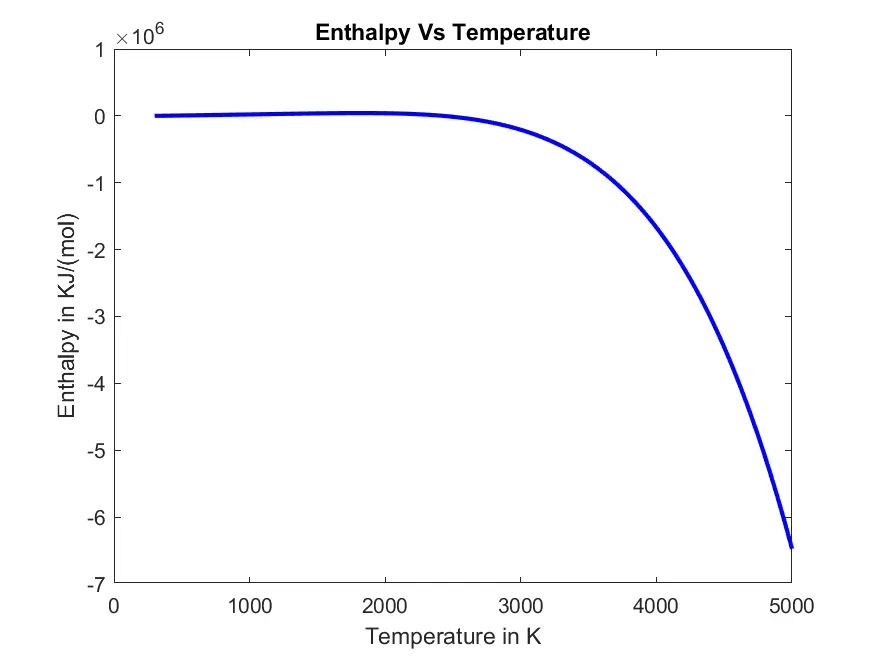
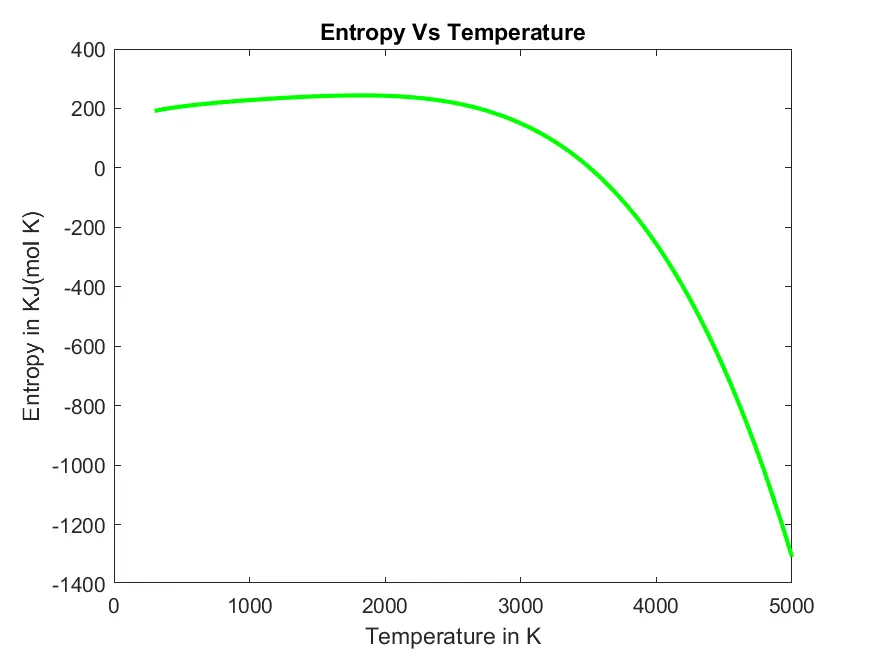
Plots for CO2:
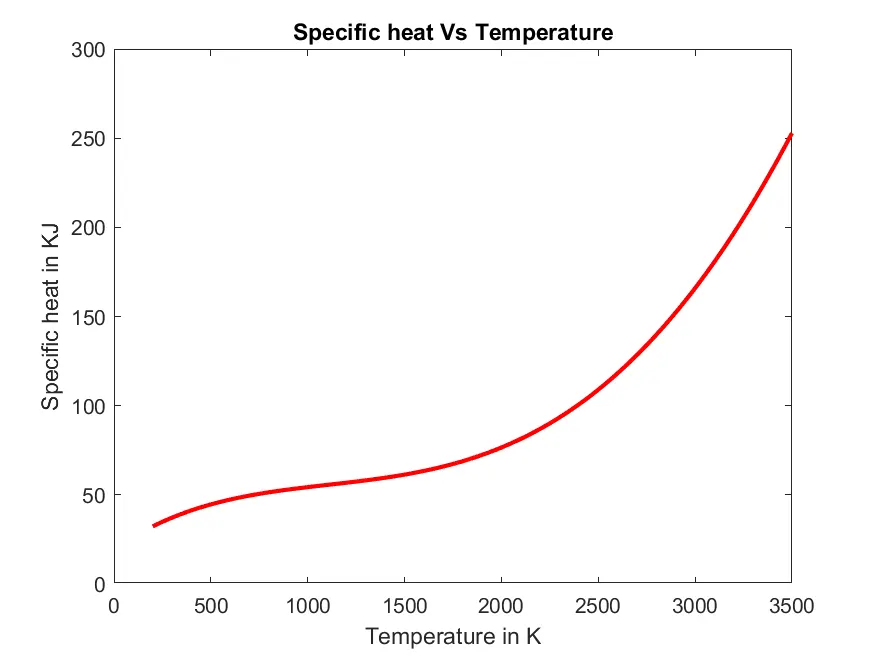
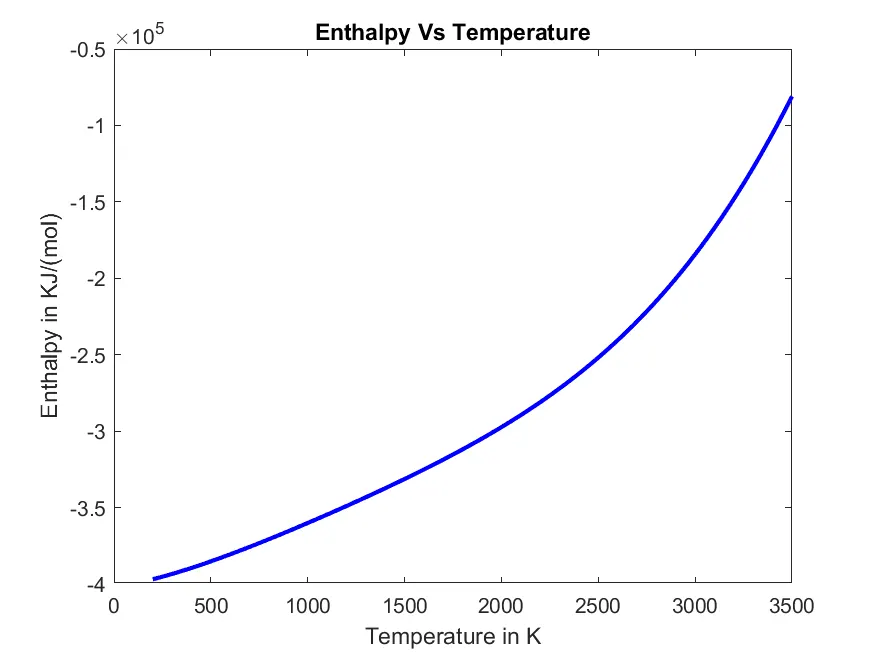
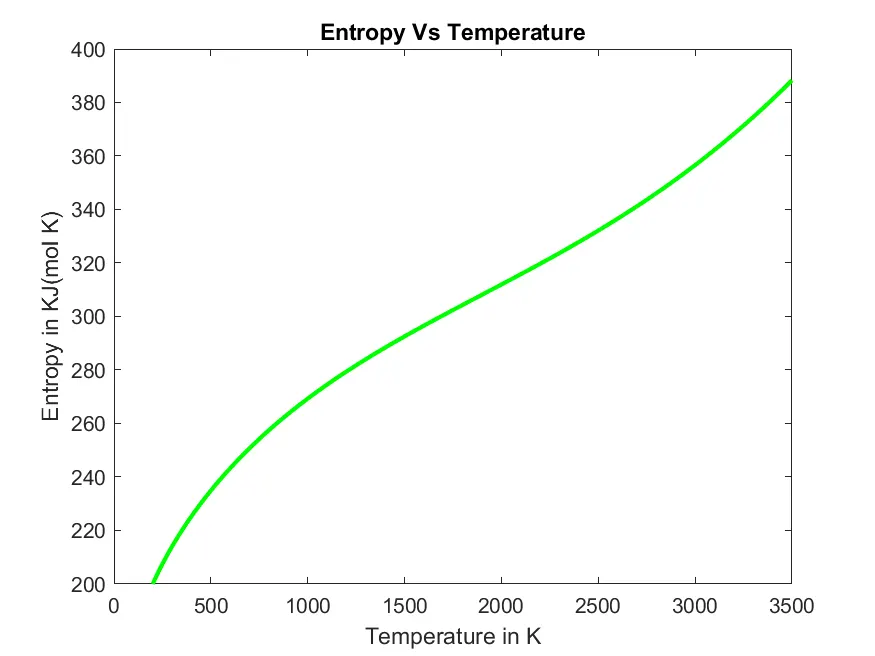
Image of Extracted Data:
Conclusion:
The File parsing for NASA hermodynamic Data and the thermodynamic properties like specific heat,enthalpy and entropy are calculated. Also plotting is done for the same and stored in the separae directory by using matlab code.