Project 1 - Parsing NASA thermodynamic data
AIM: To do file parsing of data file and plotting the parameters such as Specific heat, enthalpy and entropy for different species using Matlab/Octave.
Objective:
To open a data file and read line by line and extract the coefficients.
To do calculations on the extracted values and evaluate the Specific Heat, Entropy and Enthalpy.
To plot the Temp Vs CP, Temp Vs Enthalpy and Temp Vs Entropy.
Similarly, to do this for all the species presented in the data file(53 species are there).
Explanation/Steps to follow:
To create the program initially; clear all, close and clc command should be used.
It is not mandatory but it is a good to clear the command window and workspace and the different windows of the software, so that you program looks clean and clear also closing the different unnessary windows helps to run the software smoothly.
Start with writing the starting points of the links and ending points of the links, so that you will not have a writing all the things at a same time.
It is always a good practice to write the program in small sections and checking for the errors and afterwards combine them together.
Now, after that we have to open our data file which has name, THERMO.dat
Now, to open this file, we have to use the fopen command and assign it to a variable named 'f1'.
In the same command fopen we are using 'r' which means it reads the data only.
we need to assign it to a variable as in further programming it is needed to open and read that file so assign it to a variable becomes easier for us to call and read the data lines.
THERMO.dat file:
After fgetl command is used to read the line. Here first line (THERMO) has no use in our program, so we did not require to assign the first line to a variable.
After that, there are global temeperature values in the next line, we require those value, so we just use a variable A and we are reading those line.
NOTE: Here all the values from the THERMO.dat file is a string, so we need to convert into our number to do further calculations.
So, the second line is a string even it has a numeric values so, first of all we are using strsplit command to break the string where the space comes.
Now, it becomes an array as we required.Then we are converting the string into a number and assigning a variable to each column.
After that we are skipping up the next three lines as they are comments.
Then our main program starts from here, now as you can see in the data file, there is a line starting with a letter O which is nothing but the species name and there are many such different species in the data file.
Now, we have to use one species and to extract the coefficients from data file and use that coefficients in calculating the Specific Heat, Enthalpy and Entropy.
Specific Heat, Entropy and Enthalpy is the function of those value coefficients and a temperature. The temperature is defined at the end of line where the Species name is started(i.e. O).
So, we are now reading that header line where the species name starts and then again using the strsplit to split the line where the space bar is there.
And we are using end command (as i am using Octave) to get the last second column value and assigning it to a temperature t3 and end-2 to a temperature t2 and similarly for t1.
Now, after that we jump to next line and again reading the line and then we have to assign those different values to a different variables but here there is no spacing between two values, so for this we are using strfind to find a value from line.
Here,after observing data we came to know that those data file has an scientific value of 'E', so we will find that E from the numbers and after that E there is three values attached to a particular value(i.e 1212.1293221354E+01, here +01 are three values attached to every column) likewise it is present in every column.
We are assigning this strfind to a variable 'a'.
So, after that we are using variable a1 and in this coefficient line starting from first number to till E+3 values (1:a(1)+3)
similarly, we are assigning it for other 14 coefficients.
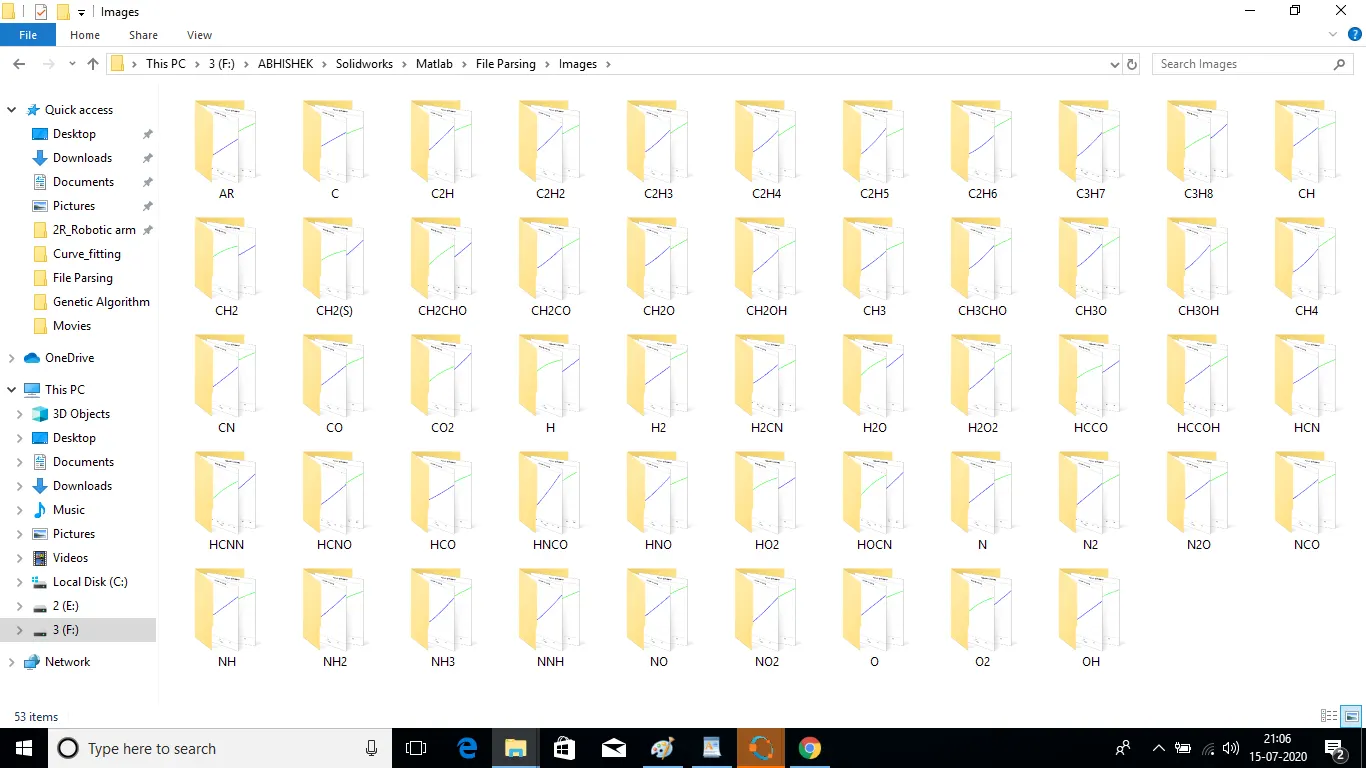
After that we are writing our program to create a folder for every species named with that species.
After creating a folder, we are writing codes to evaluate Specific Heat, Enthalpy and Entropy.
for this we are using linspace command to create different values for temperature.
Now, we are using for command and taking single values from a Temperature array and we have a condition that if the values for the temperature is greater than local temperature t2, then we will use high temp coefficients(a1-a7) and if it is lower than that then we lower temp coefficients(a8-a14).
So, we are using if else loop to evaluate this values.
Then we are plotting those values with respect to temperature.
Now, for a single species our problem is solved and now for those different species we need to type these codes again again instead of doing that we are using for loop.
Then we have to write a for loop from 1:53, as there are 53 species in total.
Then also we require to change the folders to save the different plots in different species, if we did not do this then our whole program saves on only a three photos which we have saved earlier.
To save ourselves from not doing this mistake, we have to change the folder and need to create a new folder to that particular species name.
Now, we are again locating our folder and then using 'cd' command we are changing the directory.
And then we after changing the directory, we are saving our plot image files.
#To calculate molecular mass for different species.
Then we are require to calculate the molecular mass and need to run the program for the different species.
To do this, we first calculating the molecular mass we first define our species, elements and atomic weight for elements such as hydrogen(H), Carbon(C), oxygen(O), Nitrogen(N) and Argon(A).
For each species, first we are reading species name and comparing each species letter with that element present in the element array. If this get equals then we are evaluating the molecular mass by adding the atomic mass to our empty molecular mass.
Now, uptill now we have only get a single molecular mass for a single element present in the species name.
Now, we have to add them according to the Molecular formula.
So, to do that we are converting the string into a number then we would obtain the number of elements present in that molecular formula.
Then we are using the atomic_weight(position) * (n-1) formula to get the molecular formula for each species using if command we just want the n should be positive. Here, position is used for the position of element such as H,C ,O,N, and A.
Then using display command we are displaying the output in a better way.
Then at last we are closing the data file using fclose command.
Program:
% Program to write a file parsing to code and to do further calculations in Matlab/Octave.

clear all
close all
clc

%To open file.
f1 =  fopen('THERMO.dat','r');
fgetl(f1);

%Reading the Header information
A = fgetl(f1);

%Here we are splitting lines with a delimiter having space between the strings.
A = strsplit(A,' ');

%Here we are converting the string to number and
%Curly braces are used as a cell instead of an array.
global_low_temperature = str2num(A{1});
global_mid_temperature = str2num(A{2});
global_high_temperature = str2num(A{3});

%Skipping next three lines aftr the temperature values.
for i = 1:3
    fgets(f1); %Here we are just reading lines and it automatically skips it.
end


%Reading the species data
for i = 1:53;

  %Starting with Mono-atomic Oxygen.
  header = fgetl(f1); %Reading the header line starting with O.
  speciesheader = strsplit(header,' '); %Splitting the line
  species_name = speciesheader{1}; %Giving the species name as the first word

  %Here we are using the header line and extracting the temperature values.

  %Here, end command is used to get the column from last
  %Here i am converting the string to number.
  t3 = str2double(speciesheader(end-1)); %The highest temp is at last second column.
  t2 = str2double(speciesheader(end-2));
  t1 = str2double(speciesheader(end-3));

  %Extracting the coefficients(a1-a5) from the monoatomic oxygen.
  line_1 = fgetl(f1);

  a = strfind(line_1,'E');
  a1 = str2num(line_1(1:a(1)+3));
  a2 = str2num(line_1(a(1)+4:a(2)+3));
  a3 = str2num(line_1(a(2)+4:a(3)+3));
  a4 = str2num(line_1(a(3)+4:a(4)+3));
  a5 = str2num(line_1(a(4)+4:a(5)+3));

  %Extracting the coefficients(a6-a10) from the monoatomic oxygen.
  line_2 = fgetl(f1);

  a_1 = strfind(line_2,'E');
  a6 = str2num(line_2(1:a_1(1)+3));
  a7 = str2num(line_2(a_1(1)+4:a_1(2)+3));
  a8 = str2num(line_2(a_1(2)+4:a_1(3)+3));
  a9 = str2num(line_2(a_1(3)+4:a_1(4)+3));
  a10 = str2num(line_2(a_1(4)+4:a_1(5)+3));

  %Extracting the coefficients(a10-a14) from the monoatomic oxygen.
  line_3 = fgetl(f1);

  a_2 = strfind(line_3,'E');
  a11 = str2num(line_3(1:a_2(1)+3));
  a12 = str2num(line_3(a_2(1)+4:a_1(2)+3));
  a13 = str2num(line_3(a_2(2)+4:a_1(3)+3));
  a14 = str2num(line_3(a_2(3)+4:a_1(4)+3));

  %Creating Folder
  A = mkdir(['F:\ABHISHEK\Solidworks\Matlab\File Parsing\Images\', species_name]);

  %Here i am creating an array of 1000 temperature values between t1 to t3.
  T = linspace(t1,t3,100);
  R = 8.314;
  %To get array of specific heat,enthalpy and entropy
   for k = 1:length(T);
     %Now, we would compare the spieces temperature to assign the coefficients
     if T(k) > t2

       %High Temperature Coefficients
       cp = (a1+a2.*T + a3.*T.^2 + a4.*T.^3 + a5.*T.^4)*R;

       H = (a1 +(a2.*T)/2 + (a3.*T.^2)/3 + (a4.*T.^3)/4 + (a5.*T.^4)/5 + (a6./T))*R.*T;

       S = a1.*log(T) + (a2.*T) + (a3.*T.^2)/2 + (a4.*T.^3)/3 + (a5.*T.^4)/4 + a7;

     else
       %Low Temperature Coefficients
       cp = (a8 + a9.*T + a10.*T.^2 + a11.*T.^3 + a12.*T.^4)*R;

       H = (a8 +(a9.*T)/2 + (a10.*T.^2)/3 + (a11.*T.^3)/4 + (a12.*T.^4)/5 + (a13./T))*R.*T;

       S = a8.*log(T) + (a9.*T) + (a10.*T.^2)/2 + (a11.*T.^3)/3 + (a12.*T.^4)/4 + a14;
     end
   end

 %Plotting the graphs
 figure(1)
 plot(T,cp, 'linewidth',3,'color','r')
 grid on
 title('Temperature Vs Specific Heat');
 xlabel('Temperature','color','b');
 ylabel('Specific Heat','color','b');

 figure(2)
 plot(T,H, 'linewidth',3,'color','b')
 grid on
 title('Temperature Vs Enthalpy');
 xlabel('Temperature');
 ylabel('Enthalpy');

 figure(3)
 plot(T,S, 'linewidth',3,'color','g')
 grid on
 title('Temperature Vs Entropy');
 xlabel('Temperature');
 ylabel('Entropy');


%Changing the Directory and Saving the file
saving = (['F:\ABHISHEK\Solidworks\Matlab\File Parsing\Images\',species_name]);
cd(saving);
saveas(1,"specific heat.png")
saveas(2,"enthalpy.png")
saveas(3,"entropy.png")

%molecular_mass
species = species_name;
elements = ['H','C','O','N','A'];
atomic_weight = [1.0079, 12.0107, 15.0999, 14.0067, 39.948];

%Calculating Molecular Mass for the different species.
mol_mass = 0;
for i = 1:length(species);
  for m = 1:length(elements);
     if strcmpi(species(i),elements(m)); %Here it check if both charcter string has same value
       mol_mass = mol_mass + atomic_weight(m);
       position = m;
     end
  end
end
 n = str2num(species(i));
 if n > 1
  mol_mass = mol_mass + (atomic_weight(position)*(n-1));
 end

disp(sprintf('Molecular Weight of %s:%f',species,mol_mass))
end
fclose(f1)
Results for the species 'O2':
The Plots for O2 is given Below:
Results for N2:
The Plots for the species are given below:
Results for CO2:
The plots for CO2 species is given below:
Output displayed at Command Window:
Your Command after running this program should create an automatically these species folder containing those plots:
Thank you for reading this out.