Project 1 - Parsing NASA thermodynamic data
PROJECT NAME – PARSING NASA THERMODYNAMIC DATA
AIM-
To write a MATLAB program to extract 14 coefficients from the matlab extras\THERMO.dat.txt file to calculate enthalpy, entropy, specific heat, for all the species in the data file. Also by plotting graphs of every species and find the molecular mass of the species.
OBJECTIVE-
- To write a function that extracts 14 co-efficient for a given species from the given information.
- To write functions that calculate the enthalpy, entropy, and specific heat using NASA polynomials for the given species.
- To write a function that plots the CP, Enthalpy, and Entropy of input species.
- To write a function that calculates the molecular weight of each species.
INTRODUCTION-
File parsing is done to extract data from the file, it should be generic as possible to fetch the data and by using this we calculate enthalpy, entropy & specific heat for different species and condition is that the FIRST 7 COEFFICIENTS are HIGH TEMPERATURE COEFFICIENTS & SECOND 7 COEFFICIENTS are LOW TEMPERATURE COEFFICIENTS.
Parsing can be defined as of breaking the data block into smaller blocks by following set of orders. so that it can be more easily interpreted, managed and sent to a computer NASA came up with the polynomials that can be used to evaluate thermodynamic properties such as CP, Enthalpy, and Entropy using polynomials. They have also documented the co-efficient that are required to evaluate these polynomials for 1000+ species.
The formulas to calculate CP, Enthalpy, and Entropy are given below-
a1, a2, a3, a4, a5,…. Are numerical coefficients
T is the temperature in kelvin (K).
R is the universal gas constant (J/k-mol.k).
Cp is the specific heat(J/k-mol.k).
H is the enthalpy(J).
S is the entropy(J/K).
Nasa thermodynamic data file
https://drive.google.com/file/d/1AikCHDlz9s_fu8whE81qee_GD4AyYpCP/view
Here I will show you some part of the file –
SOME IMPORTANT DEFINATIONS –
Specific heat = The specific heat of a substance is the amount of energy it takes to heat a specific mass of that substance through a specific temperature gradient. In SI systems, this is joules per kelvin per kg. So for instance it takes roughly 4184 joules to heat 1 kg of water (at room temperature) by 1 kelvin. (1 kelvin is the same temperature delta as 1 degree C). The specific heat of water at room temperature is therefore 4184 j/kg.K. Note that specific heat is not constant - it changes with temperature, so it may take more energy to heat a hot substance through 1 degree from 200 to 201 degrees as it does to heat the same substance through 1 degree from 20 to 21 degrees. The specific heat of air is about 718 j/kg.K. So if you heat 1 kg of air from 20 to 100 degrees you have used a lot less energy than you meed to heat 1 kg of water through the same temperature difference. This is why we use hot water bottles, not hot air bottles. There isn’t enough energy in a hot air bottle to last the night.
Enthalpy = Enthalpy is property of thermodynamics which is defined as the sum of internal energy of the system and product of pressure and volume of the system. It is denoted by 'H'.
the above statement can be interpreted as,
H = U + PV
SOME IMPORTANT POINTS REGARDING ENTHALPY
UNIT
1.) Enthalpy is measured in term of 'Joule' according to International system of unit (SI).
2.) In FPS, it is measured in BTU.
3.) In CGS, it is measured in calorie.
Entropy = Entropy comes in a bewildering number of flavors, interpretations, and misconceptions — from energy flow to disorder to information content — but I will assume that you refer to Thermodynamic Entropy, and mention some of the other “entropy definitions” only in passing.
Entropy S is a consequence of the Second Law of Thermodynamics, one form of which states that “In a closed or fully isolated system, unconstrained energy spontaneously tend to disperse, to spread out, from more concentrated forms to less concentrated forms.” That is, energy spontaneously flows from hot to cold, and never the other way around.
Entropy is not a material substance: S is a number, a measure of energy dispersal, as energy over temperature, in SI units as joule per kelvin (J/K) or — in base units — kg m22 s–2–2 K–1–1 (when measured as the “entropy content” of some substance, as S m–1–1, where m is either kg or mol). Simply put, entropy is a measure of the amount of “unusable energy” within a closed or isolated system (for example, our Universe).
To me, that gives us the “easiest” definition: Entropy is a measure — in units of joule per kelvin — of how energy in a closed or isolated system spontaneously disperses over time, and that total entropy in the Universe will always increase. Local and temporary decreasing entropy — as for example in Photosynthesis and Cellular Respiration— is always more than adequately compensated for by an increase of entropy elsewhere.
1. Write a function that extracts the 14 co-efficients and calculates the enthalpy, entropy and specific heats for all the species in the data file.
STEPWISE PROCEDURE-
Parsing NASA thermodynamic data refer to breaking up ordinary text so that we can easily find the data in that particular file so that while calculation we can find the exact location of that particular data.
- All the extra windows and old data is cleared with the help of clear all, close all, clc
- Then we read THERMO.DAT.txt file to calculate Enthalpy, Entropy & Specific heat.
- To read the file we assigned to a variable called f in order to get data with respect to global temperature, local temperature & calculation of coefficients thermodynamic properties.
- To access the next line we have used the command fgetL.
- First value of temperature is converted with the help of string 2 number(str2num) command so that the no in ‘’ can be converted into plain number.
- Now we have assigned temperatures to the global low temperature, global high temperature & global medium temperature
- Now as shown in the figure the lines are not useful so to neglect these lines we have used for loop 1:3 to skip these 3 lines
- To split the given value in line we have used strsplit.
- Then we have calculated value for species
- Now to convert local temperatures into double precision values and to convert the complex number into cell array/string array we will use str2double command.
- Now to Store the values of the second line of variables we will use fgetl command here also but assign it to the line
- And to find the value (string) of that particular line now we will use strfind command.
- Now again by using str2double command we will find 14 coefficients for all the species.
- First 7 species are of high temperature coefficients & next 7 are of lower temperatures.
- Now we will define higher and lower temperatures with the help of linspace command.
- Now we will calculate CP, h, & S for lower and higher temperature limits.
- We assumed universal gas constant R as 8.134 J/Mol-K & also in the above linspace commands we have defined our temperature ranges.
- After putting all the values of a in respective commands of enthalpy, entropy and specific heat wwe have to plot the graphs to see the nature of the graphs and their values.
- To do this in this project we have to Make Folders for saving the plots so the current_dir = pwd opens present working directory and the mkdir command makes the new folder with the name specified inside brackets.
- A folder named nasa graphs created in the working directory which is used to store all the related data of output files of the program.
- Command cd makes new folder as the directory which is used for storing all related output files of the program.
- After program get executed the cd(current_dir) command helps to return to the original directory.
clear all
clear all
clc
% step 1: Load file
f = fopen('THERMO.dat.txt','r');
fgetl(f);%skip first line
tempL = str2num(fgetl(f));%store value of temperature in variable.
globle_low_temp = tempL(1);
globle_mid_temp = tempL(2);
globle_high_temp = tempL(3);
%step 2:Skip the lines of disclaimer/unwanted lines.
for i=1:3
fgetl(f);
end
%step 3: Create loop for all spicies that calculate data,plot graphs and calculate molecular weight.
for k= 1:4:212
line1 = fgetl(f);%store value of first line in variable.
l = strsplit(line1,' ');%split all line by space
ml = length(l);
spicies = l{1};
low_temp = str2double(l(ml-3));%store the values of local temprature.
high_temp = str2double(l(ml-2));
mid_temp = str2double(l(ml-1));

for
line2 = fgetl(f);%store value of second line in variable.
 a = strfind(line2,'E');%find position of E and create indivisual coefficient.
 a1 = str2double(line2(1 : (a(1) + 3)));
     a2 = str2double(line2((a(1) + 4) : (a(2) + 3)));
     a3 = str2double(line2((a(2) + 4) : (a(3) + 3)));
     a4 = str2double(line2((a(3) + 4) : (a(4) + 3)));
     a5 = str2double(line2((a(4) + 4) : (a(5) + 3)));

line3 = fgetl(f);%store value of third line in variable.
b = strfind(line3,'E');%find position of E and create indivisual coefficient.
a6 = str2double(line3(1:b(1)+3));
a7 = str2double(line3(b(1)+4:b(2)+3));
a8 = str2double(line3(b(2)+4:b(3)+3));
a9 = str2double(line3(b(3)+4:b(4)+3));
a10 = str2double(line3(b(4)+4:b(5)+3));


line4 = fgetl(f);%store value of fourth line in variable.
c = strfind(line4,'E');%find position of E and create indivisual coefficient.
a11 = str2double(line4(1:c(1)+3));
a12 = str2double(line4(c(1)+4:c(2)+3));
a13 = str2double(line4(c(2)+4:c(3)+3));
a14 = str2double(line4(c(3)+4:c(4)+3));

temp_lower =linspace(low_temp,mid_temp,100); %create lower temperature range
temp_higher = linspace(mid_temp,high_temp,100);%create higher temperature range

R = 8.314;%universal gas constant ( J / mol. K)
%step 3.1 : Calculate Cp,H and S.
for j = 1:100

     C_p1(j) = (a8+a9*temp_lower(j)+a10*temp_lower(j)^2+a11*temp_lower(j)^3+a12*temp_lower(j)^4)*R;
       H1(j) = (a8+(a9*temp_lower(j))/2+(a10*temp_lower(j)^2)/3+(a11*temp_lower(j)^3)/4+(a12*temp_lower(j)^4/5)+a13/temp_lower(j))*temp_lower(j)*R;
       S1(j) = (a8*log(temp_lower(j))+a9*temp_lower(j)+(a10*temp_lower(j)^2)/2+(a11*temp_lower(j)^3)/3+(a12*temp_lower(j)^4)/4+a14)*R;
  end
 for
      C_p2(j) = (a1+a2*temp_higher(j)+a3*temp_higher(j)^2+a4*temp_higher(j)^3+a5*temp_higher(j)^4)*R;
      H2(j) = (a1+(a2*temp_higher(j))/2+(a3*temp_higher(j)^2)/3+(a4*temp_higher(j)^3)/4+(a5*temp_higher(j)^4/5)+a6/temp_higher(j))*temp_higher(j)*R;
      S2(j) = (a1*log(temp_higher(j))+a2.*temp_higher(j)+(a3*temp_higher(j)^2)/2+(a4*temp_higher(j)^3)/3+(a5*temp_higher(j)^4)/4+a7)*R;

end
%step 3.2: create folder
nasa_file = spicies;
mkdir(nasa_file)
current_dir = pwd;
cd(nasa_file)

%step 3.3: plot Cp vs temperature
figure(1);
plot(temp_lower,C_p1,'linewidth',2);
hold on
plot(temp_higher,C_p2,'linewidth',2);
hold off
xlabel('Temperature in K');
ylabel('Specific heat (J / mol. K)');
title(['Temperature vs Specific heat for ',spicies]);
legend('Low Temperature','High Temperature');
fig=sprintf('Cp_of_%s.png',spicies);
saveas (gca, fig);

% step 3.4: plot H vs temperature
figure(2);
plot(temp_lower,H1,'linewidth',2);
hold on
plot(temp_higher,H2,'linewidth',2);
hold off
xlabel('Temperature in K');
ylabel('Enthalpy (J)');
title(['Temperature vs Enthalphy for ',spicies]);
legend('Low Temperature','High Temperature');
fig=sprintf('H_of_%s.png',spicies);
saveas (gca, fig);

%step 3.4: plot S vs temperature
figure(3);
plot(temp_lower,S1,'linewidth',2);
hold on
plot(temp_higher,S2,'linewidth',2);
hold off
xlabel('Temperature in K');
ylabel('Entropy (J/K)');
title(['Temperature vs Entropy for ',spicies]);
legend('Low Temperature','High Temperature');
fig=sprintf('S_of_%s.png',spicies);
saveas (gca, fig);
cd(current_dir);
2.Calculate the molecular weight of each species and display it in the command window.
%step : Calculate Molecular weight.
atom = ['H','C','O','N','R','S']; % Atoms available in data file | R stands for Argon
atm_weight = [1.00784 12.0107 15.999 14.0067 39.948 32.065]; % Atomic weight of those Molecules
M_Weight = 0;
current_species =char(spicies); % Converting 1x1 string cells into a character
    for i = 1:length(current_species)
        for j = 1:length(atom)
            if strcmp(current_species(i),atom(j))
                M_Weight = M_Weight +atm_weight(j);%store values if character match.
                position = j ;%store position
            end

        end

        %Used for multiplication into the number of atoms
        n = str2double(current_species(i));
        if n>1
            M_Weight = M_Weight + atm_weight(position)*(n-1);
        end
         %display molecular weight
       fprintf('Molecular Weight of %s : %f u\n',current_species,M_Weight)


    end
COMMAND WINDOW OUTPUT-
Molecular Weight of O2 : 31.998000 u
Molecular Weight of H : 1.007840 u
Molecular Weight of H2 : 2.015680 u
Molecular Weight of OH : 17.006840 u
Molecular Weight of H2O : 18.014680 u
Molecular Weight of HO2 : 33.005840 u
Molecular Weight of H2O2 : 34.013680 u
Molecular Weight of C : 12.010700 u
Molecular Weight of CH : 13.018540 u
Molecular Weight of CH2 : 14.026380 u
Molecular Weight of CH2(S) : 46.091380 u
Molecular Weight of CH3 : 15.034220 u
Molecular Weight of CH4 : 16.042060 u
Molecular Weight of CO : 28.009700 u
Molecular Weight of CO2 : 44.008700 u
Molecular Weight of HCO : 29.017540 u
Molecular Weight of CH2O : 30.025380 u
Molecular Weight of CH2OH : 31.033220 u
Molecular Weight of CH3O : 31.033220 u
Molecular Weight of CH3OH : 32.041060 u
Molecular Weight of C2H : 25.029240 u
Molecular Weight of C2H2 : 26.037080 u
Molecular Weight of C2H3 : 27.044920 u
Molecular Weight of C2H4 : 28.052760 u
Molecular Weight of C2H5 : 29.060600 u
Molecular Weight of C2H6 : 30.068440 u
Molecular Weight of CH2CO : 42.036080 u
Molecular Weight of HCCO : 41.028240 u
Molecular Weight of HCCOH : 42.036080 u
Molecular Weight of H2CN : 28.033080 u
Molecular Weight of HCN : 27.025240 u
Molecular Weight of HNO : 31.013540 u
Molecular Weight of N : 14.006700 u
Molecular Weight of NNH : 29.021240 u
Molecular Weight of N2O : 44.012400 u
Molecular Weight of NH : 15.014540 u
Molecular Weight of NH2 : 16.022380 u
Molecular Weight of NH3 : 17.030220 u
Molecular Weight of NO : 30.005700 u
Molecular Weight of NO2 : 46.004700 u
Molecular Weight of HCNO : 43.024240 u
Molecular Weight of HOCN : 43.024240 u
Molecular Weight of HNCO : 43.024240 u
Molecular Weight of NCO : 42.016400 u
Molecular Weight of CN : 26.017400 u
Molecular Weight of HCNN : 41.031940 u
Molecular Weight of N2 : 28.013400 u
Molecular Weight of AR : 39.948000 u
Molecular Weight of C3H8 : 44.094820 u
Molecular Weight of C3H7 : 43.086980 u
Molecular Weight of CH3CHO : 44.051760 u
Molecular Weight of CH2CHO : 43.043920 u
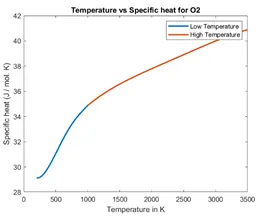
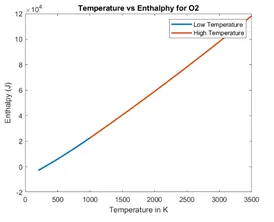
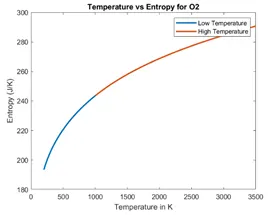
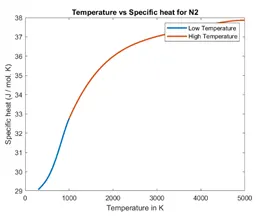
3. Plot the Cp, Enthalpy and Entropy for the local temperature range (low temperature : high temperature) specific for each species.
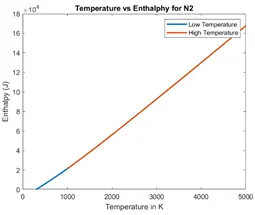
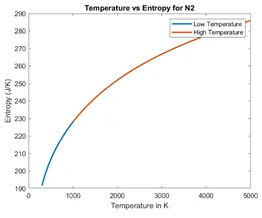
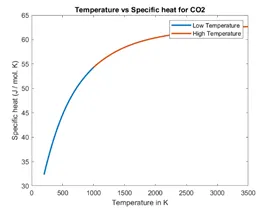
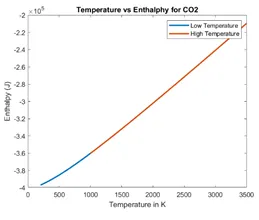
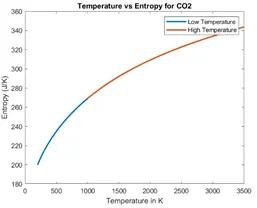
4. Save the plots as images with appropriate names and dump them in separate folders for each species with suitable name. All these should be generated automatically.


CONCLUSION-
The file parsing of NASA thermodynamic data includes several modules & we converted them all into useful form, plotting the relations & saving them automatically into required current location. The different plot for each element shows the relation & trend between thermodynamic properties like Enthalpy, Entropy, Specific heat with respect to temperature.
Application of file parsing-
- Protocols such as HTTP & internet remote function calls.
- Database languages such as SQL.
- Virtual reality modelling language.
- Scripting langauges.
- Object definition and object oriented langauges.
REFERENCE MATERIAL-
https://in.mathworks.com/help/matlab/ref/cd.html
https://in.mathworks.com/matlabcentral/answers/472084-how-to-parse-text-data
https://in.mathworks.com/help/matlab/ref/fgetl.html
https://in.mathworks.com/help/matlab/ref/mkdir.html?searchHighlight=mkdir&s_tid=doc_srchtitle
ERRORS FACED -
There are many small and negligible errors faced (typo mistakes, wrong use of parenthesis & strings,loops) but no major errors faced as such.