Project 1 - Parsing NASA thermodynamic data
AIM
The Project 1 challenge aims to write a program to perform data analysis or parsing of the given Thermo.dat file using MATLAB software.
OBJECTIVE
- Write a function that extracts the 14 coefficients and calculates the enthalpy, entropy, and specific heats for all the species in the data file. You will be reading the file NASA thermodynamic data. (Use local temperature only)
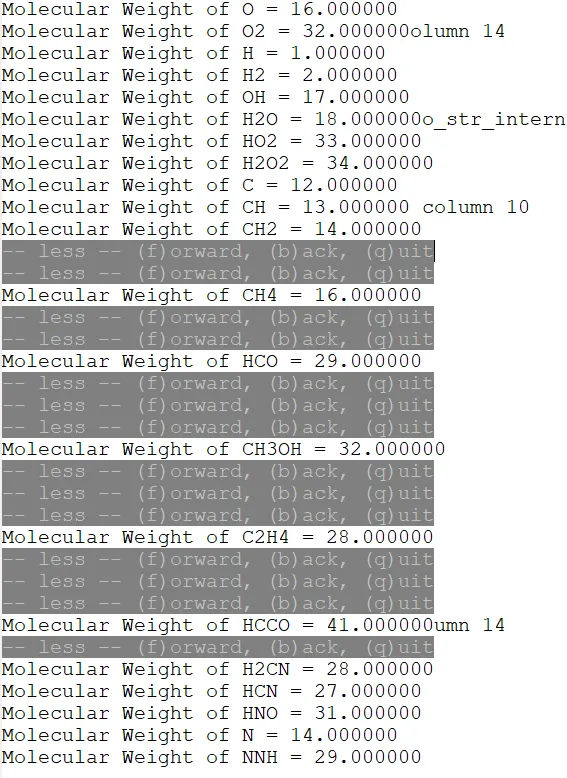
- Calculate the molecular weight of each species and display it on the command window.
-
Plot the Specific heat, Enthalpy, and Entropy for the local temperature ranges.
-
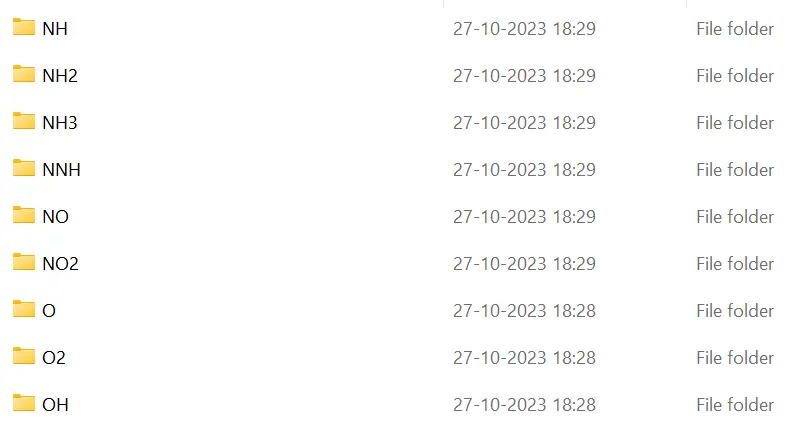
Save the plot as images with appropriate names and dump them in separate folders for each species with a suitable name. All should be generated automatically.
- The main program that you will submit will just take the THERMO.dat file as input and generate Cp, H, and S plots.
- Present the logic as a report.
THEORY AND GOVERNING EQUATIONS
Data analysis is a process of inspecting, cleansing, transforming, and modeling data to discover useful information, inform conclusions, and support decision-making. Data analysis has multiple facets and approaches, encompassing diverse techniques under a variety of names, and is used in different business, science, and social science domains. In today's business world, data analysis plays a role in making decisions more scientific and helping businesses operate more effectively.
CODE
For Specific Heat, Enthaply, Entropy, and Molecular weight 4 functions are made for the respective calculations. The required inputs such as coefficients, temperature, and Constant value are passed to the specific heat, enthalpy, and entropy, and molecular weight names of species are passed on.
In the main code, the value for R is defined. The data file is opened with the command [f1=fopen('filename', 'r')]. The first and second lines of the file are read by [line_1 = fgetl(f1)] and the same for line_2. The unwanted lines are committed by [fgetl(f1);].The looping is carried out for the 53 species with iteration i from 1:53.
In order to read the local temperature for each species iteration the following line is read by the command [tline = fgetl(f1)]. The local temperature is split into cell arrays by [A=strsplit(tline,' ')]. The name of the species is assigned with the value of each species by [name_of_species = A{1}].
The local, mid, and high temperatures are extracted and converted to a number from string by [local_low_temperature=str2double(A{end-3}), where 3 shows the position from the end position, local_mid_temperature=str2double(A{end-1}, local_high_temperature=str2double(A{end-2})]. The temperature values are defined as a linspace array from low to high-temperature values with 1000 elements in it.
The 14 coefficients are in 3 lines with the 1st and 2nd lines having 5 coefficients each with the 3rd line last 4 ones. The commands for them are[tline_4 = fgetl(f1) for 5 and 6 also]. The coefficients are split wtr E by [a = strfind(tline_4, 'E')] the same for the 5th and 6th lines with b and c ].
The functions for Molecular Weight, Heat, Enthalpy, and Entropy are called for their respective calculations. The folder for species is defined by the command[cd(location of the folder where the project is saved in the computer), mkdir(name_of_species); directory is made for the species individually].
The plots for specific heat, enthalpy, and entropy are made in a V/S temperature array. Each plot is saved in the species directory by the command[saveas(figure(1), 'Specific_Heat.jpg')]. The program is saved by[cd(location of the code)].
FUNCTION CODES FOR MOLECULAR WEIGHT, SPECIFIC HEAT, ENTHALPY, AND ENTROPY AND THE MAIN PROGRAM
%the value of the Molar Gas Constant
R = 8.314;
%opening the given data file
f1 = fopen('THERMO.dat','r');
%reading the ist and 2nd line of the data file
line_1 = fgetl(f1);
line_2 = fgetl(f1);
%skipping unwanted data
fgetl(f1);
fgetl(f1);
fgetl(f1);

%looping for the given species
for i = 1:53
    %reading the local temperature data line
    tline = fgetl(f1);
    %splitting the local temperature data line
    A = strsplit(tline,' ');
    %assigning the species to the variable wrt the position of it in the
    %line
    name_of_species = A{1};
    %extracting the local low,mid and high temperatures and converting them
    %to a number from string
    local_low_temperature  = str2double(A{end-3});
    local_mid_temperature  = str2double(A{end-1});
    local_high_temperature = str2double(A{end-2});
    %the values of temperatures are defined in the form of the linspace
    %array T
    T = linspace(local_low_temperature,local_high_temperature,1000);

    %reading the first 5 coefficents on the respective line
    tline_4 = fgetl(f1);
    %spliiting coefficients wtr E
    a  = strfind(tline_4,'E');
    a1 = str2double(tline_4(1:a(1)+3));
    a2 = str2double(tline_4(a(1)+4:a(2)+3));
    a3 = str2double(tline_4(a(2)+4:a(3)+3));
    a4 = str2double(tline_4(a(3)+4:a(4)+3));
    a5 = str2double(tline_4(a(4)+4:a(5)+3));

    %reading the next 5 coefficeints on the respective line
    tline_5 = fgetl(f1);
    %splitting the coefficeint wrt E
    b   = strfind(tline_5,'E');
    a6  = str2double(tline_5(1:b(1)+3));
    a7  = str2double(tline_5(b(1)+4:b(2)+3));
    a8  = str2double(tline_5(b(2)+4:b(3)+3));
    a9  = str2double(tline_5(b(3)+4:b(4)+3));
    a10 = str2double(tline_5(b(4)+4:b(5)+3));

    %reading the last 4 coefficents on the respective line
    tline_6 = fgetl(f1);
    %splittiing wrt E
    c   = strfind(tline_6,'E');
    a11 = str2double(tline_6(1:c(1)+3));
    a12 = str2double(tline_6(c(1)+4:c(2)+3));
    a13 = str2double(tline_6(c(2)+4:c(3)+3));
    a14 = str2double(tline_6(c(3)+4:c(4)+3));

    %calling the function for calculating specific heat, enthalpy and
    %entropy
    Cp = Specific_Heat(a1,a2,a3,a4,a5,a8,a9,a10,a11,a12,R,T,local_low_temperature,local_mid_temperature,local_high_temperature);
    H  = Specific_Enthalpy(a1,a2,a3,a4,a5,a6,a8,a9,a10,a11,a12,a13,R,T,local_low_temperature,local_mid_temperature,local_high_temperature);
    S  = Specific_Entropy(a1,a2,a3,a4,a5,a7,a8,a9,a10,a11,a12,a14,R,T,local_low_temperature,local_mid_temperature,local_high_temperature);

    %calling the function for calculating molecular weight of species
    molecular_weight = weight(name_of_species);
    fprintf('Molecular Weight of %s = %f\n',name_of_species,molecular_weight);

    %creating the folder
    cd('C:\Users\User\Documents\Mat Lab for Mech Engineers\project 1');
    mkdir(name_of_species);
    cd(name_of_species);

    %plot for Specific Heat
    figure(1);
    plot(T,Cp,'linewidth',2,'color','r');
    xlabel('Temperature (K)');
    ylabel('Specific Heat (KJ)');
    title(sprintf('Specific Heat (Cp) V/S Temeperature (T) plot of %s',name_of_species));
    grid on;
    saveas(figure(1),'Specific_Heat.jpg');

    %plot for Specific Enthalpy
    figure(2);
    plot(T,H,'linewidth',2,'color','y');
    xlabel('Temperature (K)');
    ylabel('Specific Enthalpy (KJ/mol-K)');
    title(sprintf('Specific Enthalpy (H) V/S Temperature (K) plot of %s',name_of_species));
    grid on;
    saveas(figure(2),'Specific_Enthalpy.jpg');

    %plot for Specific Entropy
    figure(3);
    plot(T,S,'linewidth',2,'color','g');
    xlabel('Temprature (K)');
    ylabel('Specific Entropy (KJ/mol-K)');
    title(sprintf('Specific Entropy (S) V/S Temperature (K) plot of %s',name_of_species));
    grid on;
    saveas(figure(3),'Specific_Entropy.jpg');

    cd('C:\Users\User\Documents\Mat Lab for Mech Engineers\project 1');
end
function [molecular_weight] = weight(name_of_species)
elements = ['O','H','C','N','A','S'];
atomic_weight = [16,1,12,14,40,32];
name_of_species = upper(name_of_species);
molecular_weight = 0;
for i = 1:length(name_of_species)
    for j = 1:length(elements)
        if strcmp(name_of_species(i),elements(j));
            molecular_weight = molecular_weight+atomic_weight(j);
            k = j;
        else
            n = str2double(name_of_species(i));
            if n>1;
                molecular_weight = molecular_weight + atomic_weight(k)*(n-1);
                break
            end
        end
    end
end
function Cp = Specific_Heat(a1,a2,a3,a4,a5,a8,a9,a10,a11,a12,R,T,low,mid,high)

for i = 1:length(T)
    if T(i)>= mid
        Cp(i) = (a1 + (a2.*T(i)) + (a3.*((T(i))^2)) + (a4.*((T(i))^3)) + (a5.*((T(i))^4))).*R;
    else
        Cp(i) = (a8 + (a9.*T(i)) + (a10.*((T(i))^2)) + (a11.*((T(i))^3)) + (a12.*((T(i))^4))).*R;
    end
end
function H = Specific_Enthalpy(a1,a2,a3,a4,a5,a6,a8,a9,a10,a11,a12,a13,R,T,low,mid,high)

for i = 1:length(T)
    if T(i)>= mid
        H(i) = (a1 + (a2.*(T(i)./2)) + ((a3.*(T(i)^2))./3) + ((a4.*(T(i)^3))./4) + (a5.*((T(i))^4)) + (a6./T(i))).*R;
    else
        H(i) = (a8 + (a9.*(T(i)./2)) + ((a10.*(T(i)^2))./3) + ((a11.*(T(i)^3))./4) + (a12.*((T(i))^4)) + (a13./T(i))).*R;
    end
end
function S = Specific_Entropy(a1,a2,a3,a4,a5,a7,a8,a9,a10,a11,a12,a14,R,T,low,mid,high)

for i = 1:length(T)
    if T(i)>= mid
        S(i) = ((a1.*log(T(i))) + (a2.*T(i)) + ((a3.*((T(i))^2))./2 )+ ((a4.*((T(i))^3))./3) + ((a5.*((T(i))^4))./4) +a7).*R;
    else
        S(i) = ((a8.*log(T(i))) + (a9.*T(i)) + ((a10.*((T(i))^2))./2 )+ ((a11.*((T(i))^3))./3) + ((a12.*((T(i))^4))./4) +a14).*R;
    end
end
FILE LOCATIONS OF THE SPECIES GRAPHS



No errors were found.
OUTPUT FOR MOLECULAR WEIGHT