Project 1 - Parsing NASA thermodynamic data
AIM:- Write a code in Matlab to parse the NASA thermodynamic data file and then calculate the thermodynamic properties of various gas species.
OBJECTIVE:-
- Write a function that extracts the 14 coefficients and calculates the enthalpy, entropy, and specific heats for all the species in the data file.
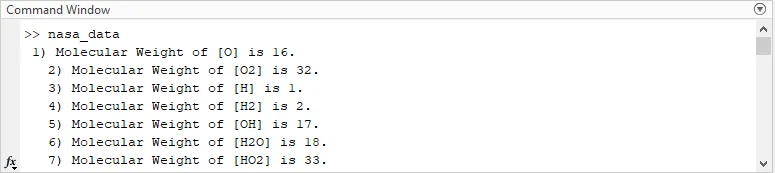
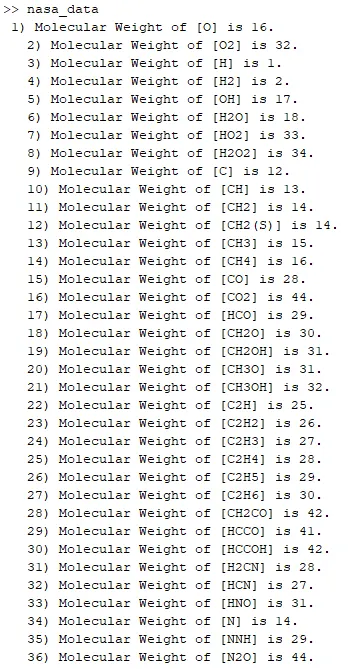
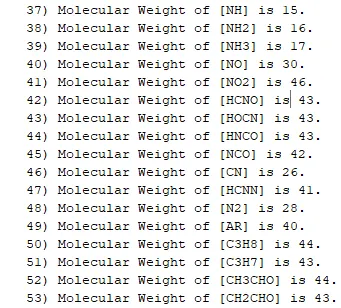
- Calculate the molecular weight of each species and display it in the command window.
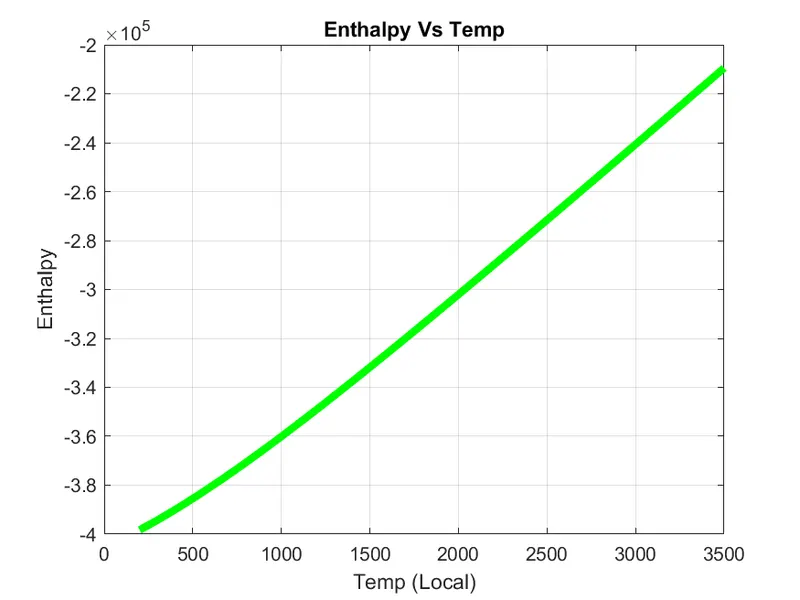
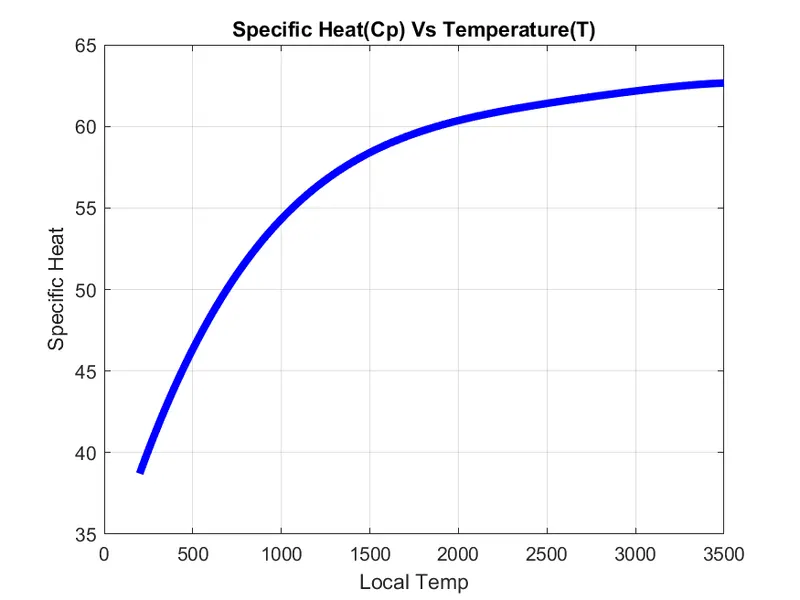
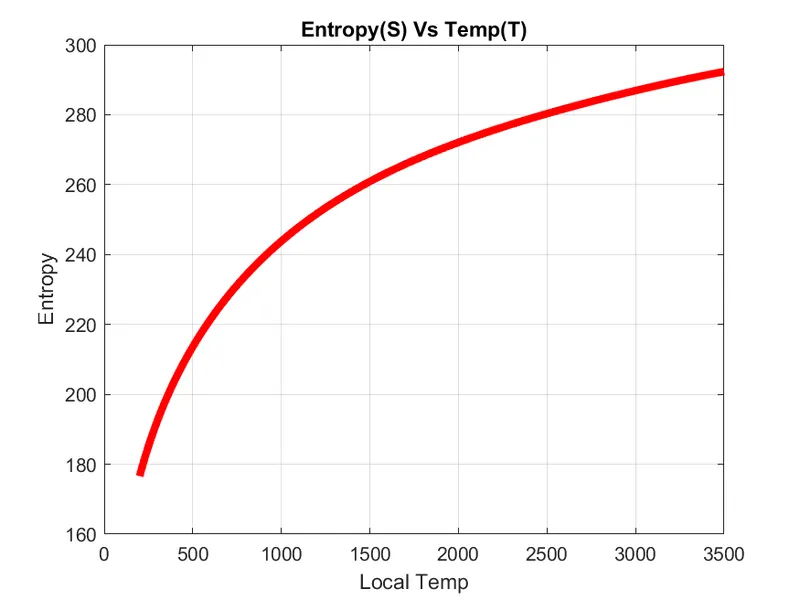
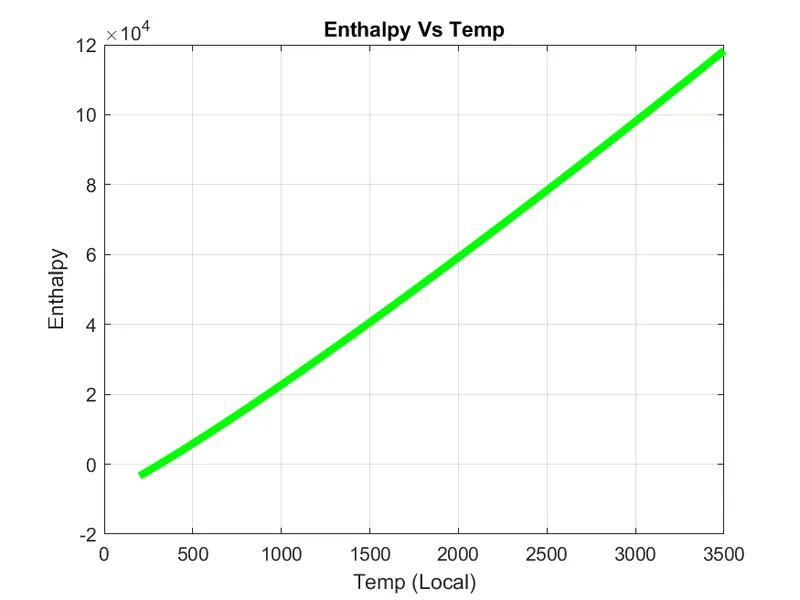
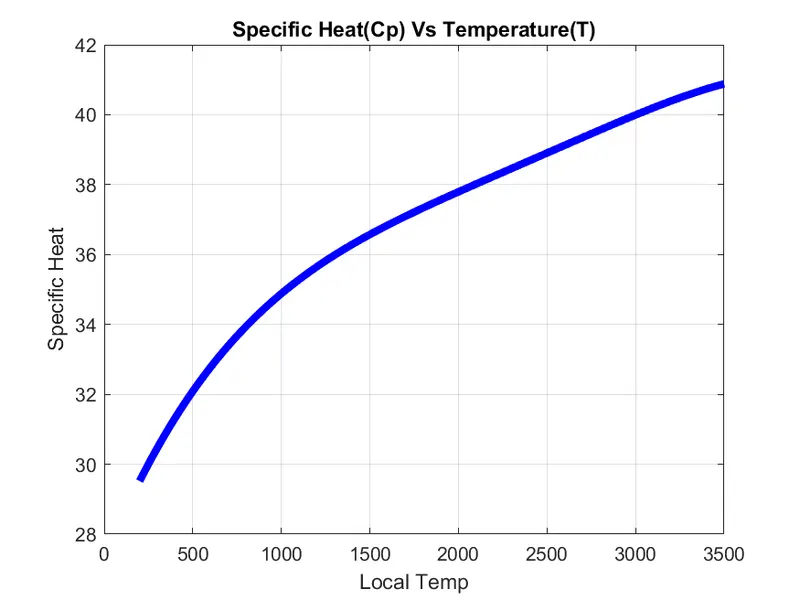
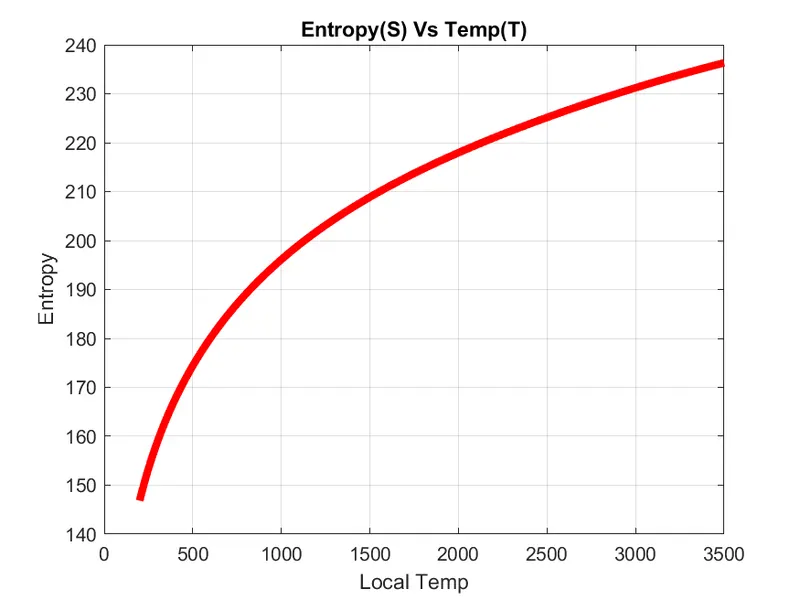
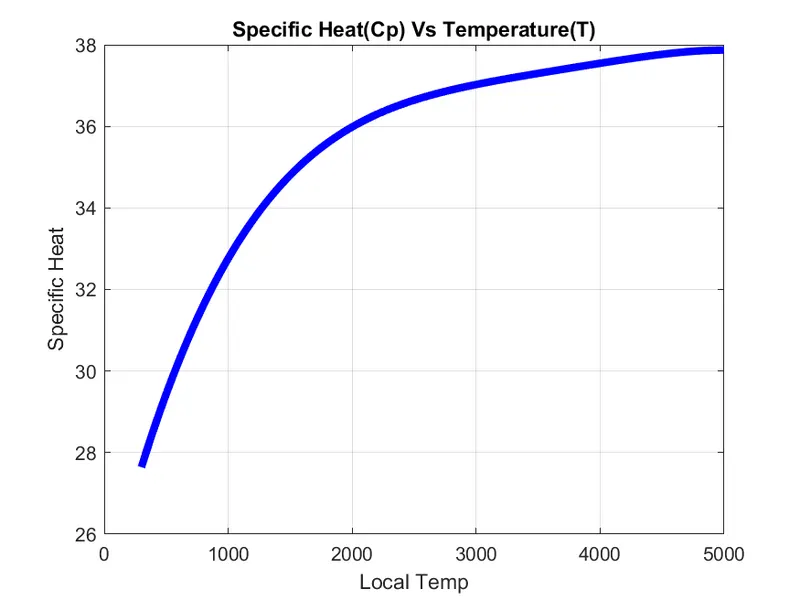
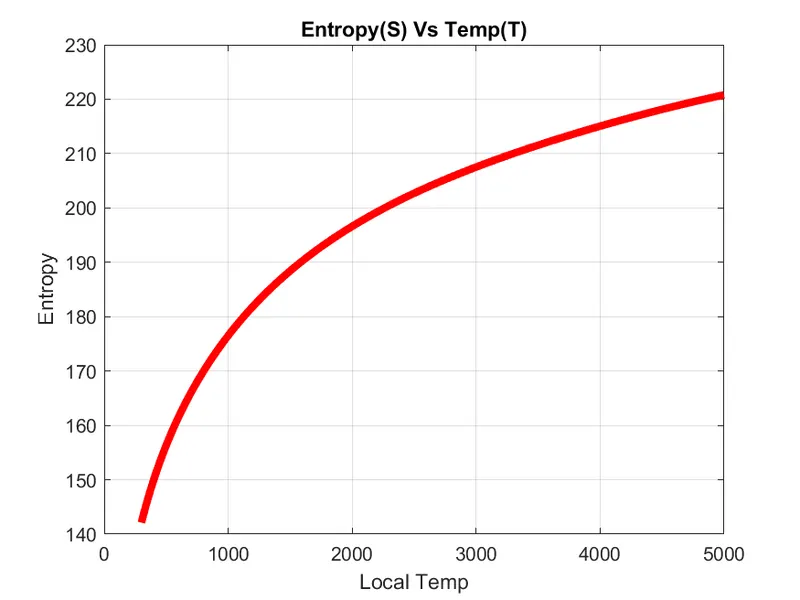
- Plot the Cp, Enthalpy, and Entropy for the local temperature range (low temperature: high temperature) specific for each species.
- Save the plots as images with appropriate names and dump them in separate folders for each species with a suitable name. All these should be generated automatically.
- The main program that you will submit will just take the "THERMO.dat" file as an input and generate Cp, H, and S plots.
- Screenshot of the window where all the folders are saved.
- Plots for o2, N2, and Co2 species.
THEORY:-
File parsing: File parsing is the process of analyzing a string symbol in natural language computer languages or data structures, conforming to the rules of formal grammar. The term parsing comes from Latin pars(orationis), meaning part (of speech). Within computational linguistics the term is used to refer to the formal analysis by a computer of a sentence or other string of words into its constituents, resulting in a parse tree showing their syntactic relation to each other, which may also contain semantic and other information. Some parsing algorithms may generate a parse forest or list of parse trees for a syntactically ambiguous input.
Parsing a file means reading in a data stream of some sort and building an in-memory model of the semantic content of that data. This aims at facilitating performing some kind of transformation on the data. This aims at facilitating performing some kind of transformation on the data.
Enthalpy: Enthalpy is a thermodynamic property of a system. It is the sum of the internal energy added to the product of the pressure and volume of the system. It reflects the capacity to do non-mechanical work and the capacity to release heat.

Entropy: Enthalpy, a property of a thermodynamic system, is equal to the system's internal energy plus the product of its pressure and volume. In a system contained so as to prevent the mass transfer, for processes at constant pressure, the heat absorbed or released equals the change in enthalpy.

Specific heat: Specific heat is the ratio of the quantity of heat required to raise the temperature of a body by 1 degree to that required to raise the temperature of an equal mass of water by one degree.

Main code:
% Program for Parsing NASA thermodynamic data
% For opening the data file & set to read mode
file = fopen('THERMO.dat','r');

% To read the Header line(file name)
file_name = fgetl(file) ;

% To read the 1st line after Header
first_line = fgetl(file) ;


% To extract temp from 1st line
Global_Temp_Range=strsplit(first_line,' ');

% To get the Global low temperature
G_low_T = str2num(Global_Temp_Range{2});

% To get the Global mid temperature
G_mid_T = str2num(Global_Temp_Range{3});

% To get the Global high temperature
G_high_T = str2num(Global_Temp_Range{4});

for i= 1:3
a= fgetl(file) ; % To read the next 3 lines after first line

end


for j= 1:53

%To read 1st line of species,as ranked 1 on RHS of data file
line_1 = fgetl(file);

% To split 1st line
L1 = strsplit(line_1,' ');

% To extract Species from 1st line
species = (L1{1});

% To find the position of G in 1st line
G = strfind(line_1,'G ');

% To extract LOCAL Low Temperature
L_low_T = str2num(line_1(G+3:G+10));

% To extract LOCAL High Temperature
L_high_T = str2num(line_1(G+12:G+20));

% To extract LOCAL Midium Temperature
L_mid_T = str2num(line_1(G+22:G+30));

% To set a range of Local Temperature
T = linspace(L_low_T,L_high_T,500);

%To read 2nd line of species,as ranked 2 on RHS of data file
line_2 = fgetl(file);

% To find the position of E in 2nd line
L2 = strfind(line_2,'E');

% To extract 1st coefficient for High Temperature
A1 = str2num(line_2(1:L2(1)+3));

% To extract 2nd coefficient for High Temperature
A2 = str2num (line_2(L2(1)+4:L2(2)+3));

% To extract 3rd coefficient for High Temperature
A3 = str2num (line_2(L2(2)+4:L2(3)+3));

% To extract 4th coefficient for High Temperature
A4 = str2num (line_2(L2(3)+4:L2(4)+3));

% To extract 5th coefficient for High Temperature
A5 = str2num (line_2(L2(4)+4:L2(5)+3));

%To read 3rd line of species,as ranked 3 on RHS of data file
line_3 = fgetl(file);

% To find the position of E in 3rd line
L3 = strfind(line_3,'E');

% To extract 6th coefficient for High Temperature
A6 = str2num(line_3(1:L3(1)+3));

% To extract 7th coefficient for High Temperature
A7 = str2num (line_2(L3(1)+4:L3(2)+3));

% To extract 1st coefficient for Low Temperature
a1 = str2num (line_2(L3(2)+4:L3(3)+3));

% To extract 2nd coefficient for Low Temperature
a2 = str2num (line_2(L3(3)+4:L3(4)+3));

% To extract 3rd coefficient for Low Temperature
a3 = str2num (line_2(L3(4)+4:L3(5)+3));

%To read 4th line of species as ranked 4 on RHS of data file
line_4 = fgetl(file);

% To find the position of E in 4th line
L4 = strfind(line_4,'E');

% To extract 4th coefficient for Low Temperature
a4 = str2num(line_4(1:L4(1)+3));

% To extract 5th coefficient for Low Temperature
a5 = str2num (line_4(L4(1)+4:L4(2)+3));

% To extract 6th coefficient for Low Temperature
a6 = str2num (line_4(L4(2)+4:L4(3)+3));

% To extract 7th coefficient for Low Temperature
a7 = str2num (line_4(L4(3)+4:L4(4)+3));


% Function To Calculate Cp,Enthalpy and Entropy
[Cp,H,S] = func(A1,A2,A3,A4,A5,A6,A7,a1,a2,a3,a4,a5,a6,a7,T,G_mid_T);

% To creat Folders with species name
% To give Folder names
Folder_name = sprintf('%d) [%s]',j, species);

% To specify the current directory
current_dir = pwd;

% All The Function Program And Thermodynamic Data file are stored in a folder,that specify current
% To creat a Folder
mkdir(Folder_name);

% To load plots in that new folder
cd(Folder_name);

figure (1);
plot(T,Cp,'b','linewidth',4)
grid on
xlabel('Local Temp');
ylabel('Specific Heat')
title('Specific Heat(Cp) Vs Temperature(T)')

% To give a name of the file
IMAGE1 = sprintf("Cp Vs T of [%s].png",species);

% To save the image file
saveas(gca,IMAGE1)
figure (2);
plot(T,H,'g','linewidth',4)
grid on
xlabel('Temp (Local)');
ylabel('Enthalpy')
title('Enthalpy Vs Temp')

% To give a name of the file
IMAGE2 = sprintf(" H Vs T of [%s].png",species);

% To save the image file
saveas(gca,IMAGE2)
figure (3);
plot(T,S,'r','linewidth',4)
grid on
xlabel('Local Temp');
ylabel('Entropy')
title('Entropy(S) Vs Temp(T)')

% To give a name of the file
IMAGE3 = sprintf("S Vs T of [%s].png",species);

% To save the image file
saveas(gca,IMAGE3)

% To give a path,return to current directory
cd(current_dir);

% Function To Calculate Molecular Weight
MW = mol_wt(species);

% To display as output
fprintf(' %d) Molecular Weight of [%s] is %d.',j,species,MW)

% To set the next output after 2 line interval
fprintf('  ')


end
Molecular weight code:
% Function for callculation of Molecular Weight
function MW= mol_wt(species)
atoms={'H','C','N','O','A'};
% H=Hydrogen(1), C=Carbon(12), N=Nitrogen(14), O=Oxygen(16), A=Argon(40)
atomic_weight=[1 12 14 16 40];

MW=0;
for i=1:length(species)

for j=1:length(atomic_weight)

% for comparing atoms of the species with atoms
if (strcmp(species(i),atoms(j))==1)

MW = MW + atomic_weight(j);

% to find the position of atoms in the species
rank=j;

end
end


% For the weights of the repeating atoms
m=str2num(species(i));
if m>1
n=m-1;
MW=MW+atomic_weight(rank)*(n);
end
end
end
Function for calculating Cp, S, H code:
% Function for Calculation of Cp,Entropy & Enthalpy
% for the local temp range, specific for each species

function [ Cp H S ]=func(A1,A2,A3,A4,A5,A6,A7,a1,a2,a3,a4,a5,a6,a7,T,G_mid_T)
% T = Temp. Range
% Cp = Specific Heat of species at constant Pressure
% H = Enthalpy
% G_mid_T = Global Mid Temp.
% S = Entropy

% R = Gas Constant
R = 8.314;


for q = 1: length(T)
if T(q) >= G_mid_T
Cp = (A1+ (A2.*T) + (A3.*T.^2) + (A4.*T.^3) + (A5.*T.^4)) * R ;
H = (A1+(A2.*(T./2))+(A3.*(T.^2)./3)+(A4.*(T.^3)./4)+(A5.*(T.^4)./5)+(A6./T)).*(T.*R);
S = ((A1.* log(T))+(A2.*T)+(A3.*T.^2)+(A4.*T.^3)+(A5.*T.^4)+A7)* R ;
else
Cp =(a1+ (a2.*T) + (a3.*T.^2) + (a4.*T.^3) + (a5.*T.^4)) * R ;
H = (a1+(a2.*(T./2))+(a3.*(T.^2)./3)+(a4.*(T.^3)./4)+(a5.*(T.^4)./5)+(a6./T)).*(T.*R);
S = ((a1 *log(T))+(a2.*T)+(a3 *T.^2)+(a4.*T.^3)+(a5.*T.^4)+a7)* R ;
end

end
Explanation of code:
- The first step is to clear all, close all, clc. The clear all command helps to clear the workspace. The close all command closes all figures and the clc command clears the command window.
- The fopen command is used in reading mode to read the THERMO.dat file.
- The temperature values are calculated by using strsplit,str2num commands.
- Then the comment lines are stored in three variables i.e., line3, line4, line5.
- The for loop is used to create an array that contains every line of the file.
- Then the coefficients are founded by using the findstr, str2num.
- Then the directory is created to save the plots in png format with the species name.
- The cp, h, s functions are called to the main program which has been created separate script.
- Then the plots are created between temperature and cp, s, h.
- The saves are used to save the plots in png extension.
- Finally, the mol_wt function is called for calculating the molecular weight of the species.
- The fclose command is used to end the reading of the file.
Molecular weight command window:-
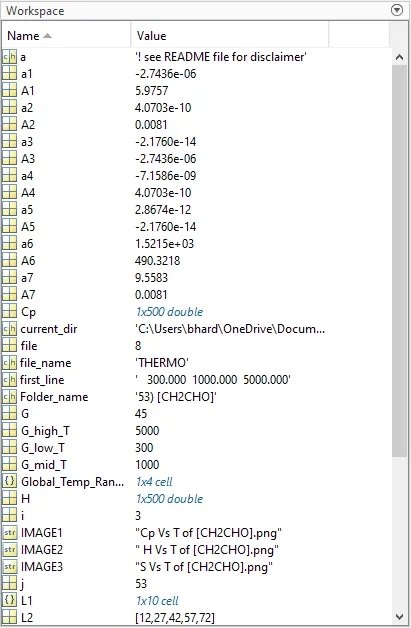
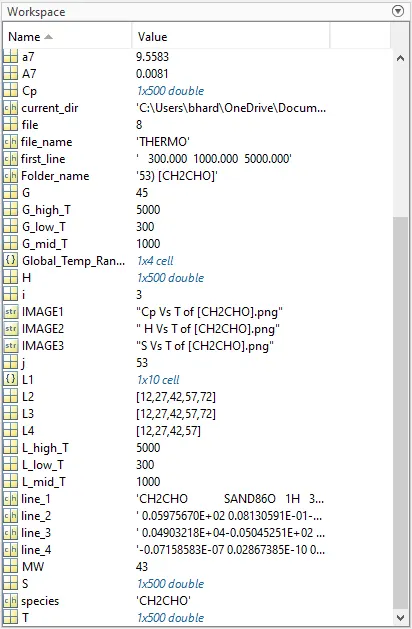
Workspace:-
PLOT for O2
PLOT of N2
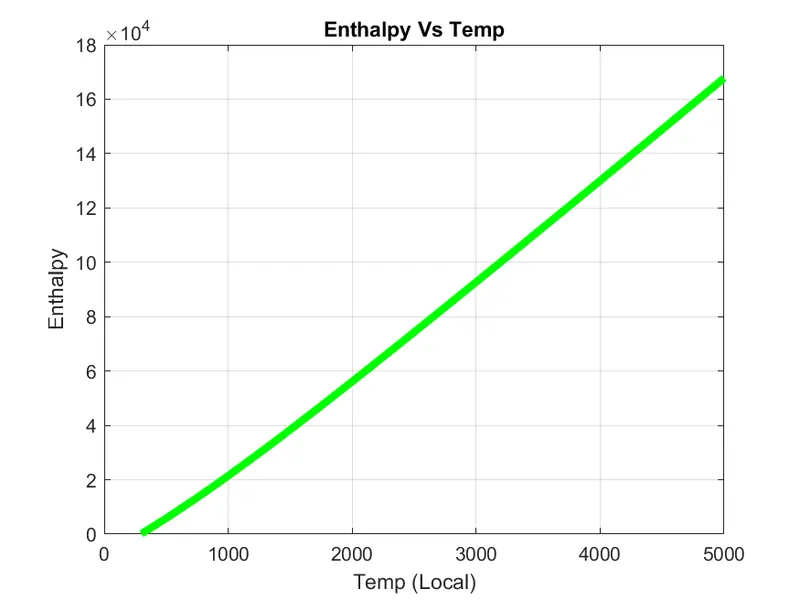
PLOT of CO2