Project 1 - Parsing NASA thermodynamic data
AIM:- Write a code in Matlab to parse the NASA thermodynamic data file and then calculate thermodynamic properties of various gas species.
OBJECTIVE:-
- Write a function that extracts the 14 co-efficients and calculates the enthalpy, entropy and specific heats for all the species in the data file.
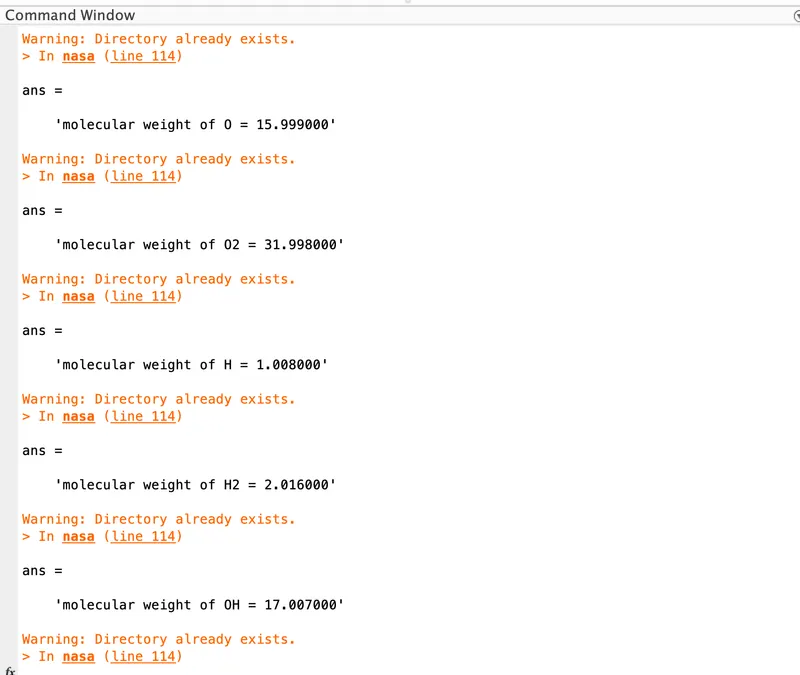
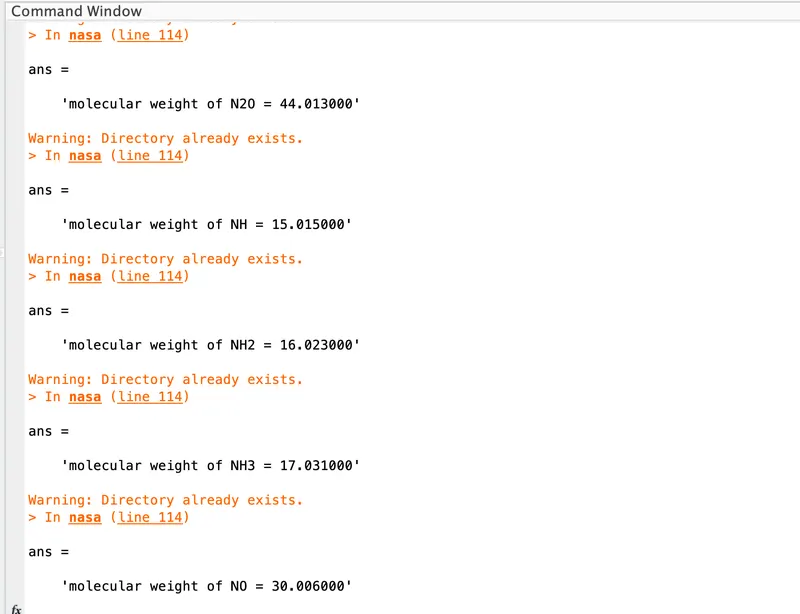
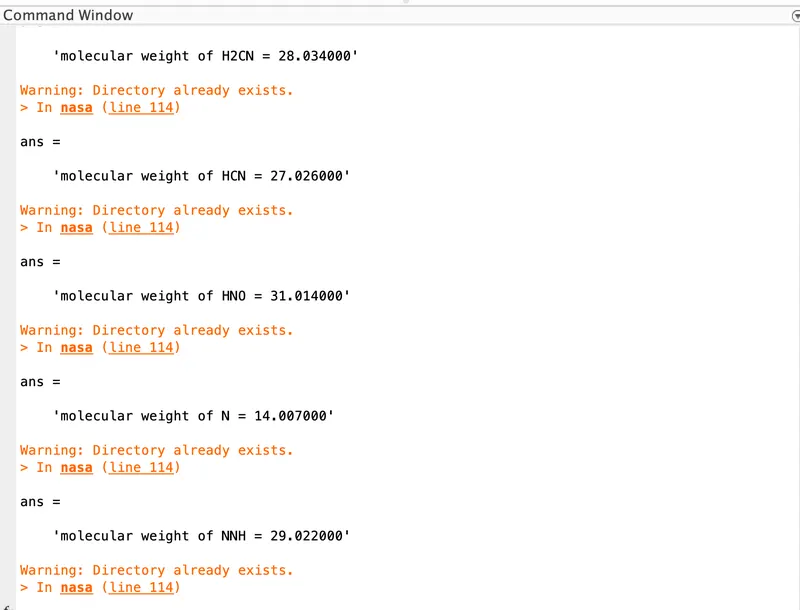
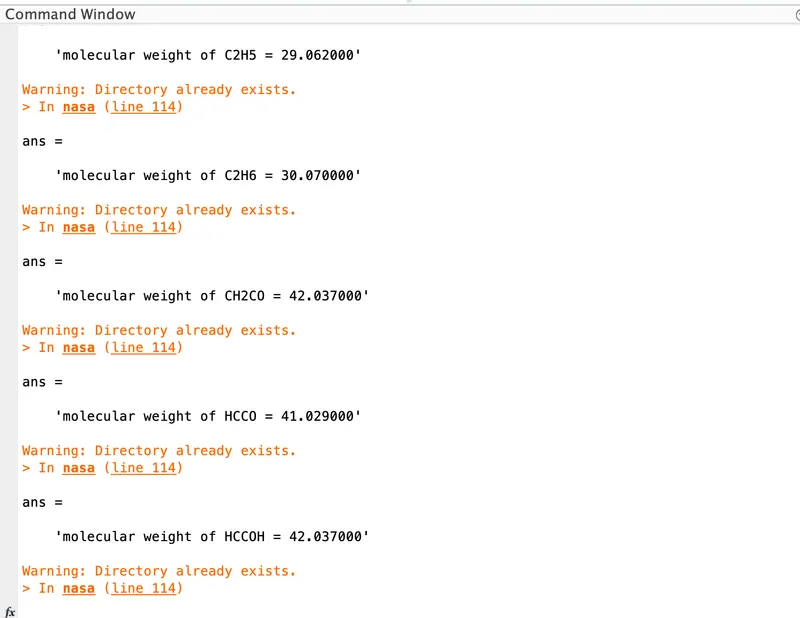
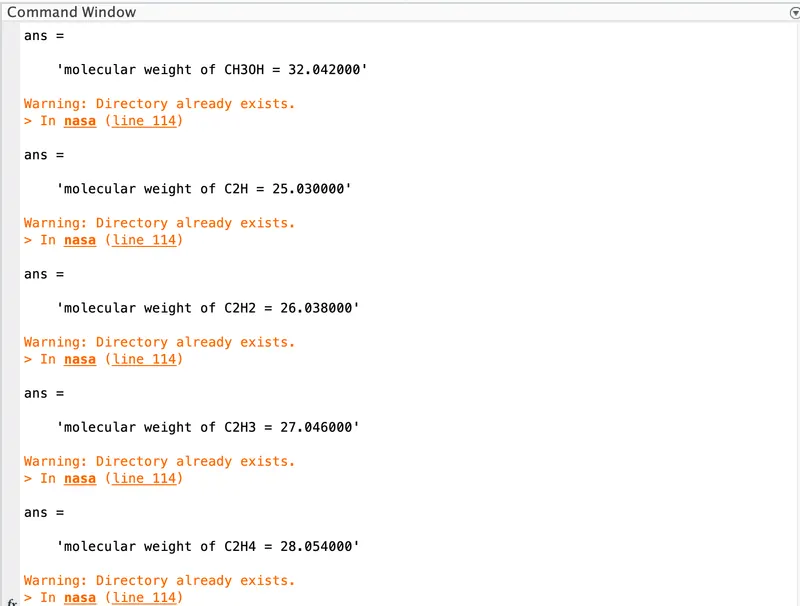
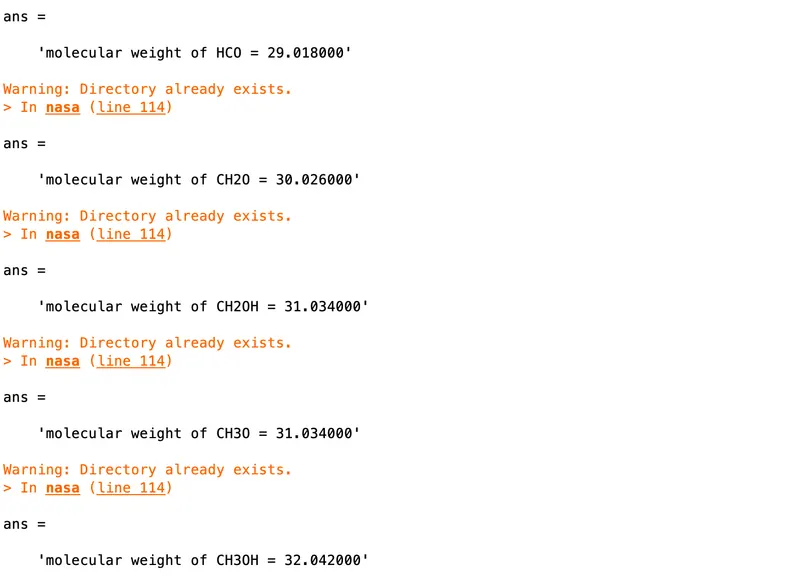
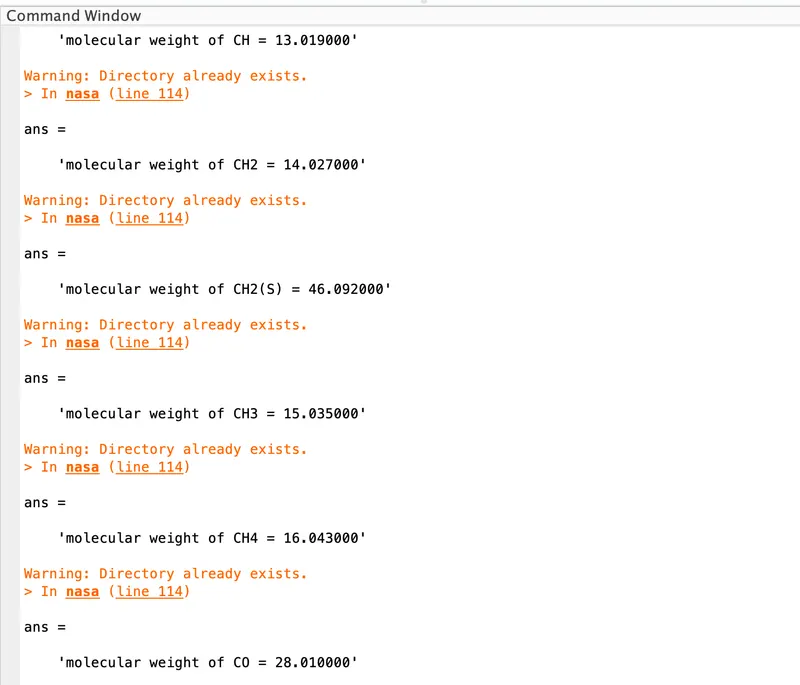
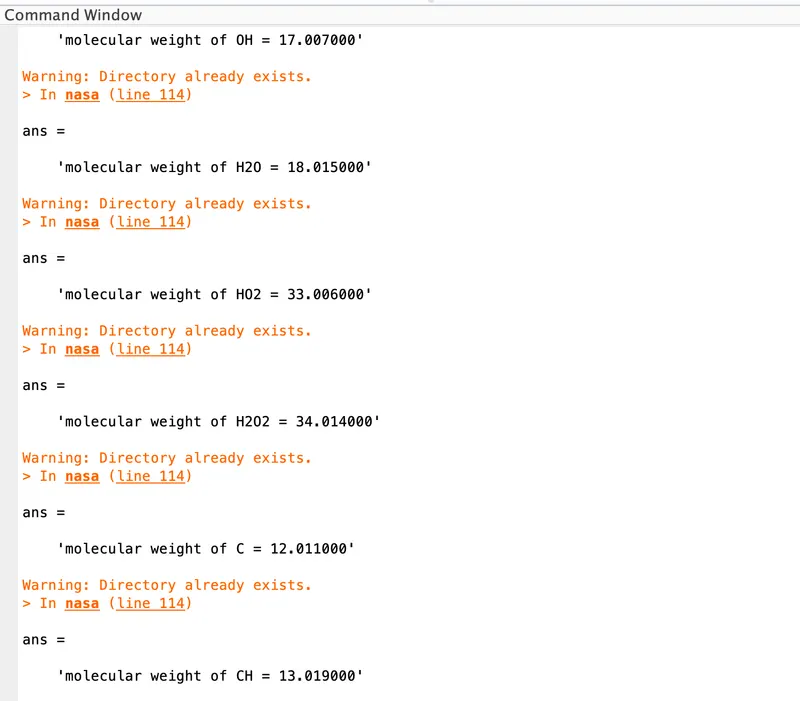
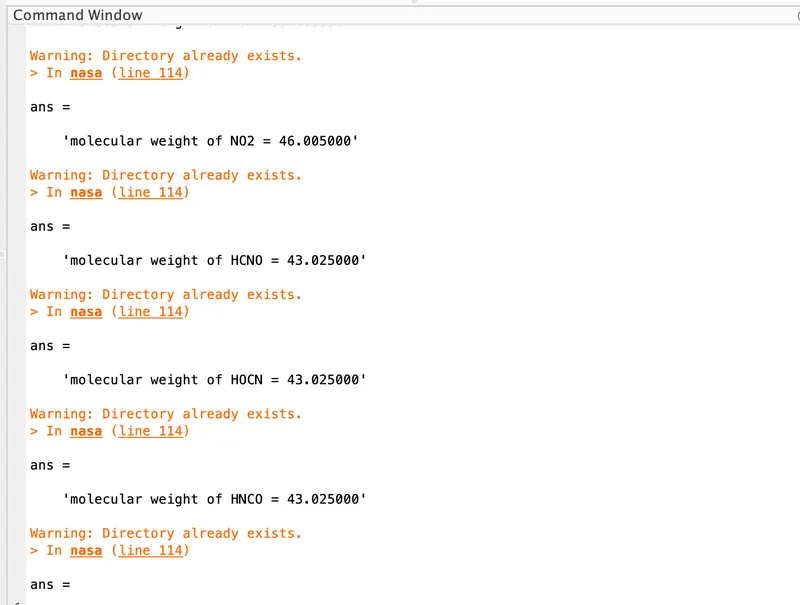
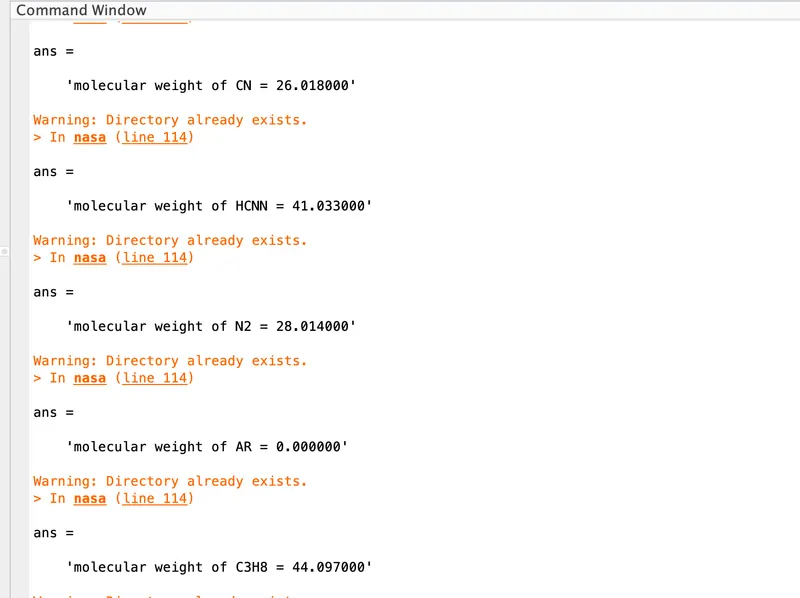
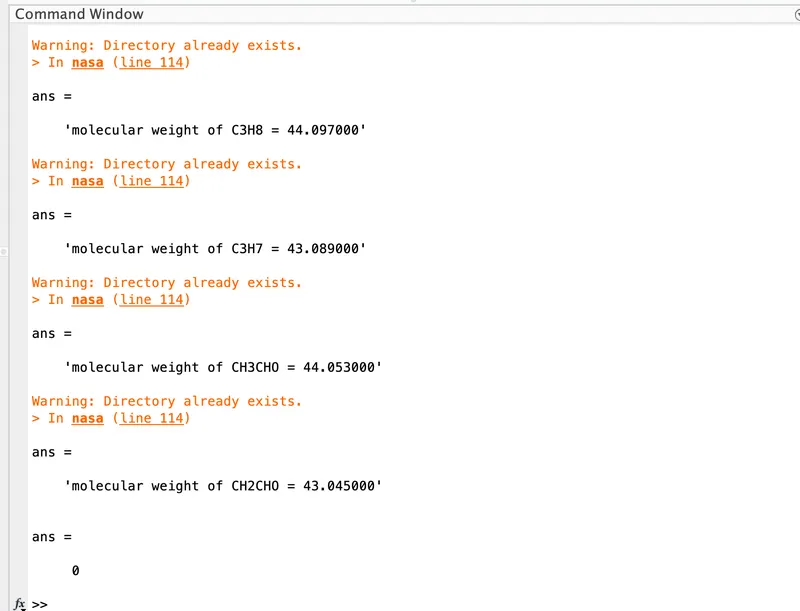
- Calculate the molecular weight of each species and display it in the command window.
- Plot the Cp, Enthalpy and Entropy for the local temperature range (low temperature : high temperature) specific for each species.
- Save the plots as images with appropriate names and dump them in separate folders for each species with suitable name. All these should be generated automatically.
- The main program that you will submit will just take the "THERMO.dat" file as an input and generate Cp, H and S plots.
- Screenshot of the window where all the folders are saved.
- Plots for o2, N2 and Co2 species.
CONCEPTS-
File Parsing:
File parsing refers to examining a file.Using file parsing, data can be extracted from the file which can be stored and be used to perform calculations.Here a thermodynamics file generated by NASA is parsed.From which the high temperature and low temperature of various species are extracted and are further stored to calculate the Specific Heat(C_p),Enthalpy(H) and Entropy(S).
Entropy: -
Entropy is a scientific concept, as well as a measurable physical property that is most commonly associated with a state of disorder, randomness, or uncertainty.
CODE for the Entropy function: -
function[S]= Entropy(a1,a2,a3,a4,a5,a7,a8,a9,a10,a11,a12,a14,temp,temp_range,R)

    %a1 a2 a3 a4 a5 are high temperature coefficients
    %a8 a9 a10 a11 a12 are low temperature coefficients

    for i= 1:length(temp_range)
        if temp_range(i)<=temp(2)
            S(i)= R.*((a8*log(temp_range(i))) + (a9*temp_range(i)) + (a10*((temp_range(i).^2)/2)) + (a11*((temp_range(i).^3)/3)) + (a12*((temp_range(i).^4)/4)) + a14);

        else
            S(i)= R.*((a1*log(temp_range(i))) + (a2*temp_range(i)) + (a3*((temp_range(i).^2)/2)) + (a4*((temp_range(i).^3)/3)) + (a5*((temp_range(i).^4)/4)) + a7);

        end
end
Enthalpy: -
is a property of a thermodynamic system, defined as the sum of the system's internal energy and the product of its pressure and volume.It is a convenient state function standardly used in many measurements in chemical, biological, and physical systems at a constant pressure.
CODE for the Entropy function: -
function[H]= Enthalpy(a1,a2,a3,a4,a5,a6,a8,a9,a10,a11,a12,a13,temp,temp_range,R)
    %a1 a2 a3 a4 a5 are high temperature coefficients
    %a8 a9 a10 a11 a12 are low temperature coefficients

    for i= 1:length(temp_range)
        if temp_range(i)<=temp(2)
            H(i)= R*((a8*temp_range(i)) + (a9*((temp_range(i).^2)/2)) + (a10*((temp_range(i).^3)/3)) + (a11*((temp_range(i).^4)/4)) + (a12*((temp_range(i).^5)/5)) + a13);

        else
            H(i)= R*((a1*temp_range(i)) + (a2*((temp_range(i).^2)/2)) + (a3*((temp_range(i).^3)/3)) + (a4*((temp_range(i).^4)/4)) + (a5*((temp_range(i).^5)/5)) + a6);
        end
end
Specific Heat(Cp): -
In thermodynamics, the specific heat capacity (Cp) of a substance is the heat capacity of a sample of the substance divided by the mass of the sample.
CODE for the Entropy function: -
function[Cp]= Specific_heat(a1,a2,a3,a4,a5,a8,a9,a10,a11,a12,temp,temp_range,R)
    %a1 a2 a3 a4 a5 are high temperature coefficients
    %a8 a9 a10 a11 a12 are low temperature coefficients
    for i= 1:length(temp_range)
    if temp_range(i)<=temp(2)
        Cp(i)= R*(a8 + (a9*temp_range(i)) + (a10*(temp_range(i).^2)) + (a11*(temp_range(i).^3)) + (a12*(temp_range(i).^4)));
    else
        Cp(i)= R*(a1 + (a2*temp_range(i)) + (a3*(temp_range(i).^2)) + (a4*(temp_range(i).^3)) + (a5*(temp_range(i).^4)));

    end
    end
CODE for the Molecular Weight:-
function[m_weight]= Molecular_weight(species_name)

    element= {'H','O','N','Ar','C','S'};
    atomic_mass= [1.008, 15.999, 14.007, 39.948, 12.011, 32.065];
    m_weight=0;
    for i= 1:length(species_name)
        for j= 1:length(element)
            if strcmp(species_name(i),element(j))
                m_weight= m_weight + atomic_mass(j);
                a= j;
            end

            end

        b= str2num(species_name(i));
        if b>1
            m_weight= m_weight + atomic_mass(a)*(b-1);
        end
    end
end
List of 53 Elements contained in 'THERMO.dat' file:
AR C C2H C2H2 C2H3 C2H4
C2H5 C2H6 C3H7 C3H8 CH CH2
CH2(S) CH2CHO CH2CO CH2O CH2OH CH3
CH3CHO CH3O CH3OH CH4 CN CO
CO2 H H2 H2CN H2O H2O2
HCCO CCOH HCN HCNN HCNO HCO
HNCO HNO HO2 HOCN N N2
N2O NCO NH NH2 NH3 NNH
NO NO2 O O2 OH
MAIN CODE:-
%program for file parsing of NASA thermodynamic file
close all
clear all
clc

%opening the external file
f1= fopen('THERMO.dat','r');
line_1= fgetl(f1); %skipping this line
line_2= fgetl(f1);

% obtaining global temperature values
% storing them as numbers in seperate values
global_values= strsplit(line_2,' ');
g_low_temp= str2num(global_values{2});
g_mid_temp= str2num(global_values{3});
g_high_temp= str2num(global_values{4});

%For skipping line no 3
line_3= fgetl(f1);
%For skipping ine no 4
line_4= fgetl(f1);
%For skipping line no 5
line_5= fgetl(f1);

%input universal gas constant

%in KJ/K-mol-K
R= 8.314;

for i= 1:53
    T= fgetl(f1);

    %extracting the species name
    species_name= T(1:9);

    %For removing the blank space
    species_name= deblank(species_name);

    %extracting local temperatures
    species_temp= T(49:75);
    local_values= strsplit(species_temp,' ');
    l_low_temp= str2num(local_values{1});
    l_mid_temp= str2num(local_values{3});
    l_high_temp= str2num(local_values{2});

    %storing of the local temp in variables
    temp= [l_low_temp l_mid_temp l_high_temp];

    temp_range=linspace(l_low_temp,l_high_temp,500);

    coeff= fgetl(f1);
    coeff1= findstr(coeff,'E');

    %extracting the coefficients
    a1= coeff(1:coeff1(1)+3);
    a1= str2num(a1);
    a2= coeff(coeff1(1)+4:coeff1(2)+3);
    a2= str2num(a2);
    a3= coeff(coeff1(2)+4:coeff1(3)+3);
    a3= str2num(a3);
    a4= coeff(coeff1(3)+4:coeff1(4)+3);
    a4= str2num(a4);
    a5= coeff(coeff1(4)+4:coeff1(5)+3);
    a5= str2num(a5);

    new_line= fgetl(f1);
    coeff2= findstr(new_line,'E');
    a6= new_line(1:coeff2(1)+3);
    a6= str2num(a6);
    a7= new_line(coeff2(1)+4:coeff2(2)+3);
    a7= str2num(a7);
    a8= new_line(coeff2(2)+4:coeff2(3)+3);
    a8= str2num(a8);
    a9= new_line(coeff2(3)+4:coeff2(4)+3);
    a9= str2num(a9);
    a10= new_line(coeff2(4)+4:coeff2(5)+3);
    a10= str2num(a10);

   new_line1= fgetl(f1);
   coeff_3= findstr(new_line1,'E');
   a11= new_line1(1:coeff_3(1)+3);
   a11= str2num(a11);
   a12= new_line1(coeff_3(1)+4:coeff_3(2)+3);
   a12= str2num(a12);
   a13= new_line1(coeff_3(2)+4:coeff_3(3)+3);
   a13= str2num(a13);
   a14= new_line1(coeff_3(3)+4:coeff_3(4)+3);
   a14= str2num(a14);

  %specific heat calculation
  Cp= specific_heat(a1,a2,a3,a4,a5,a8,a9,a10,a11,a12,temp,temp_range,R);

  %enthalpy calculation
  H= Enthalpy(a1,a2,a3,a4,a5,a6,a8,a9,a10,a11,a2,a13,temp,temp_range,R);

  %entropy calculation
  S= Entropy(a1,a2,a3,a4,a5,a7,a8,a9,a10,a11,a12,a14,temp,temp_range,R);

  %molecular weight calculation
  m_weight= Molecular_weight(species_name);

  %saving molecular weight as .txt file
  species_w= fopen('species_mass.txt','w');
  fprintf(species_w,'molecular mass of %s is %f',species_name,m_weight);
  fclose(species_w);

%plotting the figures

%saving the figures

cur_dir=pwd;

%Using #mkdir making a new folder for each species
mkdir(species_name);
cd(species_name);


figure(1)
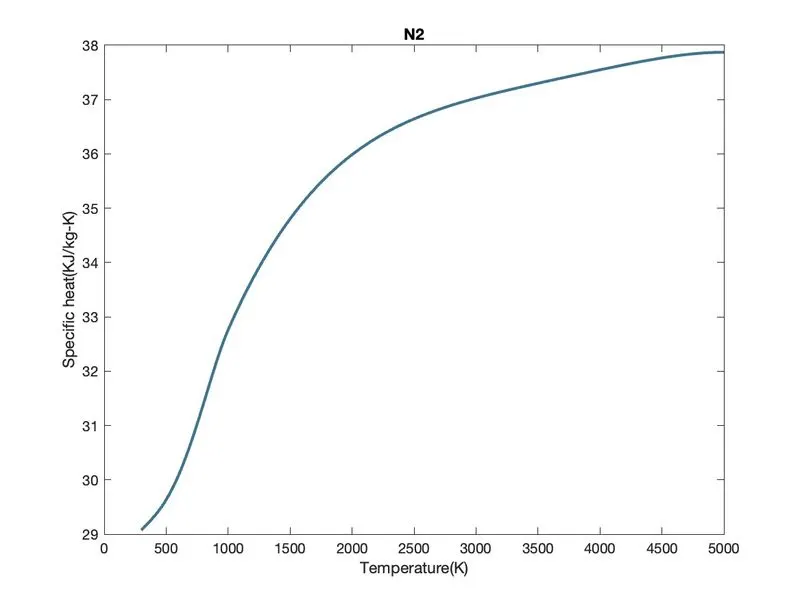
plot(temp_range,Cp,'linewidth',2,'color',[0.2345 0.4567 0.5678])
xlabel('Temperature(K)');
ylabel('Specific heat(KJ/kg-K)');
title(species_name);

figure(2),
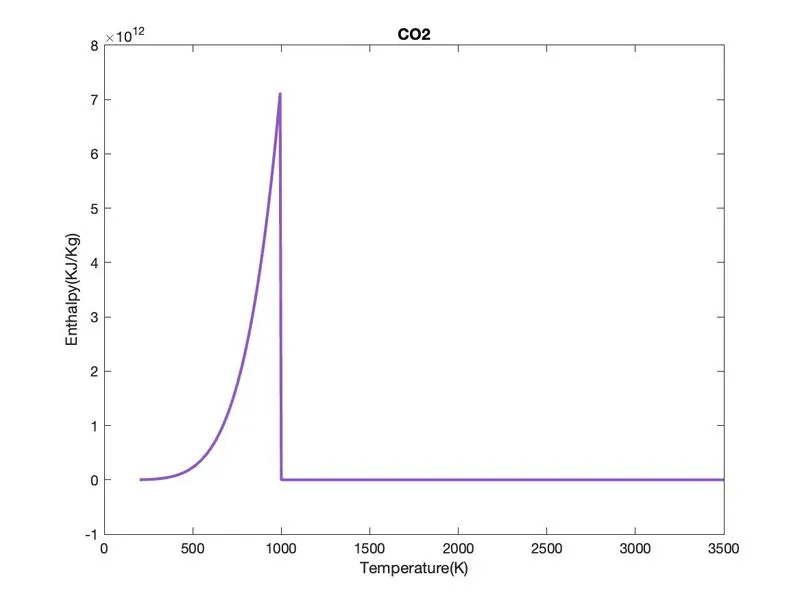
plot(temp_range,H,'LineWidth',2,'color',[0.5678 0.3423 0.7874])
xlabel('Temperature(K)');
ylabel('Enthalpy(KJ/Kg)');
title(species_name);

figure(3)
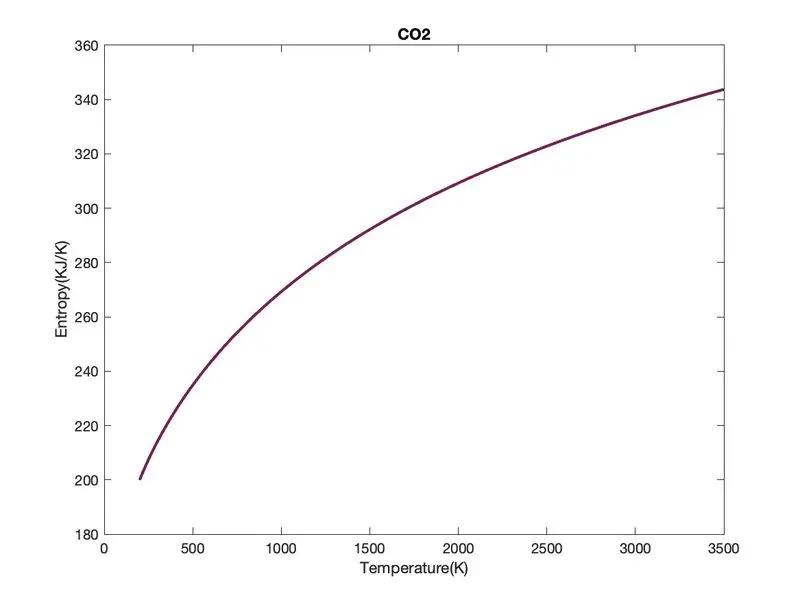
plot(temp_range,S,'LineWidth',2,'color',[0.4532 0.1234 0.3324])
xlabel('Temperature(K)');
ylabel('Entropy(KJ/K)');
title(species_name);


%saving the plots in spearate folder for each species
saveas(1,'specific heat.jpg');
saveas(2,'enthalpy.jpg');
saveas(3,'entropy.jpg');

cd(cur_dir);

%printing the molcular weight of the
sprintf('molecular weight of %s = %f',species_name,m_weight)


end

%closing the file
fclose(f1)
STEPS :-
- Firstly we create an Molecular_weight function W and assigning species input to that.
- Then define the main element of all 53 species in an array atomic_name that are :- 'H','C','O','N','Ar'.
- Then by taking above main elements we will create their atomic_wieght array from any source like the internet that are :- 1.008 12.011 15.999 14.007 39.948.
- Then we will assign molecular starting range W To zero and then create an for loop condition which runs to the length of the species and an another nested for loop is created which runs to the length of the string atomic_name.
- Then we will create an condition using if condition and use strcmp command to compare the species and atomic_name strings to calculate molecular masses if by comparison both string found same then we will assign its molecular weight.
- Now, we will string to the number using str2num command assign to n. Then we run an condition of if loop to find weather the species contains more than one element if there are more then 1 elements that is n>1 then we will increment the atomic weight by the multiplication of position and n-1 to the atomic_weight array.
- Then we will print the Molecular weight using fprintf command and display it using disp command.
Results:
Specific Heat, Entropy and Enthalpy Plots for O2, N2 and Co2 species :
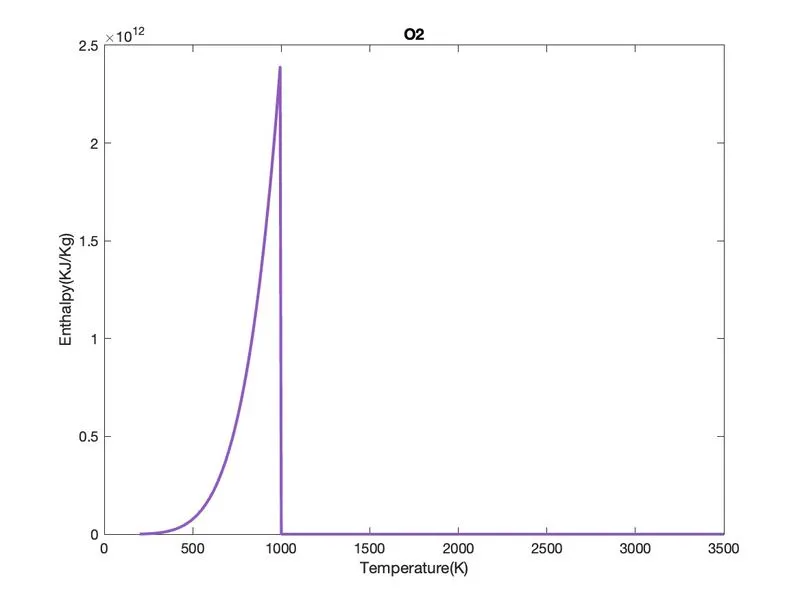
1. Plots for O2
a. Variation of Specific heat with the temperature of O2
b. Variation of Entropy with the temperature of O2
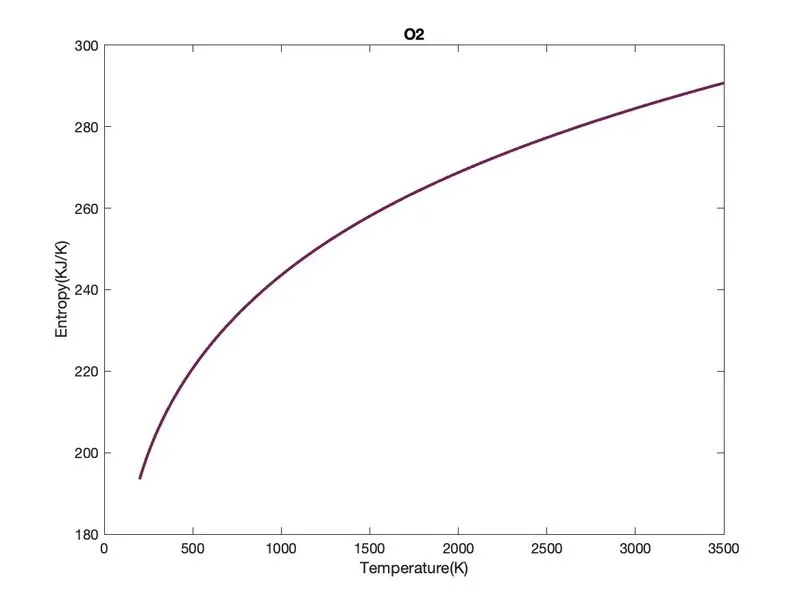
c. Variation of Enthalpy with the temperature of O2
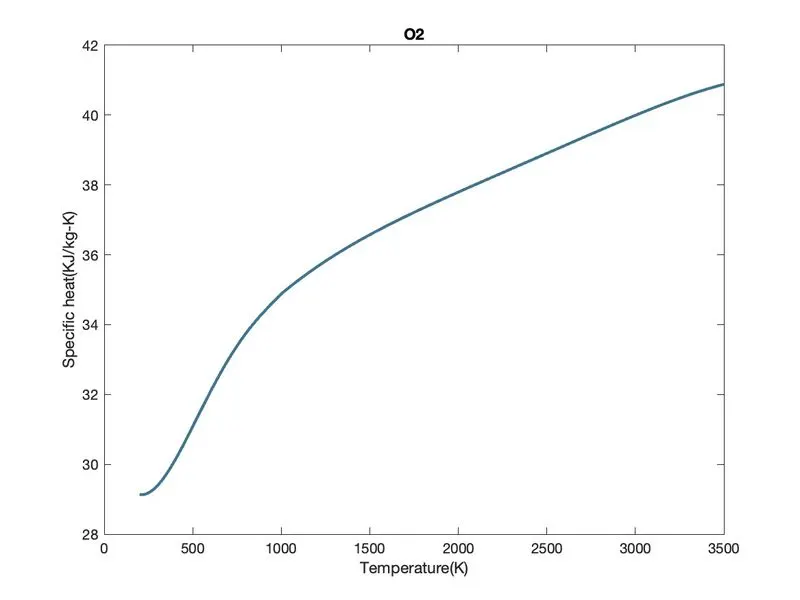
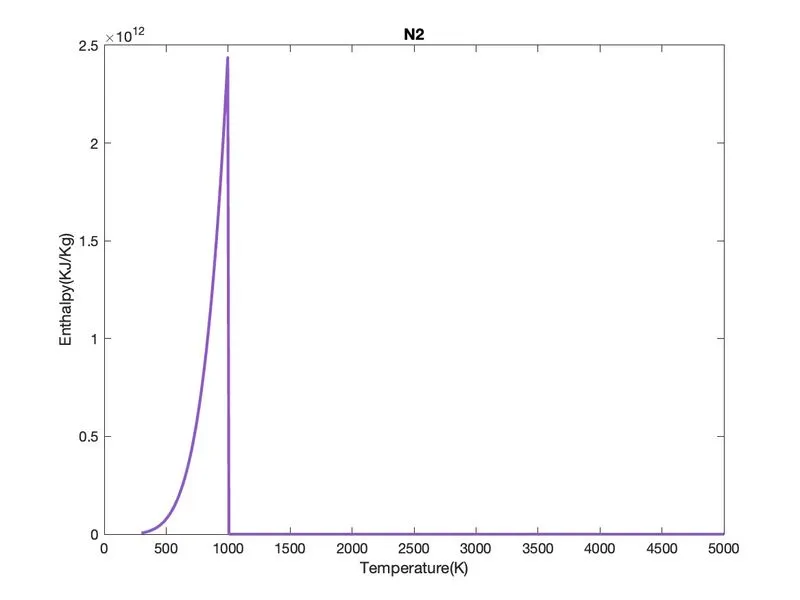
2. Plots for N2 :
a. Variation of Specific heat with the temperature of N2
b. Variation of Entropy with temperature of N2
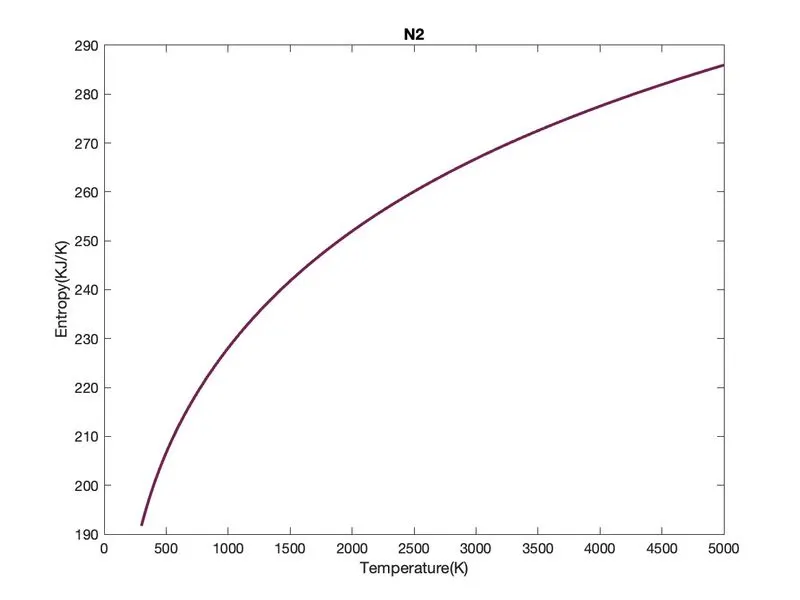
c. Variation of Enthalpy with the temperature of N2
3. Plots for Co2 :
a. Variation of Specific heat with the temperature of Co2
b. Variation of Entropy with the temperature of CO2
c. Variation of Enthalpy with the temperature of CO2
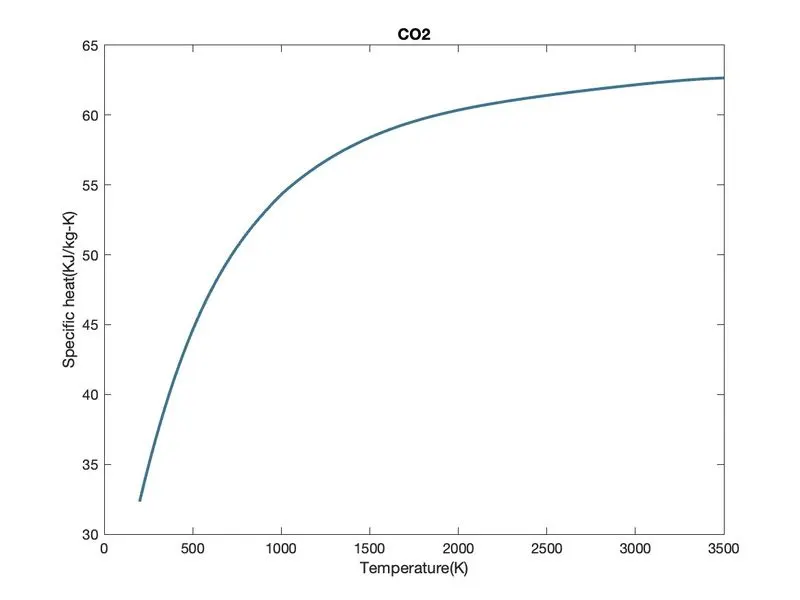
Image Containing all folders :-

Molecular Weight in command window :-
Conclusion :-
Using MATLAB code, the necessary coefficients required to evaluate various thermodynamic parameters for different species are extracted from NASA thermodynamic data file. The specific heat, enthalpy, and entropy for all the species are calculated and plotted against the local temperature range. The molecular weight is calculated for all the species.
References Links :-
https://in.mathworks.com/help/matlab/ref/mkdir.html