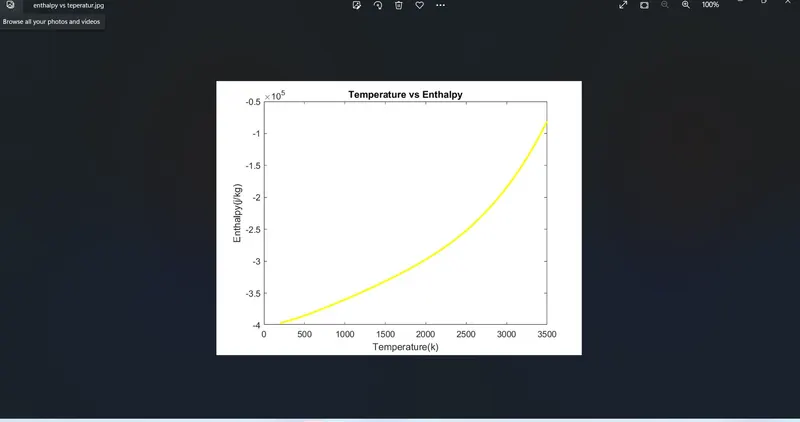
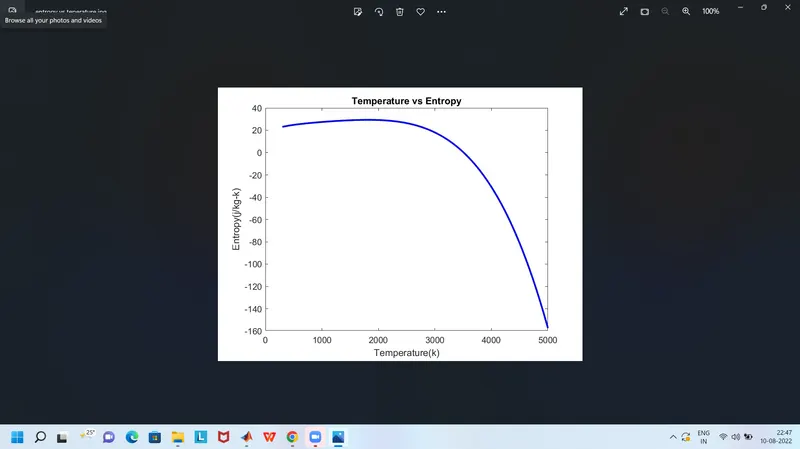
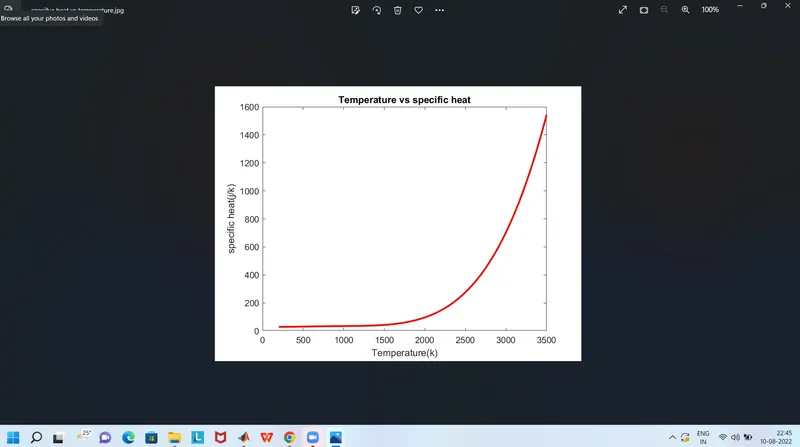
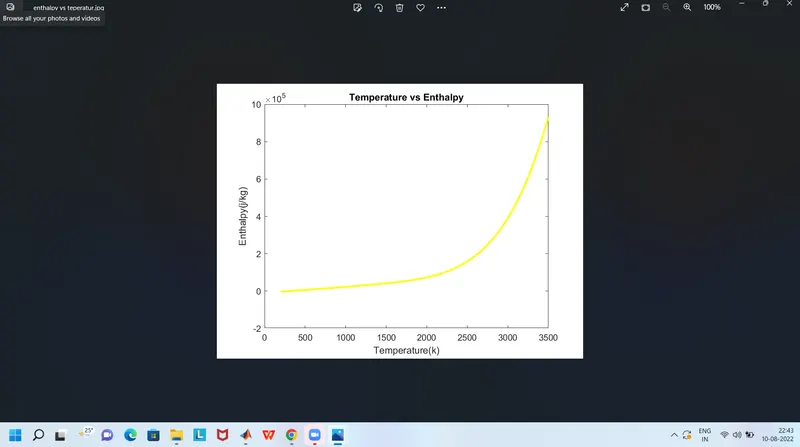
AIM - To develop a code to the NASA thermodynamic datafile to calculate the thermodynamic properties of various gas species and obtained the plots of thermodynamic properties like ENTHOLPY,ENTROPY,SPECIFIC HEAT and calculate the Molucular weight of the all species
FILE PARSING it means reading the data stream and building a memory model of the content of data, parsing it aims to some kind of transformation on the data
now write the code
clear all
close all
clc
% file parsing
f= fopen('THERMO.dat','r');
for i= 1:5
fgetl(f)
end
[all the speies are 53]
for i = 1:53
b=fgetl(f);
a=strsplit(b,' ');
species_name=a{1};
% extraction of local temperature
The temperature are taken by the [THERMO DATA]
low_temp = str2double(a{end-3});
high_temp = str2double(a{end-2});
mid_temp = str2double(a{end-1});
Now find out the 14 coefficients
% extraction of co efficients
co_eff = fgetl(f);
pos = strfind(co_eff,'E');
a1 = str2double(co_eff(1:(pos(1)+3)));
a2 = str2double(co_eff((pos(1)+4):(pos(2)+3)));
a3 = str2double(co_eff((pos(2)+4):(pos(3)+3)));
a4 = str2double(co_eff((pos(3)+4):(pos(4)+3)));
a5 = str2double(co_eff((pos(4)+4):(pos(5)+3)));
co_eff1 = fgetl(f);
pos2 = strfind(co_eff1,'E');
a6 = str2double(co_eff1(1:(pos2(1)+3)));
a7 = str2double(co_eff1((pos2(1)+4):(pos2(2)+3)));
a8 = str2double(co_eff1((pos2(2)+4):(pos2(3)+3)));
a9 = str2double(co_eff1((pos2(3)+4):(pos2(4)+3)));
a10 = str2double(co_eff1((pos2(4)+4):(pos2(5)+3)));
co_eff2 = fgetl(f);
pos1 = strfind(co_eff2,'E');
a11 = str2double(co_eff2(1:(pos1(1)+3)));
a12 = str2double(co_eff2((pos1(1)+4):(pos1(2)+3)));
a13 = str2double(co_eff2((pos1(2)+4):(pos1(3)+3)));
a14 = str2double(co_eff2((pos1(3)+4):(pos1(4)+3)));
In the above 14 coefficeints are 1-7 are the high temperature co efficients and 8-14 are the low temperature coefficients
Now calculate the ENTHOLPY ,ENTROPY,SPECIFI HEAT
% calculate the CP,H,S
% temperatue array creation
T = linspace(low_temp,high_temp,500);
% for i = 1:length(T)
% t= T(i);
% if (t<mid_temp)
% T(i) = T;
% elseif(t>=mid_temp)
% (i)=T;
% end
% end
%
% htr = htr1(122:500)
% calculating the CP,H,S[HTR]
% High temperature coeffeceints.[1-7]
R = 8.314;
if T>mid_temp
CP=(a1+a2.*T+a3.*T.^2+a4.*T.^3+a5.*T.^4)*R;
H=(a1+(a2.*T)/2+(a3.*T.^2)/3+(a4.*T.^3)/4+(a5.*T.^4)/5+(a6./T))*R.*T;
S=a1.*log(T)+a2.*T+(a3.*T.^2)/2+(a4.*T.^3)/3+(a5.*T.^4)/4+a7;
else
% Low temperature coeffecients[8-14]
CP=(a8+a9.*T+a10.*T.^2+a11.*T.^3+a12.*T.^4)*R;
H=(a8+(a9.*T)/2+(a10.*T.^2)/3+(a11.*T.^3)/4+(a12.*T.^4)/5+(a13./T))*R.*T;
S=a8.*log(T)+a9.*T+(a10.*T.^2)/2+(a11.*T.^3)/3+(a12.*T.^4)/4+a14;
end
% CP = [CP1 CP2];
% H = [H1 H2];
% S = [S1 S2];
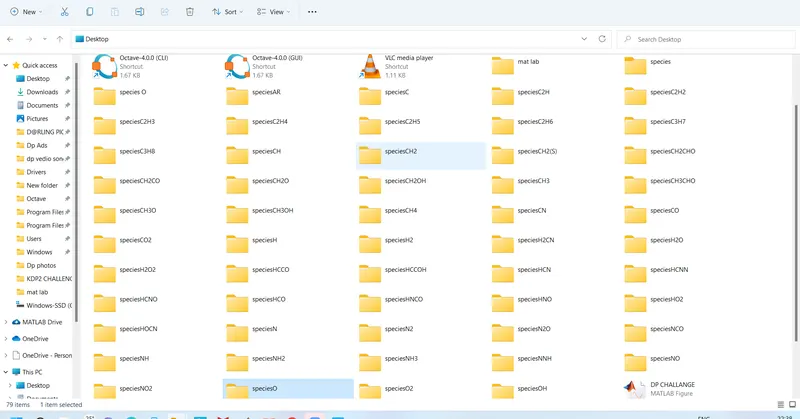
Now create the folder for saving the species
mkdir(['C:UsersKalingi Durga PrasadDesktopspecies',species_name])
cd(['C:UsersKalingi Durga PrasadDesktopspecies',species_name])
% PLOTTING
figure(1)
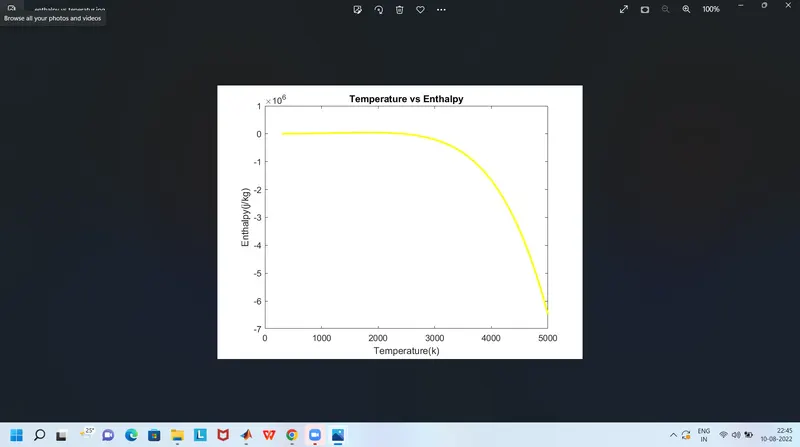
plot (T,H,'LineWidth',2,'Color','y');
xlabel('Temperature(k)');
ylabel('Enthalpy(j/kg)');
title('Temperature vs Enthalpy');
figure(2)
plot (T,CP,'LineWidth',2,'Color','r');
xlabel('Temperature(k)');
ylabel('specific heat(j/k)');
title('Temperature vs specific heat');
figure(3)
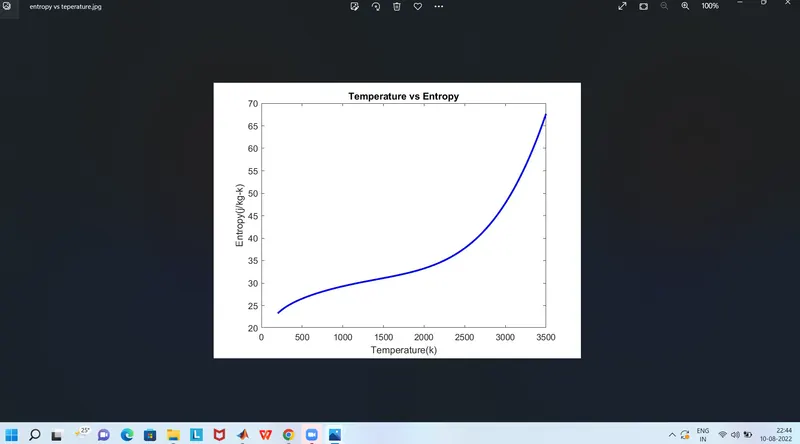
plot (T,S,'LineWidth',2,'Color','b');
xlabel('Temperature(k)');
ylabel('Entropy(j/kg-k)');
title('Temperature vs Enrtopy');
% %changing the directory and saving the file
% species_name='O';
saveas(1,'enthalpy vs teperatur','jpg');
saveas(2,'specifuc heat vs temperature','jpg');
saveas(3,'entropy vs teperature','jpg');
cd ..
% Calculating the MOLUCULAR WEIGHTS
First we tack the new editor window and write function of the molucular weight
function [M] = wt(species_name)
Elements= ['H','C','O','N','A'];
Atomic_weight = [1.008,12.024,15.999,14.003,40.002];
% specie=upper(species_name);
molucular_weight=0;
for i=1:length(species_name)
for j= 1:length(Elements)
if strcmpi(species_name(i),Elements(j))
molucular_weight=molucular_weight+Atomic_weight(j);
k=j;
end
end
n=str2double(species_name(i));
if(n>1)
molucular_weight= molucular_weight+(Atomic_weight(k)*(n-1));
end
M=molucular_weight;
end
end
save the file and next go to mainprogram write thw code below
M = wt(species_name);
k = sprintf('molecular weight of %s = %f n',species_name,M);
disp(k)
end
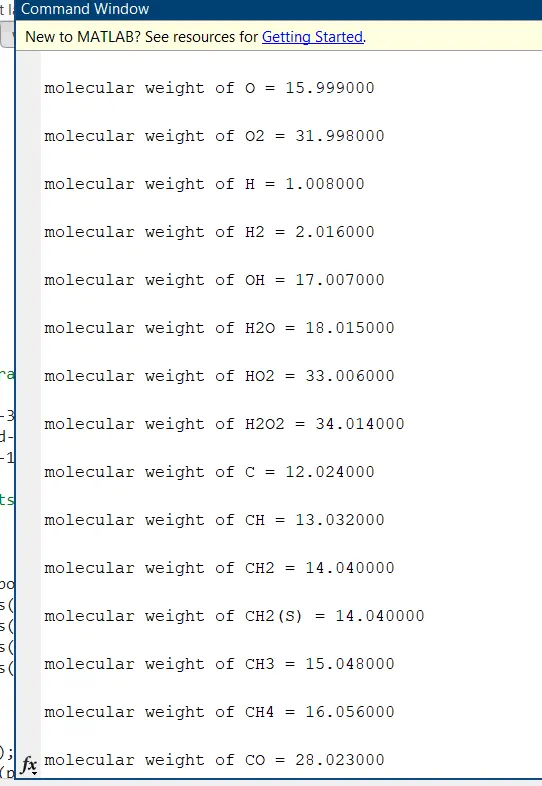
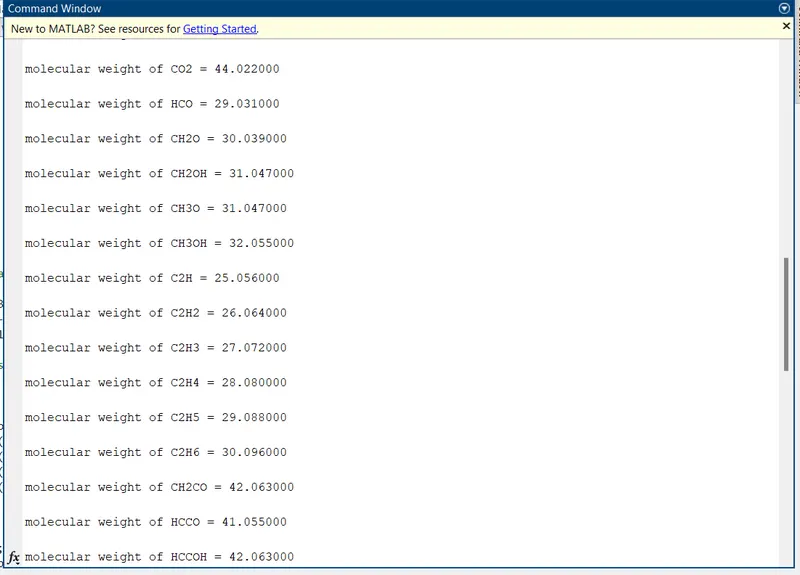
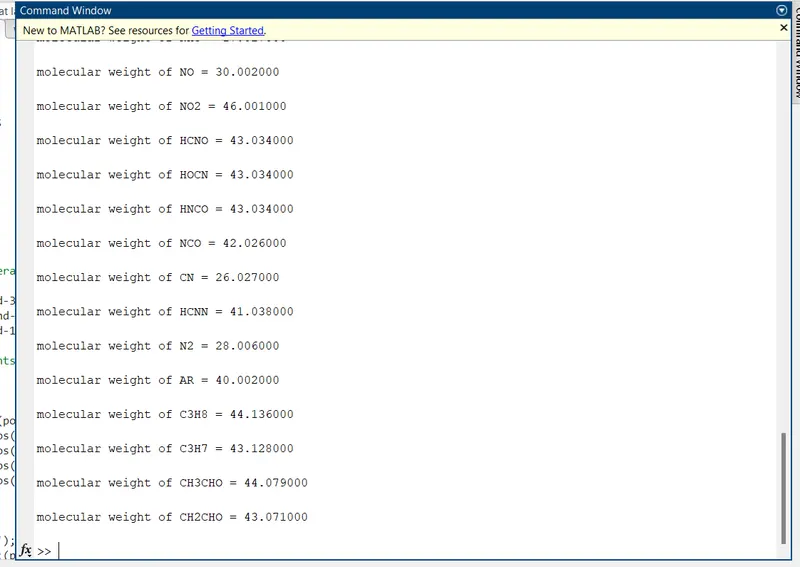
run the programe the all molucularweights are shown in the command window
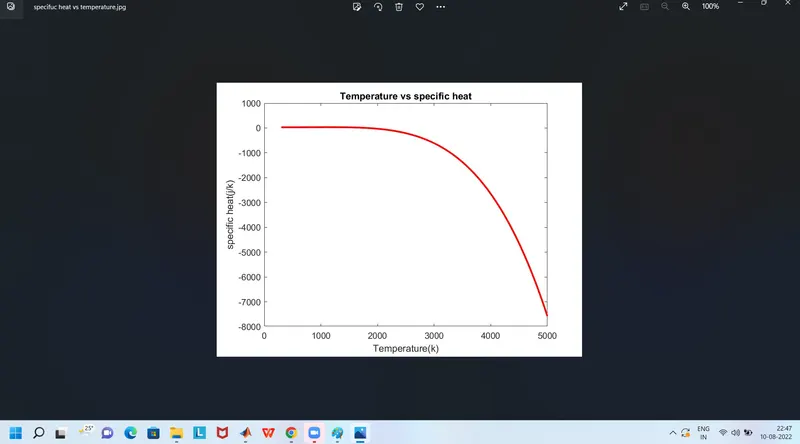
THE FOLLOWING ARE OUTPUTS OF CO2,O2,N2
CO2 FOR [TEMPERATURE ]VS [ ENTHALPY, ENTROPY,SPECIFIC HEAT ]
O2 FOR [TEMPERATURE ]VS [ ENTHALPY, ENTROPY,SPECIFIC HEAT ]
N2 FOR [TEMPERATURE ]VS [ ENTHALPY, ENTROPY,SPECIFIC HEAT ]
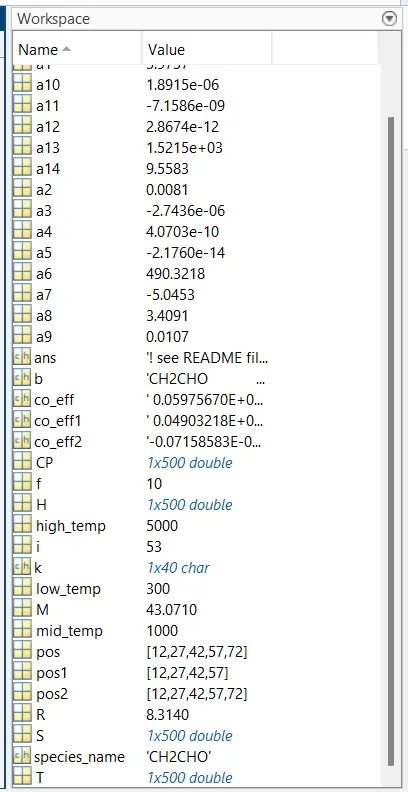
WORKSPACE OF FILE PARSING
53- SPECIES
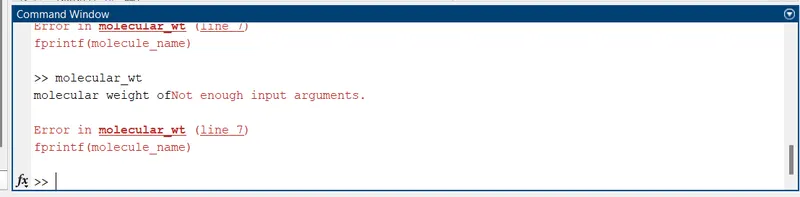
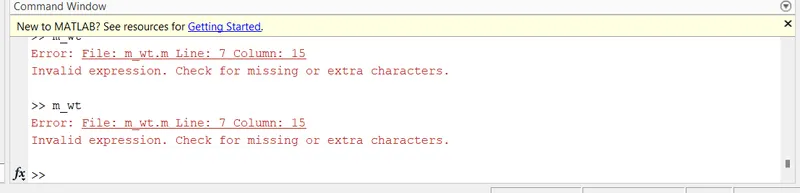
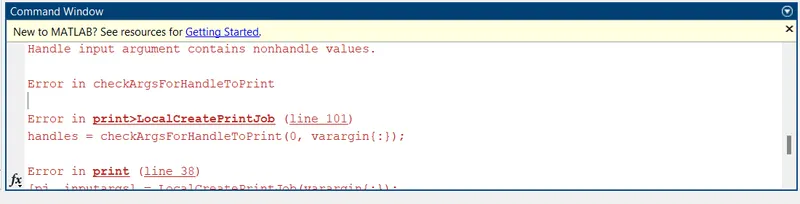
ERRORS
The following are the errors for while write the programe i a facing these erros are given below
while these errors are shown in command window and i am realize to what my mistake and how it will be overcome
and the i am give the improper inputs so i am checking the valuable inputs and correctly give proper inputs and clear the errors .
DISCRIPTION OF THE FILE PARSING
1- Firstly the data sheet is opened by fopen command.
2- fgetl command is used to read the line in the data sheet one by one.
3- The temperature range values are taken by the datafile.
4- For all the 53 species, the process is repeated by using a for loop.
5- Next find the coefficients like a1,a2,a3,a4,a5,a6,a7,a8,a9,a10,a11,a12,a13,a14 .
6- By using strfind, str2double the species name and corresponding species coefficients are extracted and stored.
7- now find the CP,H,S a seperate funciton thermo_data is called with specific inputs to calculate the cp, H, S values by using the below equation.
CP=(a1+a2.*T+a3.*T.^2+a4.*T.^3+a5.*T.^4)*R;
H=(a1+(a2.*T)/2+(a3.*T.^2)/3+(a4.*T.^3)/4+(a5.*T.^4)/5+(a6./T))*R.*T;
S=a1.*log(T)+a2.*T+(a3.*T.^2)/2+(a4.*T.^3)/3+(a5.*T.^4)/4+a7;
8- The temperature value from the 't' array is used one by one in a for loop and the cp, H, S value at each temperature is calculated based on the given conditions.
9 - These data are used to plot the graphs like below
cp vs temperature.
H vs temperature.
S vs temperature.
10- mkdir command is used to create the new folders based on species name and the 'cd' and 'saveas' commands are used to store the appropriate figures of the plot in those folders.
11 - molecular weight is calculated by a seperate function and stored in a new file.
12- These entire programme i am using these commands like' fopen,fgetl,strspilt,strfind,str2double'.
13- Hence the programme is complete ,,,.
CONCULTION
In the completion of the entire code by using these cammands ' fopen,fgetl,strspilt,strfind,str2double ',for find out the co efficients and entholpy ,entropy,specific heat calculated by using below equation .
CP=(a1+a2.*T+a3.*T.^2+a4.*T.^3+a5.*T.^4)*R;
H=(a1+(a2.*T)/2+(a3.*T.^2)/3+(a4.*T.^3)/4+(a5.*T.^4)/5+(a6./T))*R.*T;
S=a1.*log(T)+a2.*T+(a3.*T.^2)/2+(a4.*T.^3)/3+(a5.*T.^4)/4+a7;
and after easy to draw the plots like T vs SP,T vs H,T vs S and the folder is create by save the all 53 species next the function of molucular weights are obtained
The molucular weights of O2 = 31.99800
CO2= 44.02200
N2 = 28.06600
the outputs are given in the answe box.