Project 1 - Parsing NASA thermodynamic data
Cp=specific heat
R=molar gas constant
T=temperature
S=Entropy
H=Enthalpy
t=coefficients
Code for calling function specific heat():
function Cp = specific_heat(t1,t2,t3,t4,t5,t8,t9,t10,t11,t12,T,R,global_midtemp)

 %calculating specific_heat for global_hightemp and global_lowtemp
if(T>= global_midtemp)
    Cp=R*(t1+(t2*T)+(t3*(T).^2)+(t4*(T).^3)+(t5*(T).^4));
else
    Cp=R*(t8+(t9*T)+(t10*(T).^2)+(t11*(T).^3)+(t12*(T).^4));
end
end
Code for calling function Entropy():
function S = Entropy(t1,t2,t3,t4,t5,t7,t8,t9,t10,t11,t12,t14,T,R,global_midtemp)


 %calculating Entropy for global_hightemp and global_lowtemp respectively
if(T>= global_midtemp)
     S=R*(t1.*log(T)+(t2*T)+((t3*(T).^2)/2)+((t4*(T).^3)/3)+((t5*(T).^4)/5)+t7);
else
    S=R*(t8.*log(T)+(t9*T)+((t10*(T).^2)/2)+((t11*(T).^3)/3)+((t12*(T).^4)/4));
end
end
Code for calling function Enthalpy():
function H = Enthalpy(t1,t2,t3,t4,t5,t6,t8,t9,t10,t11,t12,t13,T,R,global_midtemp)

 %calculating Enthalpy for global_hightemp and global_lowtemp
if(T>= global_midtemp)
     H=R*((t1*T)+((t2*(T).^2)/2)+((t3*(T).^3)/3)+((t4*(T).^4)/4)+((t5*(T).^5)/5)+t6);
else
    H=R*((t8*T)+((t9*(T).^2)/2)+((t10*(T).^3)/3)+((t11*(T).^4)/4)+((t12*(T).^5)/5)+t13);
end
end
Code for calculating molecular weight by calling function wt():
function Molecular_weight=wt(species_name)

Elemetns=['H','C','O','N','A'];
Atomic_weight = [1,12,16,14,40];
%specie=upper(species_name);
Molecular_weight=0;
for i=1:length(species_name)
    for j=1:length(Elemetns)
        if strcmp(species_name(i),Elemetns(j))
            Molecular_weight=Molecular_weight+Atomic_weight(j);
            k=j;
        end
    end
            n=str2double(species_name(i));
            if(n>1)
                Molecular_weight=Molecular_weight+(Atomic_weight(k)*(n-1));
            end
end
Main Code:
clear all
close all
clc

%R = molar gas constant
R = 8.314;

% syntax to open the file
f1 = fopen('THERMO.dat','r');

% to read lines
l1=fgetl(f1);
l2=fgetl(f1);
value=strsplit(l2,' ');
% to get global temperatures from file in number form
global_lowtemp = str2num(value{2});
global_midtemp = str2num(value{3});
global_hightemp = str2num(value{4});

% temperature range
T = linspace(global_lowtemp, global_hightemp,1000);

% skipping these 3 lines
l3=fgetl(f1);
l4=fgetl(f1);
l5=fgetl(f1);

% Reading species ,calculating cp,h,s and ploting
for i=1:53
    tline = fgetl(f1);
    A = strsplit(tline, ' ');
    species_name = (A{1});

    lowtemp = str2num(A{end-3});
    midtemp = str2num(A{end-2});
    hightemp = str2num(A{end-1});

  % finding 7 higher cofficients and 7 lower coefficients

    tline_1 = fgetl(f1);
    tline_2 = fgetl(f1);
    tline_3 = fgetl(f1);

    A = findstr(tline_1,'E');
    B = findstr(tline_2,'E');
    C = findstr(tline_3,'E');


t1 = tline_1(1:A(1)+3);
t1 = str2num(t1);
t2 = tline_1(A(1)+4:A(2)+3);
t2 = str2num(t2);
t3 = tline_1(A(2)+4:A(3)+3);
t3 = str2num(t3);
t4 = tline_1(A(3)+4:A(4)+3);
t4 = str2num(t4);
t5 = tline_1(A(4)+4:A(5)+3);
t5 = str2num(t5);

t6 = tline_2(1:B(1)+3);
t6 = str2num(t6);
t7 = tline_2(B(1)+4:B(2)+3);
t7 = str2num(t7);
t8 = tline_2(B(2)+4:B(3)+3);
t8 = str2num(t8);
t9 = tline_2(B(3)+4:B(4)+3);
t9 = str2num(t9);
t10 = tline_2(B(4)+4:B(5)+3);
t10 = str2num(t10);

t11 = tline_3(1:C(1)+3);
t11 = str2num(t11);
t12 = tline_3(C(1)+4:C(2)+3);
t12 = str2num(t12);
t13 = tline_3(C(2)+4:C(3)+3);
t13 = str2num(t13);
t14 = tline_3(C(3)+4:C(4)+3);
t14 = str2num(t14);

% calculate specific heat(cp), Enthalpy(H),Entropy(s)
Cp = specific_heat(t1,t2,t3,t4,t5,t8,t9,t10,t11,t12,T,R,global_midtemp);
H = Enthalpy(t1,t2,t3,t4,t5,t6,t8,t9,t10,t11,t12,t13,T,R,global_midtemp);
S = Entropy(t1,t2,t3,t4,t5,t7,t8,t9,t10,t11,t12,t14,T,R,global_midtemp);


% creating the folder
mkdir(species_name);
cd(species_name);


% ploting T vs Cp
figure(1)
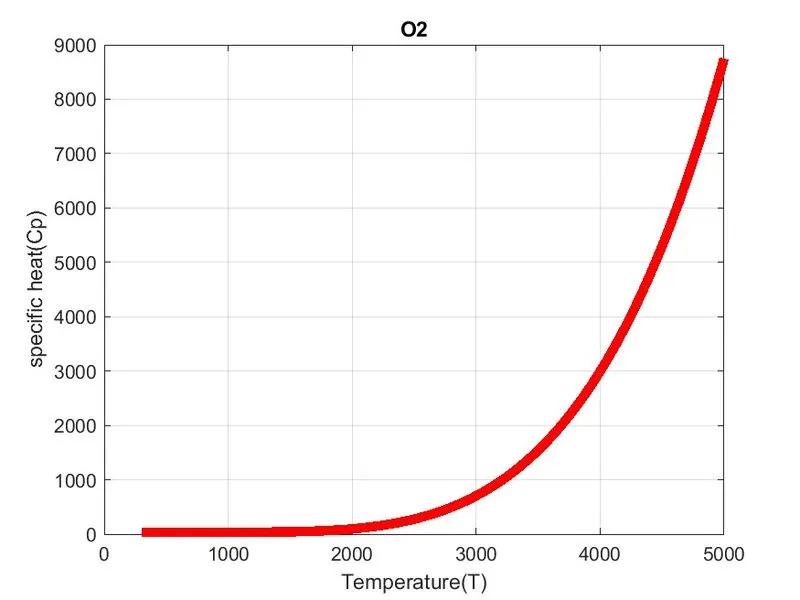
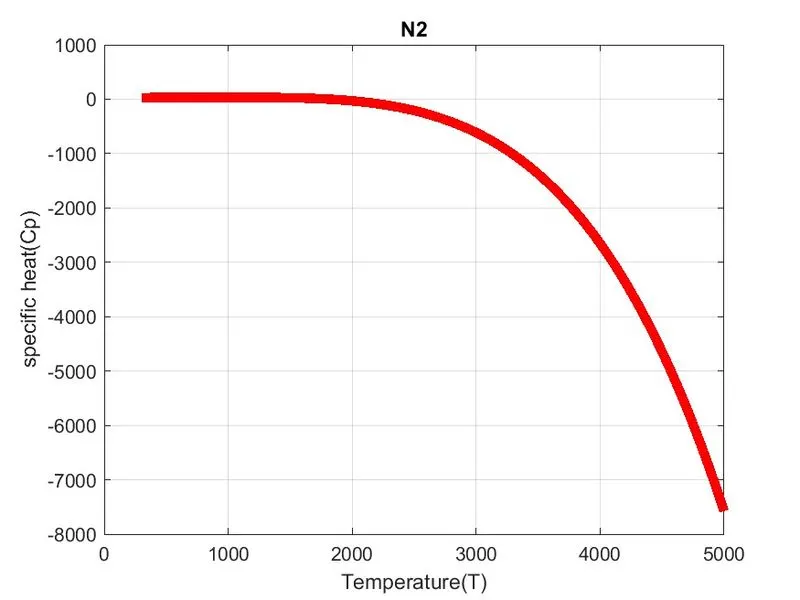
plot(T,Cp,'LineWidth',5,'Color','r')
xlabel('Temperature(T)')
ylabel('specific heat(Cp)')
grid on
title(species_name)
saveas(figure(1),'specific heat.jpg');

% ploting T vs H
figure(2)
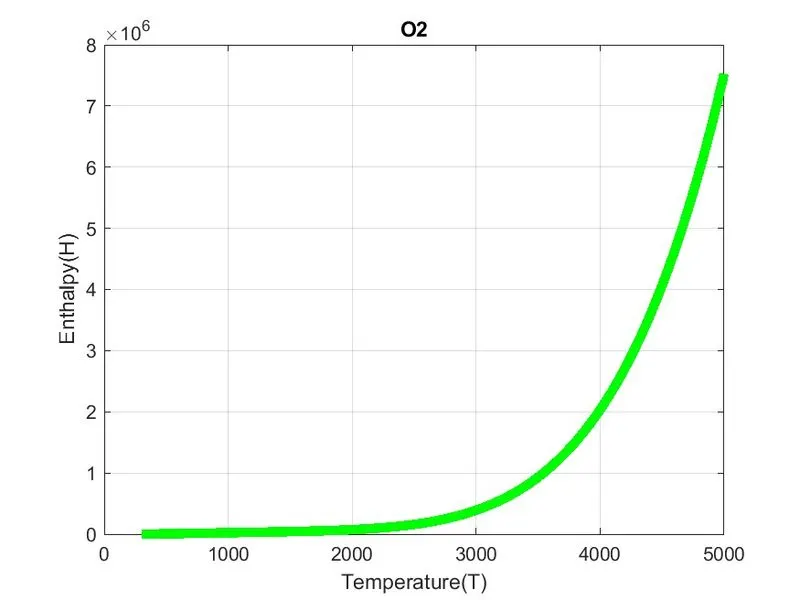
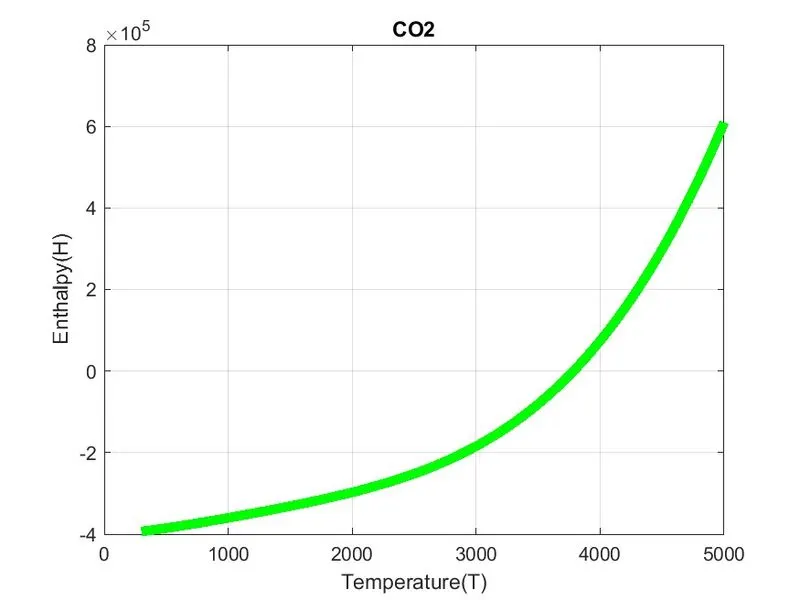
plot(T,H,'LineWidth',5,'Color','g')
xlabel('Temperature(T)')
ylabel('Enthalpy(H)')
grid on
title(species_name)
saveas(figure(2),'Enthalpy.jpg');

% ploting T vs S
figure(3)
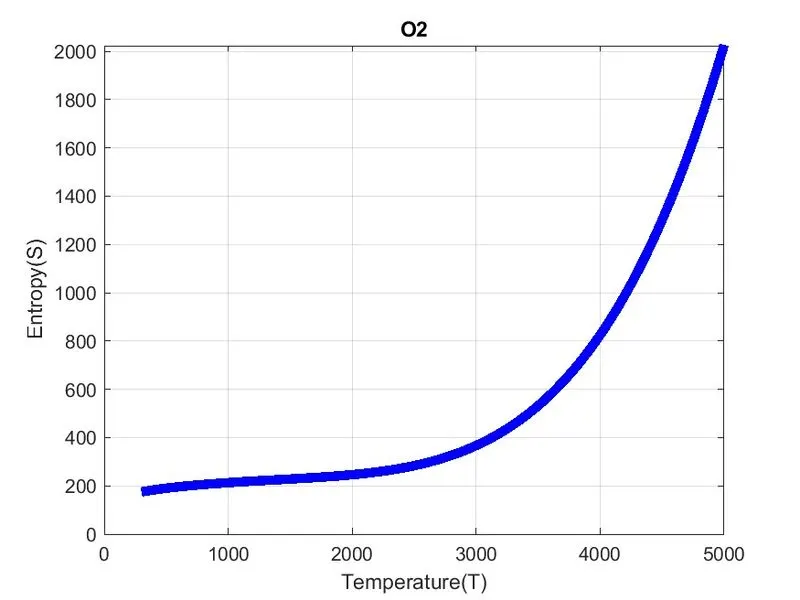
plot(T,S,'LineWidth',5,'Color','b')
xlabel('Temperature(T)')
ylabel('Entropy(S)')
grid on
title(species_name)
saveas(figure(3),'Entropy.jpg');
%cd('c:\Users\matlab\nasa files')

cd ..

% calculating the molecular weight and printig it
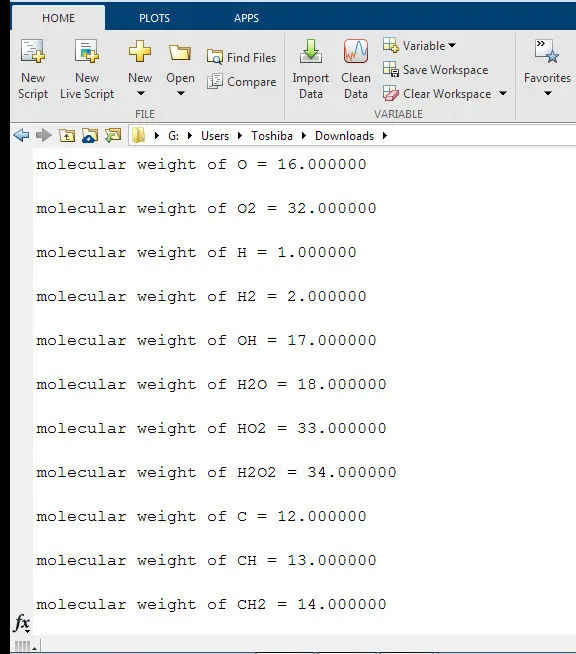
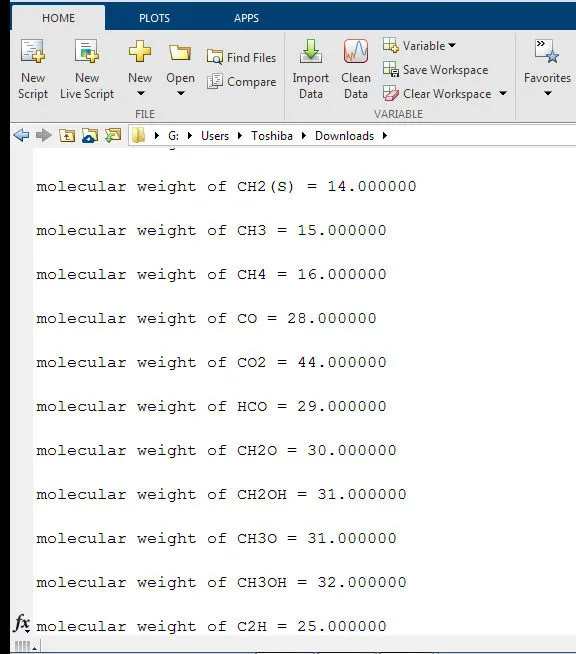
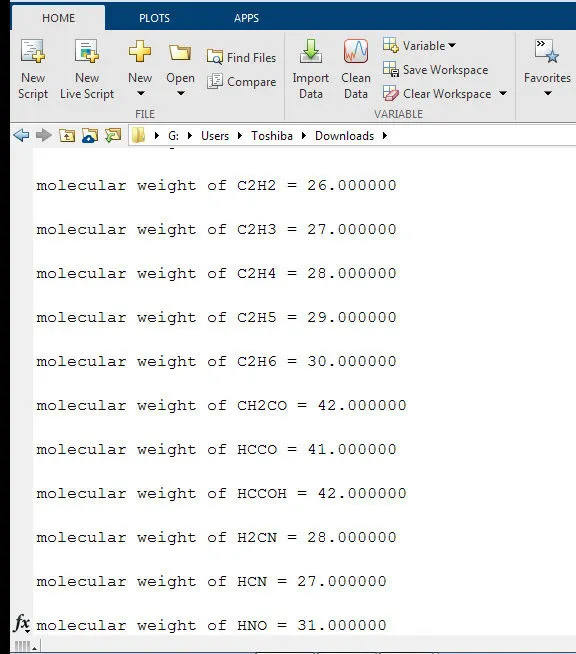
Molecular_weight=wt(species_name);
k = sprintf('molecular weight of %s = %f\n' , species_name,Molecular_weight);
disp(k)
end
Explanation for code:
clear all - To clear all the variables from the current workspace.
close all - It close all figures whose handles are visible.
clc - clc clears all the taxt from the command window.
* Initial the value or 'R' is being defined.
* Then we used a command to open the file 'THERMO.dat'.
* Further we use the 'fgetl' to start reading the lines, from the second line converting the strings to numbers and assigning global (low,mid and high) temperatures.
* then we have written a command to get to the temoerature range for calculation and ploting purpose.
* Then again using the fgetl command to get the next 3 lines and skipping it.
* Then i used a for loop to get 53 species and their temperature (low, mid and high) and the 14 coefficients.
* In the for loop I again use the fgetl commend and next line is read and from that line species name, the three local temperature are read stored.
* Then we use fgetl command to go to further line and get the next two lines and get the remaining coefficients.
* then after getting the 14 coefficient, we use these coefficients and by calling the functions we calculate cp,H,S.
* Then I have used 'mkdir, to create a new folder with the name of the current soecies and then a 'cd' command to make mkdir as the current directory.
*Then further we use plot command to plot temperature vs (cp,enthalpy,entropy),
*In this ploting we use the figure command to get the three different plots and saveas command to save the figures
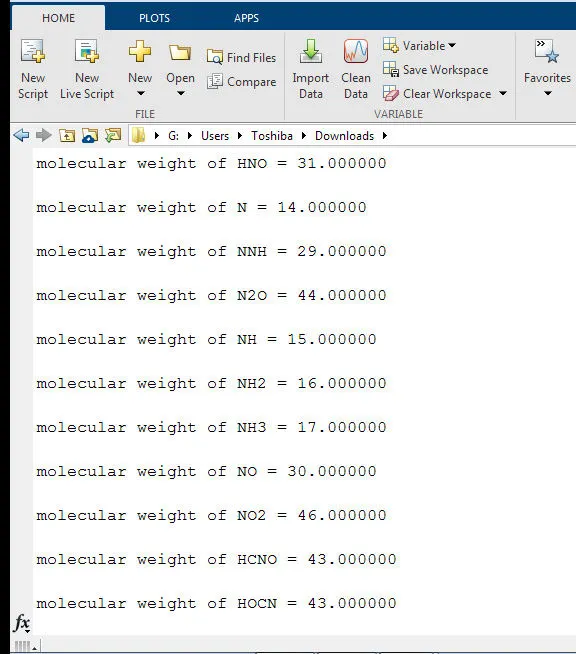
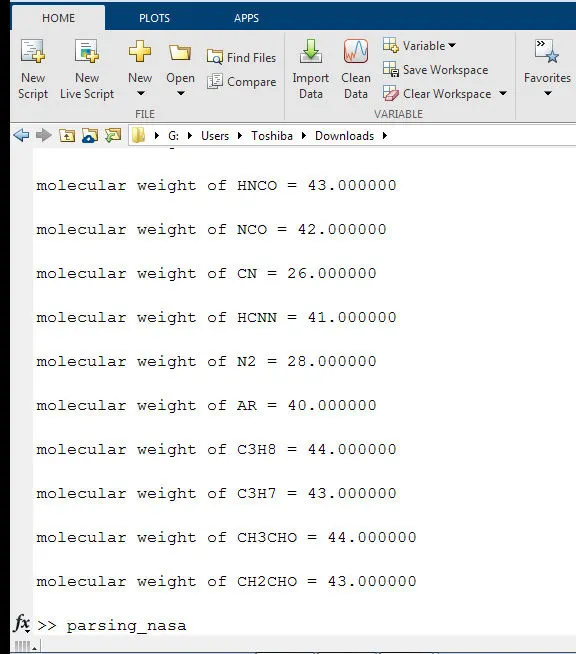
* Further we use the Molecular weight function and calculate molecular weight for that species.
ERRORS:

In this error there was a typing error. I changed the name and problem was solved.
OUTPUTS:
Plots for oxygen(o2):
Plots for nitrogen(N2):
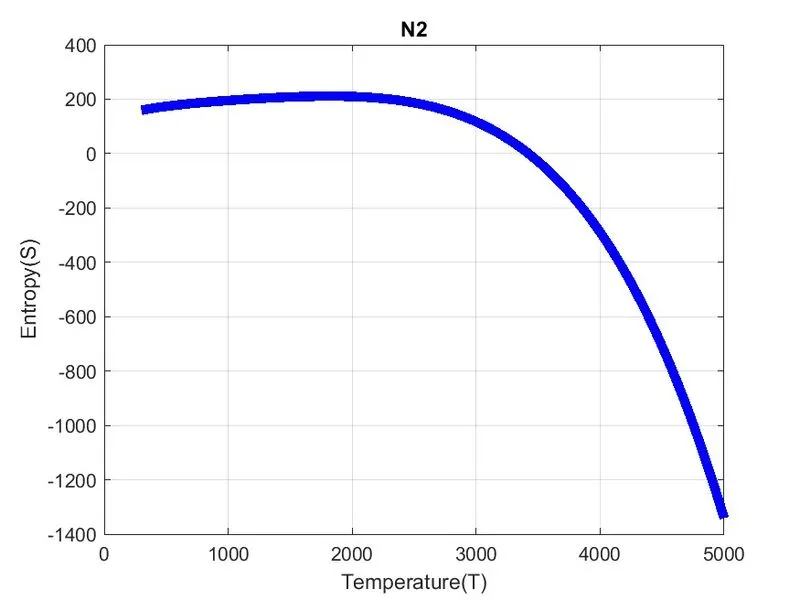
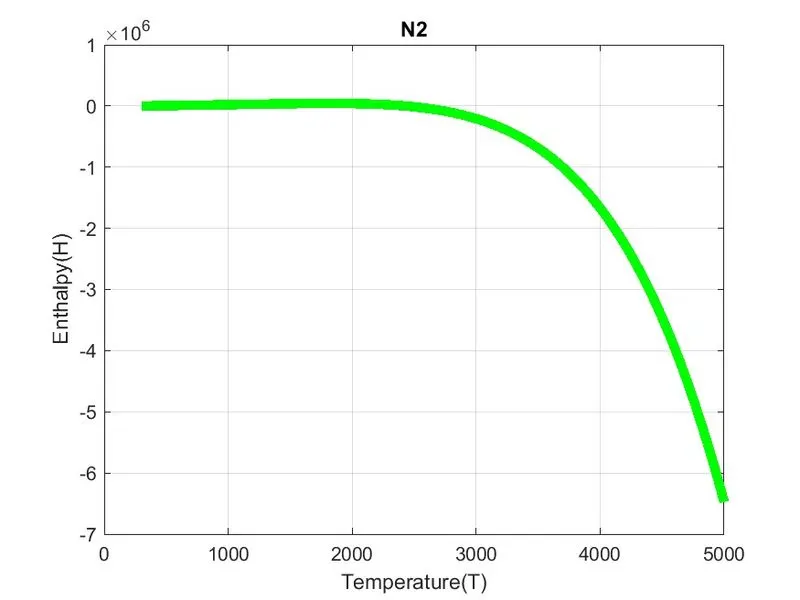
Plots for carbon dioxide(co2):
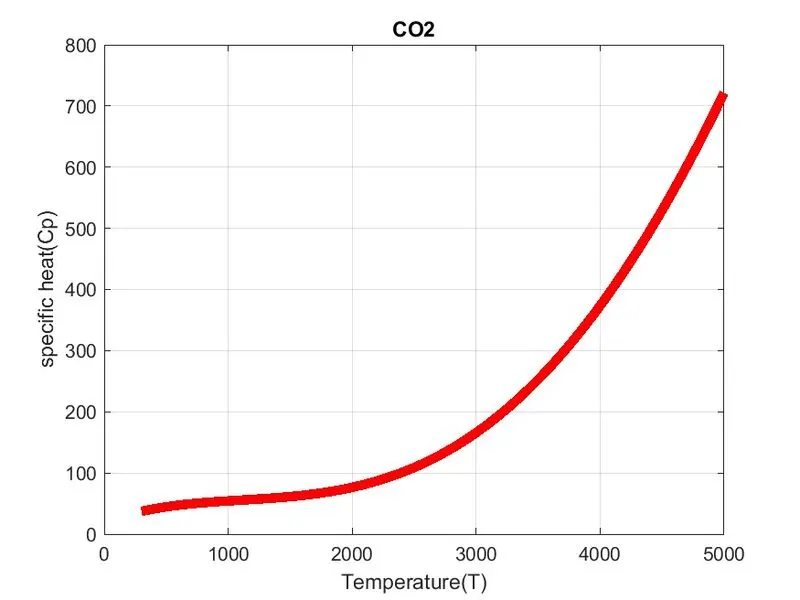
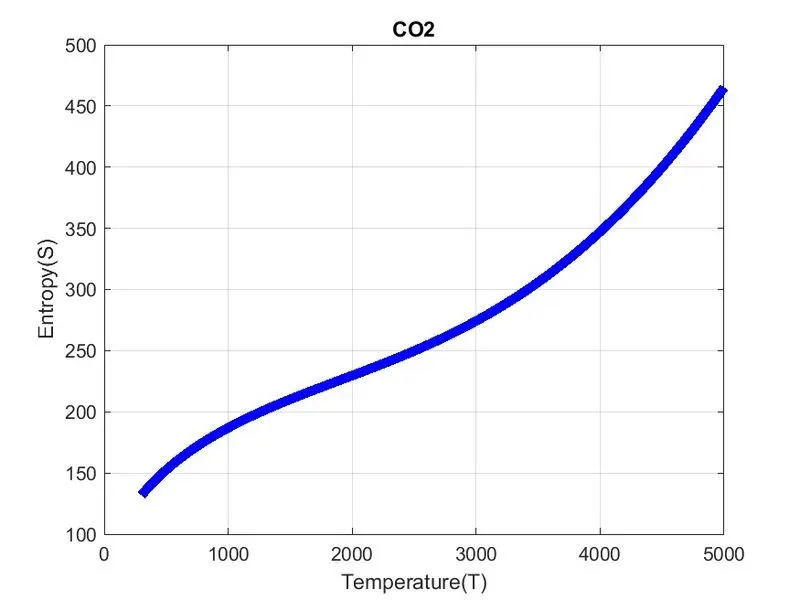
Screenshot of the folder:

Molecular weights:
CONCLUSION:
we were able to parse the data from the THERMO.dat file. then using this data we were able to calculate the thermodynamic properties and also make plots for these properties with respect to the temperature.