Project 1 - Parsing NASA thermodynamic data
clear all
close all
clc

f1 = fopen('THERMO (1).dat','r');
% skipping next 5 line
for i= 1:5
    fgetl(f1);
end

%storting starts

for i = 1:53

    %creating an array species
    tline = fgetl(f1)
    A = strsplit(tline,' ');

    %species
   species = A{1}

    %local temperature
    tlow = str2num(A{end-3});
    thigh = str2num(A{end-2});
    tmid = str2num(A{end-1});

    T = linspace(tlow,thigh,500)
    %finding coefficent
    %line 1
    tline1 =fgetl(f1)
    pos1 = findstr(tline1,'E');

    %high coefficent
    a1 = str2num(tline1(1:pos1(1)+3));
    a2 = str2num(tline1(pos1(1)+4:pos1(2)+3));
    a3 = str2num(tline1(pos1(2)+4:pos1(3)+3));
    a4 = str2num(tline1(pos1(3)+4:pos1(4)+3));
    a5 = str2num(tline1(pos1(4)+4:pos1(5)+3));

    %line2
    tline2 = fgetl(f1)
    pos2 = findstr(tline2,'E');
    a6 = str2num(tline2(1:pos2(1)+3));
    a7 = str2num(tline2(pos2(1)+4:pos2(2)+3));

    %lower coefficent
    a8 = str2num(tline2(pos2(2)+4:pos2(3)+3));
    a9 = str2num(tline2(pos2(3)+4:pos2(4)+3));
    a10 = str2num(tline2(pos2(4)+4:pos2(5)+3));

    % line3
    tline3 = fgetl(f1)
    pos3 = findstr(tline3,'E');
    a11 = str2num(tline3(1:pos3(1)+3));
    a12 = str2num(tline3(pos3(1)+4:pos3(2)+3));
    a13 = str2num(tline3(pos3(2)+4:pos3(3)+3));
    a14 = str2num(tline3(pos3(3)+4:pos3(4)+3));
  R = 8.314
    % specific heat
       cp = specific_heat(a1,a2,a3,a4,a5,a8,a9,a10,a11,a12,tmid,T,R);
    % entopy
       S = entropy_S(a1,a2,a3,a4,a5,a7,a8,a9,a10,a11,a12,a14,tmid,T,R);
    % enthalpy
       H = enthalpy_H(a1,a2,a3,a4,a5,a6,a8,a9,a10,a11,a12,a13,tmid,T,R);

   mkdir(species)
   cd(species)

       figure(1)
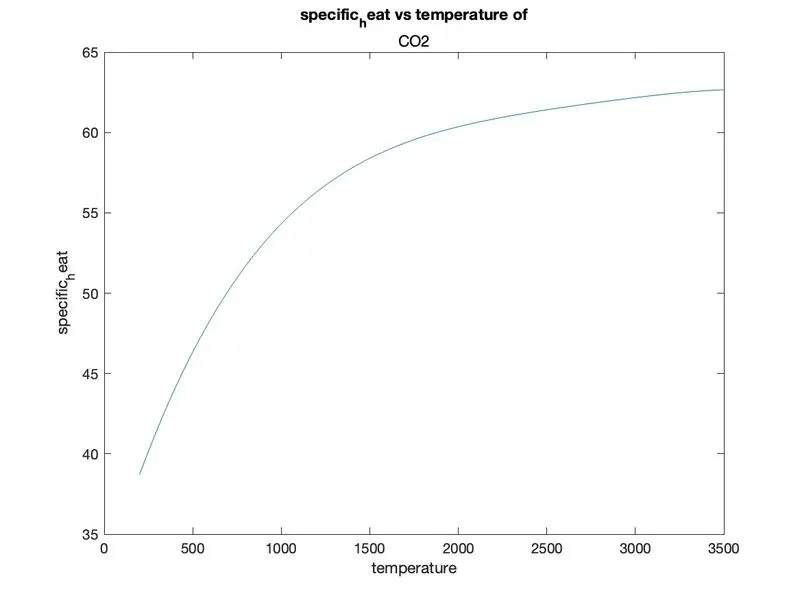
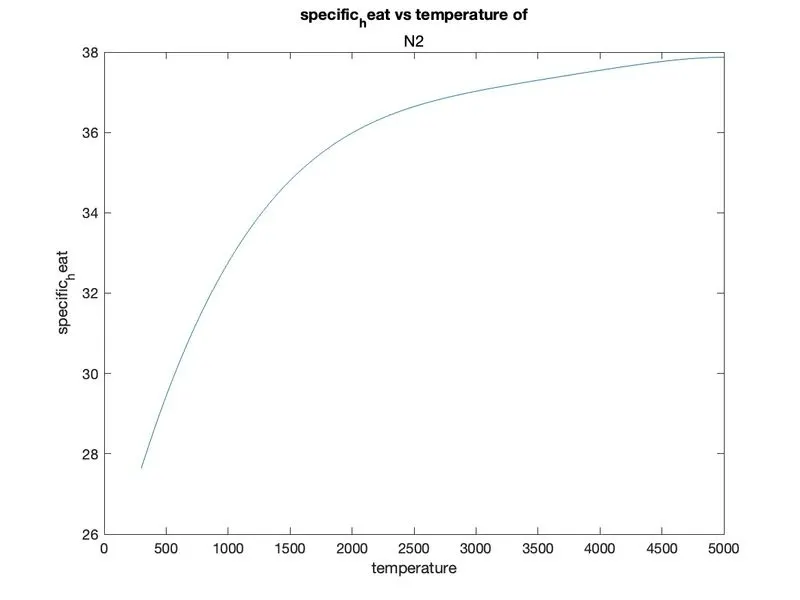
       plot(T,cp)
       xlabel('temperature')
       ylabel('specific_heat')
       title('specific_heat vs temperature of',sprintf('%s',species));
       saveas(figure(1),'cp vs T.jpg')

        figure(2)
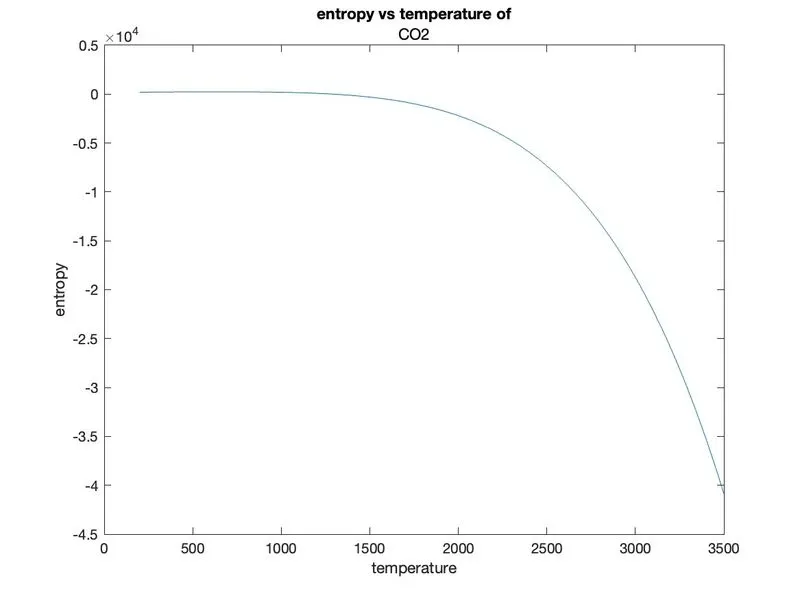
       plot(T,S)
       xlabel('temperature')
       ylabel('entropy')
       title('entropy vs temperature of',sprintf('%s',species));
       saveas(figure(2),'S vs T.jpg')

         figure(3)
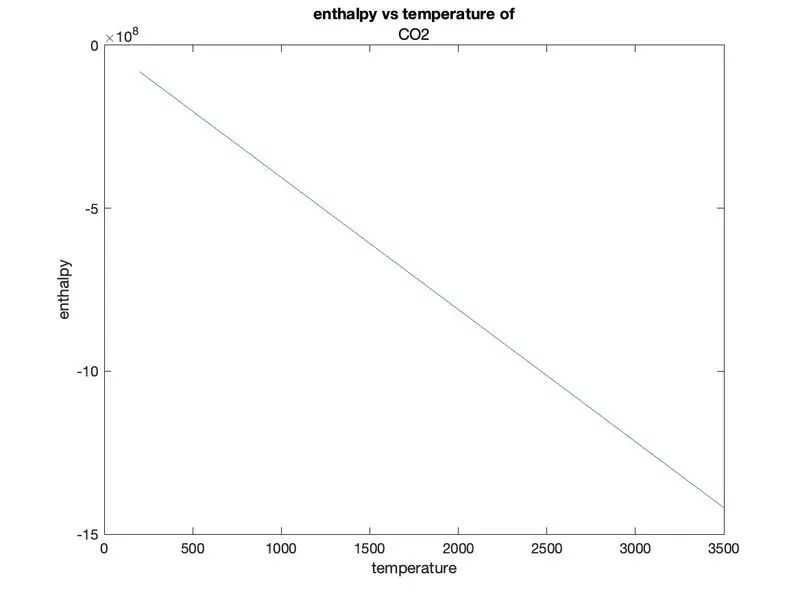
       plot(T,H)
       xlabel('temperature')
       ylabel('enthalpy')
       title('enthalpy vs temperature of',sprintf('%s',species));
       saveas(figure(3),'H vs T.jpg')
      % comming back to program directory

       cd ..

       % calculat molicular weight of species
       M = molecular_weight(species);
end
Explaination :-
Aim :-
To introduce tha termodynamic data and make a temperature cycle of enthalpy entropy and specific heat in with molicular weight of temperature
Governing the equation :-
- % specific heat
cp = specific_heat(a1,a2,a3,a4,a5,a8,a9,a10,a11,a12,tmid,T,R);
% entopy
S = entropy_S(a1,a2,a3,a4,a5,a7,a8,a9,a10,a11,a12,a14,tmid,T,R);
% enthalpy
H = enthalpy_H(a1,a2,a3,a4,a5,a6,a8,a9,a10,a11,a12,a13,tmid,T,R); - We creat the function of enthalpy and entropy and specific heat of co efficent
- And combain the equation on main program it was used to make a plot
Objective of the project :-
- The main objective of the project is to creat the temperature to given species
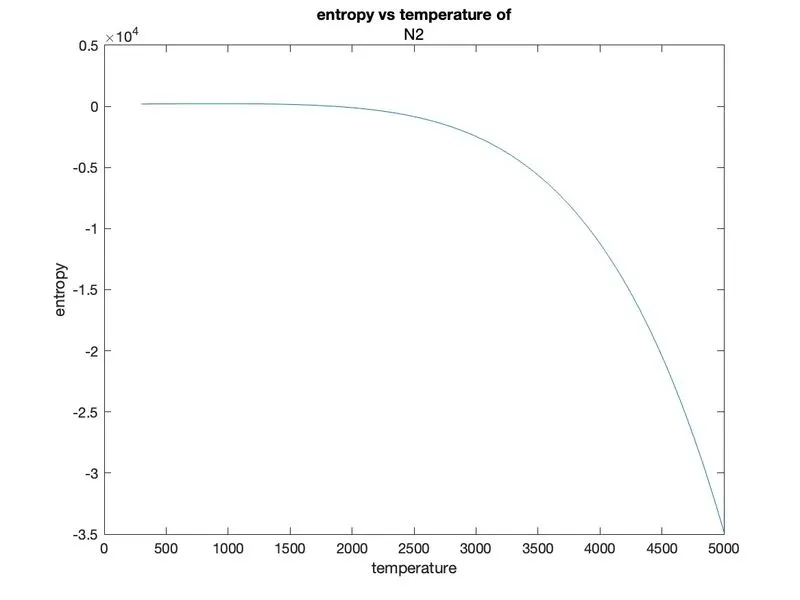
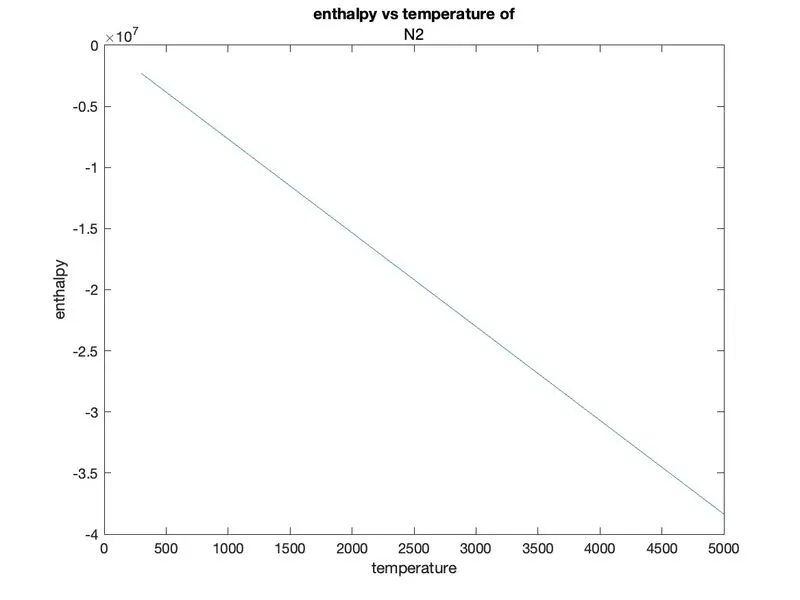
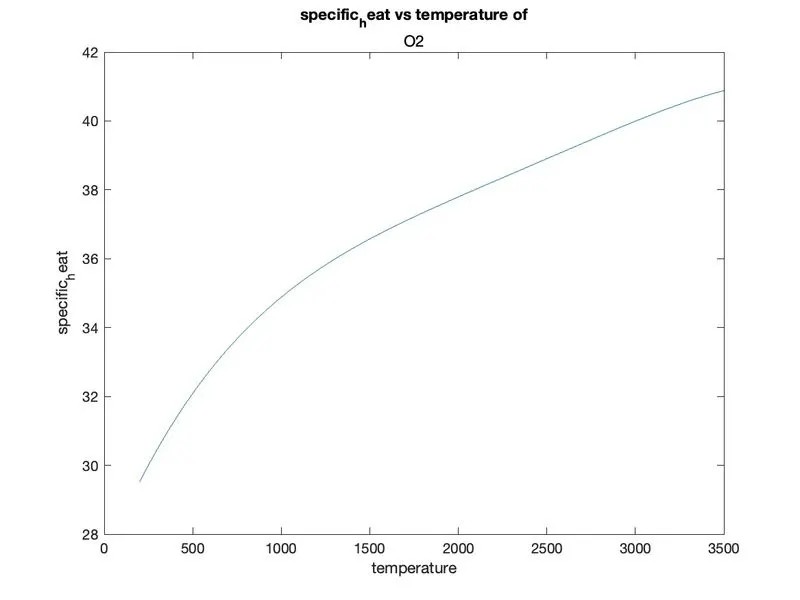
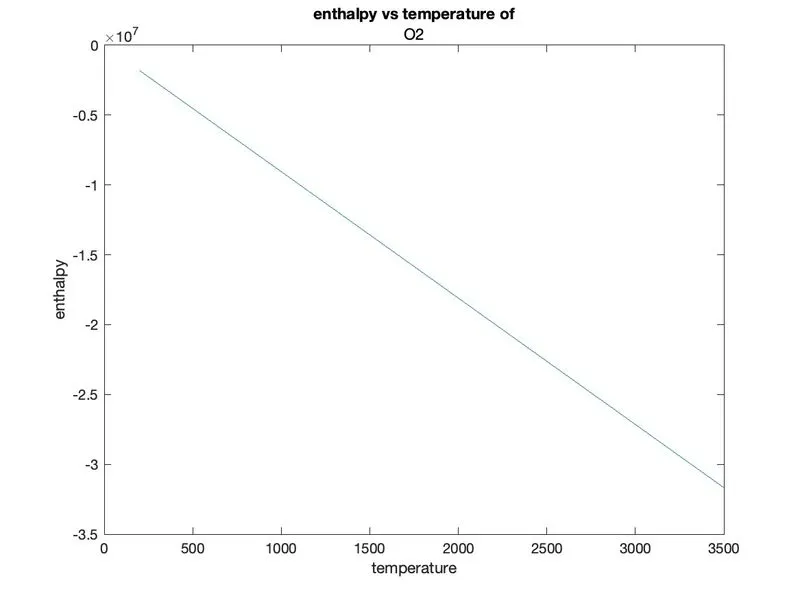
- It was use to sea the individual temperature of entropy enthalpy and the specific heat vs temperature in each species
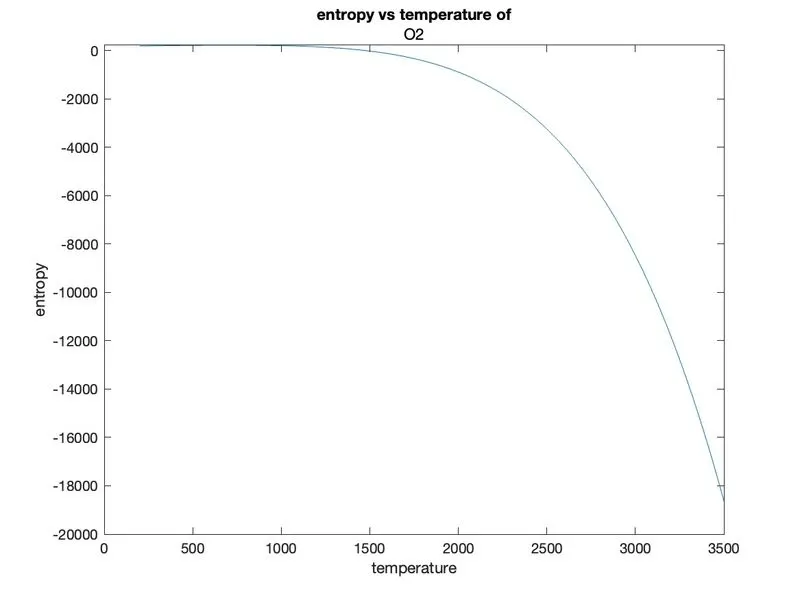
- For example we can take co2 o2 and n2 species and show the plot
Body of contant :-
* In case of programming project :-
- It was use matlab programming languvage
- First we read the file and let we assume tha f1
- We are ommite the first 5 line on termodynamic data table
- And it creating array species for using for loop command
- We found local temp ,tlow = str2num(A{end-3}); thigh = str2num(A{end-2}); tmid = str2num(A{end-1});
- Let we assume tha temp(T) at linspace(tlow,thigh, 500)
- Now we finding coefficent of temperature at line1
* In case of simulation project :-
- Now we found local temp on thermodynamic data at a1 to a14
- a1 = str2num(tline1(1:pos1(1)+3)); a2 = str2num(tline1(pos1(1)+4:pos1(2)+3)); a3 = str2num(tline1(pos1(2)+4:pos1(3)+3)); a4 = str2num(tline1(pos1(3)+4:pos1(4)+3));
a5 = str2num(tline1(pos1(4)+4:pos1(5)+3)); - At the same time a6 to a14 of same prosidure
- R = 8.314
% specific heat
cp = specific_heat(a1,a2,a3,a4,a5,a8,a9,a10,a11,a12,tmid,T,R);
% entopy
S = entropy_S(a1,a2,a3,a4,a5,a7,a8,a9,a10,a11,a12,a14,tmid,T,R);
% enthalpy
H = enthalpy_H(a1,a2,a3,a4,a5,a6,a8,a9,a10,a11,a12,a13,tmid,T,R); - It will be consider the function of entropy and enthalpy and specific heat and fainlly we calculate the molicular weight
- The molicular weight assume to create the specice
* In caseof design project :-
- We create the Mkdir and cd species of the temp
- Let we found figure1 and figure2 and figure3
- It will be plotting over all 3 species like cp. and H and S
- First plot(Cp,T) second plot (H,T) third plot(S,T) finally we creat xlabel and ylabel and title
- Finally can create saveas(figure(1),'cp vs T.jpg') and saveas(figure(2),'H vs T.jpg') and saveas(figure(3),'S vs T.jpg'
- And attach the function of molicular weight of temp its M = molecular_weight(species);
Conclution :-
At the end of tha project to find the cp H and S species of the temp can be plotted on matlab sucessfully