Project 1 - Parsing NASA thermodynamic data
Function for Specific Heat:
% Specific Heat Calculation Function

function Cp = Specific_heat(a1,a2,a3,a4,a5,a8,a9,a10,a11,a12,T,R,tempmid)

  % calculating specific heat for higher and lower temperature respectively.

if (T <= tempmid)

   Cp = R*(a8+ (a9*T) + (a10*(T).^2) + (a11*(T).^3) + (a12*(T).^4));

 else
   Cp = R*(a1+ (a2*T) + (a3*(T).^2) + (a4*(T).^3) + (a5*(T).^4));

 end
end
Function for Entropy:
% Entropy Calculation Function

function S = Entropy(a1,a2,a3,a4,a5,a7,a8,a9,a10,a11,a12,a14,T,R,tempmid)

  % calculating entropy for higher and lower temperature respectively.

  if (T <= tempmid)

    S = R*(a8.*log(T) + (a9*T) + ((a10*(T).^2)/2) + ((a11*(T).^3)/3) + ((a12*(T).^4)/4) + a14);

  else
    S = R*(a1.*log(T) + (a2*T) + ((a3*(T).^2)/2) + ((a4*(T).^3)/3) + ((a5*(T).^4)/4) + a7);
 end
end
Function for Enthalpy:
% Enthalpy Calculation function

function H = Enthalpy(a1,a2,a3,a4,a5,a6,a8,a9,a10,a11,a12,a13,T,R,tempmid)

  % calculating enthalpy for higher and lower temperature respectively.

  if (T <= tempmid)

    H = R*T.*(a8 + ((a9*T)/2) + ((a10*(T).^2)/3) + ((a11*(T).^3)/4) + ((a12*(T).^4)/5) + ((a13./T)));

  else
    H = R*T.*(a1 + ((a2*T)/2) + ((a3*(T).^2)/3) + ((a4*(T).^3)/4) + ((a5*(T).^4)/5) + ((a6./T)));

  end
end
Function for Molecular weight:
 % Adding Atomic Number to obtain particular value

   for  i=1:length(species)          % Loop runs to the length of the species
       for j=1:length(atomic_name)   % Loop runs to the length of the atomic name
         if strcmp(species(i), atomic_name(j)) % function to compare 2 strings
         MW = MW + atomic_weight(j);
         position = j;
       end
     end
     n = str2num(species);           % Finding more elements in the species and incrementing  atomic weight of the species

   if n>1
       MW = MW + atomic_weight(position)*(n-1);
     end
   end
   fprintf('Molecular Weight of %s : ',species);
   fprintf('%f',MW);
   disp(' ');
 end
Main PRogram:
clear all
close all
clc

% Input
R = 8.314; % Gas Constant (J/(mol-K))

% Reading data File
% Open and read THERMO.dat file

f1 =   fopen('THERMO.dat','r')
get = fgetl(f1);


% NOW reading Temperature from this file
temp = fgetl(f1);

% Splitting
s = strsplit(temp);

% Converting   strings cells into numbers
templow = str2num(s{2});
tempmid = str2num(s{3});
temphigh = str2num(s{4});

% Temperature Range
T = linspace(templow,temphigh,1000);

% Skipping Comment lines
for i= 1:3
    get = fgetl(f1);

endfor

% Reading the species
for j = 1:53
  tline = fgetl(f1);
   % Splitting cell into array
  A = strsplit(tline, ' ');
   % To read the name of the species
 species = (A{1});

% Converting   strings cells into numbers
lowtemp = str2num(A{end-3});
midtemp = str2num(A{end-2});
hightemp = str2num(A{end-1});
 % getting next line
tline1 = fgetl(f1);
% Finding the string E
a = strfind(tline1, 'E');

% Finding first 7 higher and second & lower coefficients

% Finding the Higher coefficients
a1 = tline1(1:a(1)+3);
a1 = str2num(a1);
a2 = tline1(a(1)+4:a(2)+3);
a2 = str2num(a2);
a3 = tline1(a(2)+4:a(3)+3);
a3 = str2num(a3);
a4 = tline1(a(3)+4:a(4)+3);
a4 = str2num(a4);
a5 = tline1(a(4)+4:a(5)+3);
a5 = str2num(a5);

tline2 = fgetl(f1);
b = strfind(tline2, 'E');
a6 = tline2(1:b(1)+3);
a6 = str2num(a6);
a7 = tline2(b(1)+4:b(2)+3);
a7 = str2num(a7);


% Finding lower coefficients
a8 = tline2(b(2)+4:b(3)+3);
a8 = str2num(a8);
a9 = tline2(b(3)+4:b(4)+3);
a9 = str2num(a9);
a10 = tline2(b(4)+4:b(5)+3);
a10 = str2num(a10);

tline3 = fgetl(f1);
c = strfind(tline3, 'E');
a11 = tline(1:c(1)+3);
a11 = str2num(a11);
a12 = tline3(c(1)+4:c(2)+3);
a12 = str2num(a12);
a13 = tline3(c(2)+4:c(3)+3);
a13 = str2num(a13);
a14 = tline3(c(3)+4:c(4)+3);
a14 = str2num(a14);

% calculate specific heat
Cp = Specific_heat(a1,a2,a3,a4,a5,a8,a9,a10,a11,a12,T,R,tempmid);

% calculate Entropy
S = Entropy(a1,a2,a3,a4,a5,a7,a8,a9,a10,a11,a12,a14,T,R,tempmid);

% calculate Enthalpy
H = Enthalpy(a1,a2,a3,a4,a5,a6,a8,a9,a10,a11,a12,a13,T,R,tempmid);

% calculate Molecular Weight of the species
MW = Molecular_weight(species);

% writing molecular weight file
MW_file = fopen('Molecular Weight.txt','w');
fprintf(MW_file,'Molecular weight of %s is %d ',species,MW);
fclose(MW_file);

% Plotting Cp, H & S with temperature
% saving in a folder
cd('C:/Users/sande/OneDrive/Documents/MATLAB/basic command/species')
mkdir(species);
cd(species);

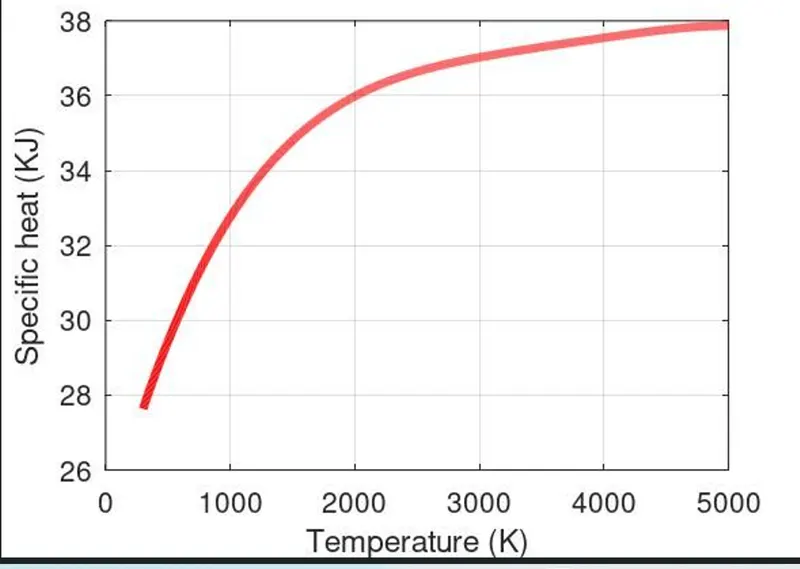
% Plot 1 | Cp vs T
figure(1)
plot(T,Cp,'linewidth',3,'color','r');
xlabel('Temperature (K)');
ylabel('Specific heat (KJ)');
title(sprintf('Specific heat vs Temperature range of %s', species));
grid on
saveas(figure(1),'Specific Heat.jpg');

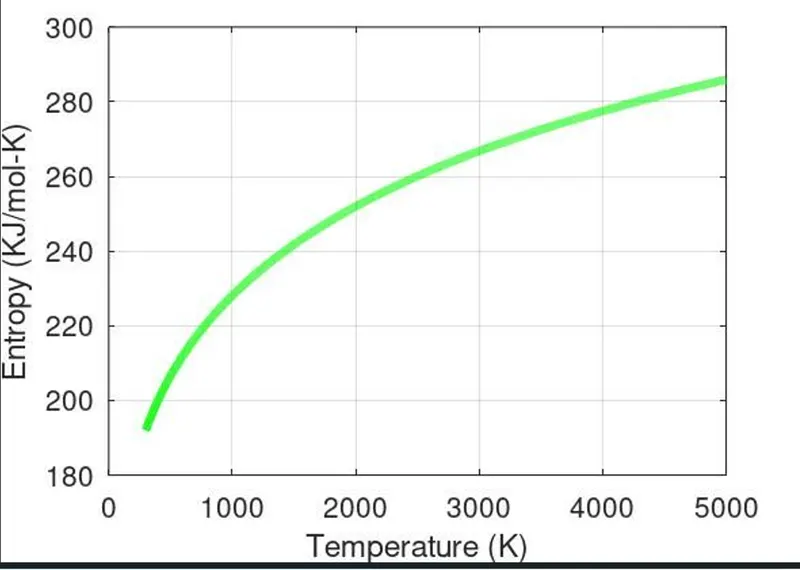
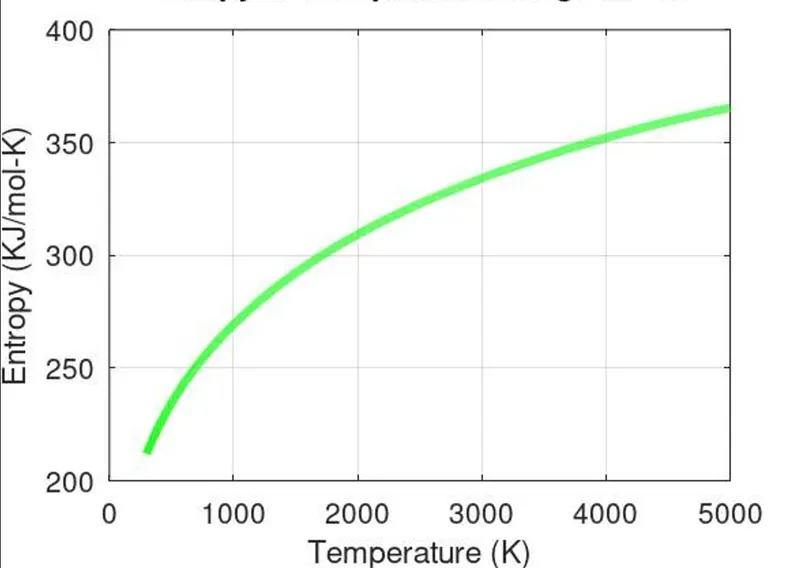
% Plot 2 | S vs T
figure(2)
plot(T,S,'linewidth',3,'color','g');
xlabel('Temperature (K)');
ylabel('Entropy (KJ/mol-K)');
title(sprintf('Entropy vs Temperature range of %s', species));
grid on
saveas(figure(2),'Entropy.jpg');

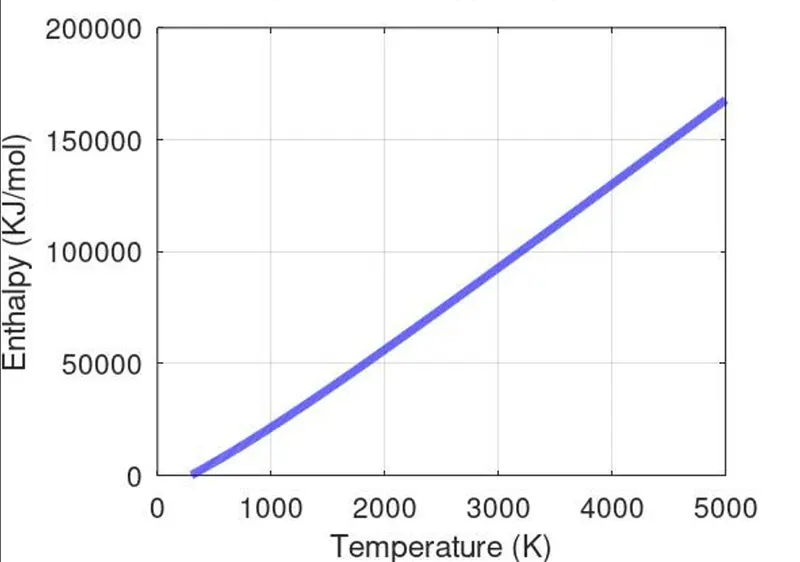
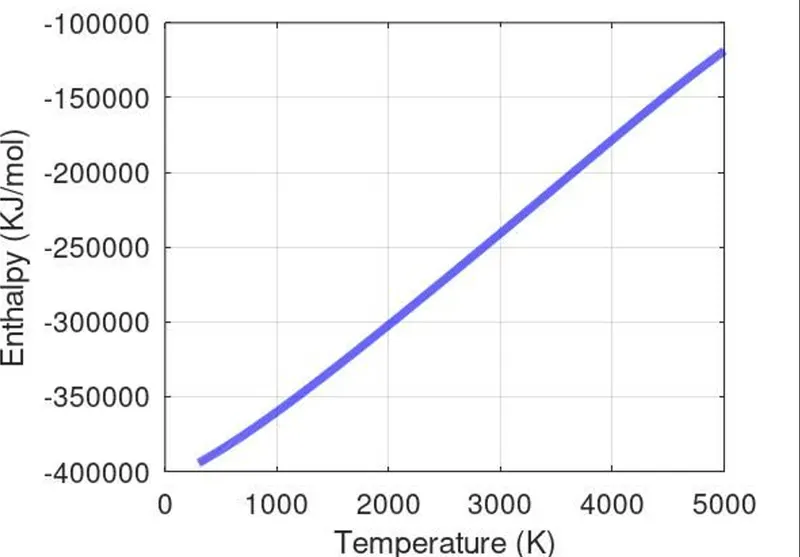
% Plot 3 | H vs T
figure(3)
plot(T,H,'linewidth',3,'color','b');
xlabel('Temperature (K)');
ylabel('Enthalpy (KJ/mol)');
title(sprintf('Enthalpy vs Temperature range of %s', species));
grid on
saveas(figure(3),'Enthalpy.jpg');

cd('C:/Users/sande/OneDrive/Documents/MATLAB/basic command/species')                      % Changing directory to original matlab path

% Molecular Weight
MW = Molecular_weight(species)

end
STEPS:
- Clear all, close all and clc is used to clear all previous commands and plots.
- ‘fopen’ is used to open the file named ‘dat’.
- ‘r’is used for read mode.
- ‘fgetl’is used to read the file line-by-line.
- ‘strplit’ command is used for splitting the string or character vectors at specified delimiter.
- ‘str2num’ command is used to convert character array or string to numeric array.
- Using ‘for & end’ loops to skip the next 3 comments
- ‘linspace’ is used to generate the temperature range.
- ‘for’ loop to read all 53 species one by one and plot them to different folder.
- ‘strfind’ to find one string within another
- All function defined previously like the “specific Heat, Entropy, Enthalpy & Molecular weight” are called one by one.
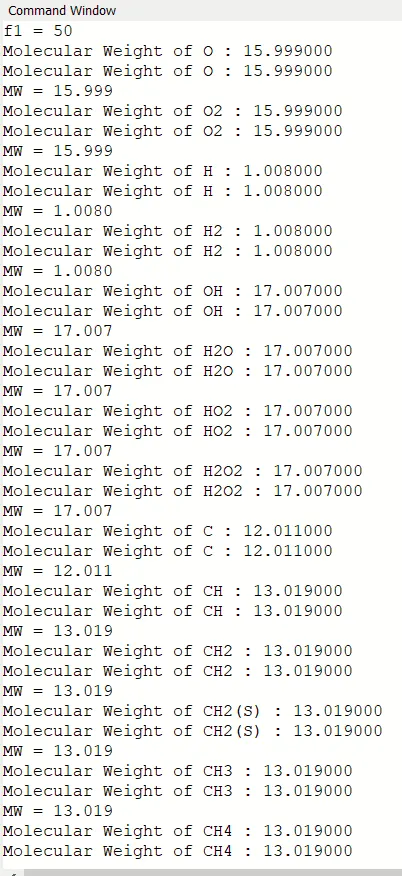
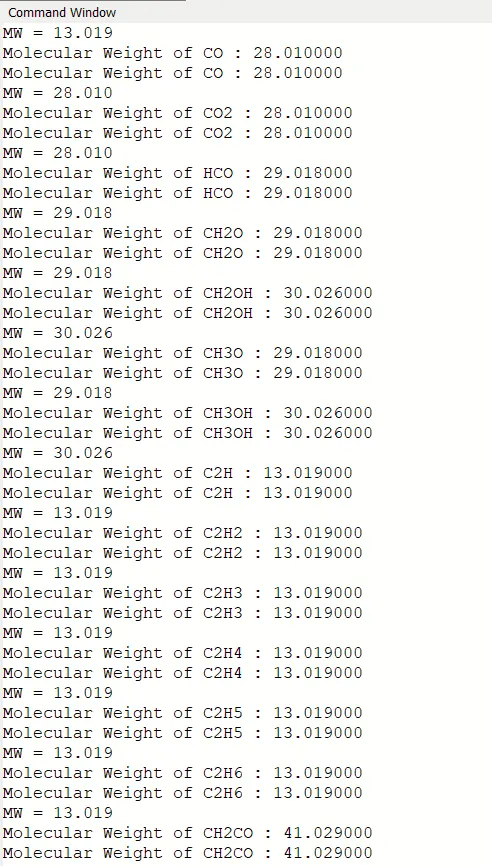
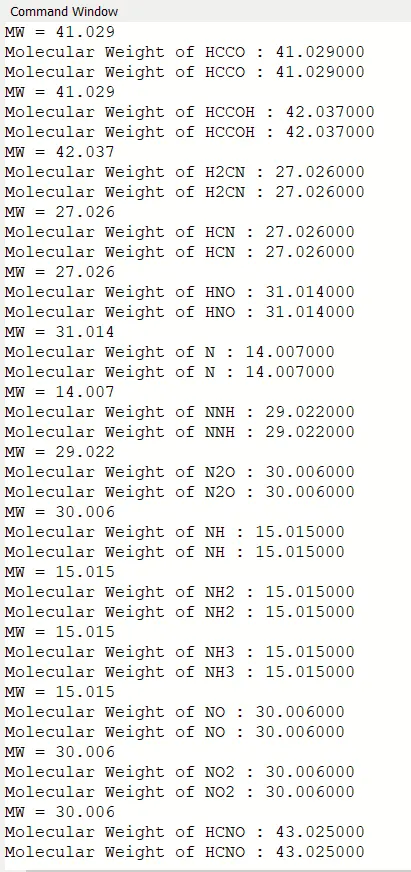
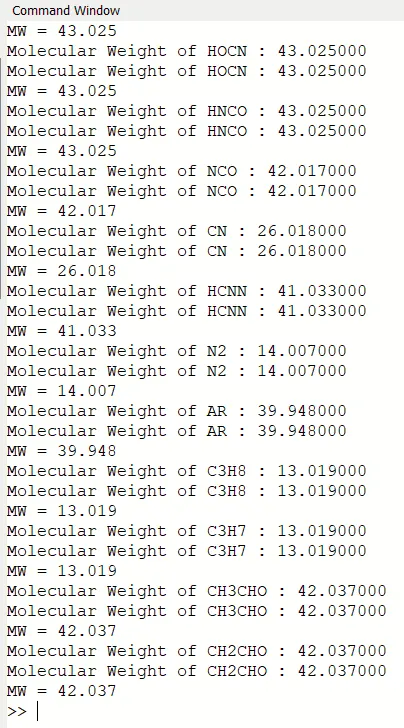
- Calculate and display molecular weight.
- ‘fclose’ is used to close the data file.
Molecular Weights of All SPecies:
Screenshot of directory where different species are saved:

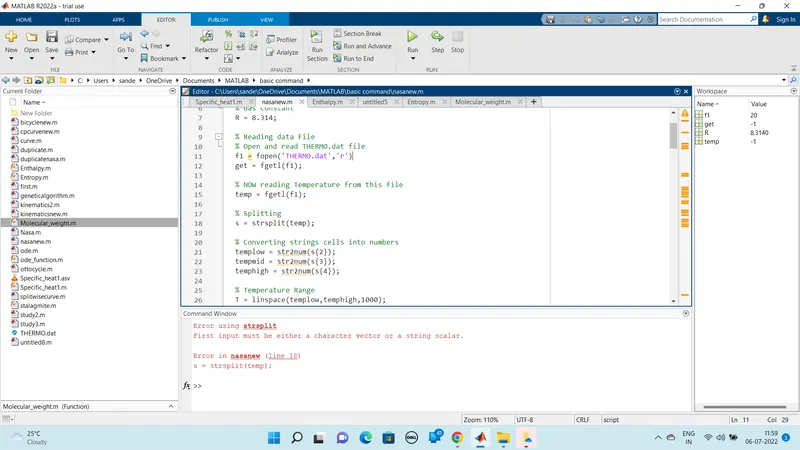
Error:
PLOTS:
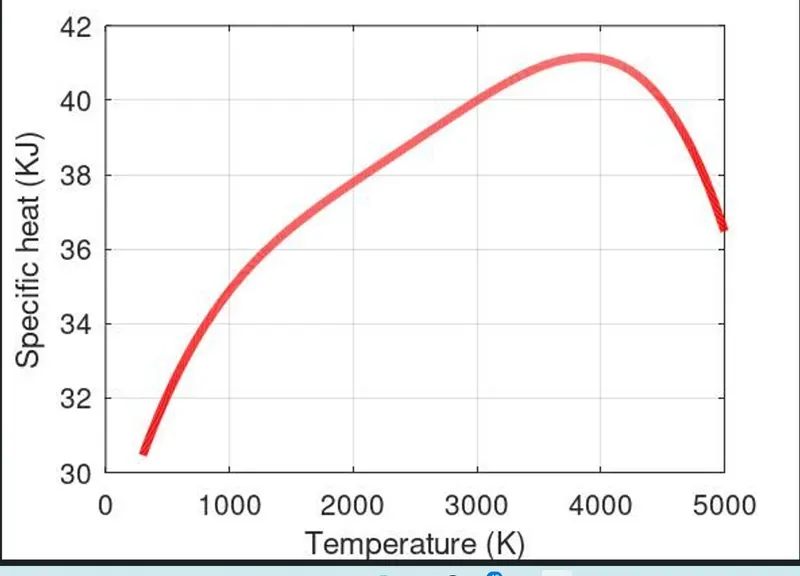
Specific Heat vs Temperature range of O2:
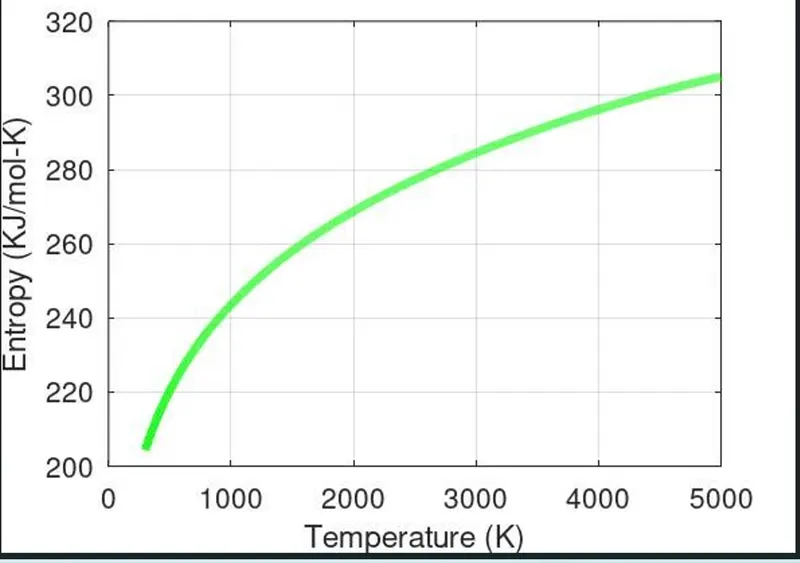
Entropy vs Temperature range of O2:
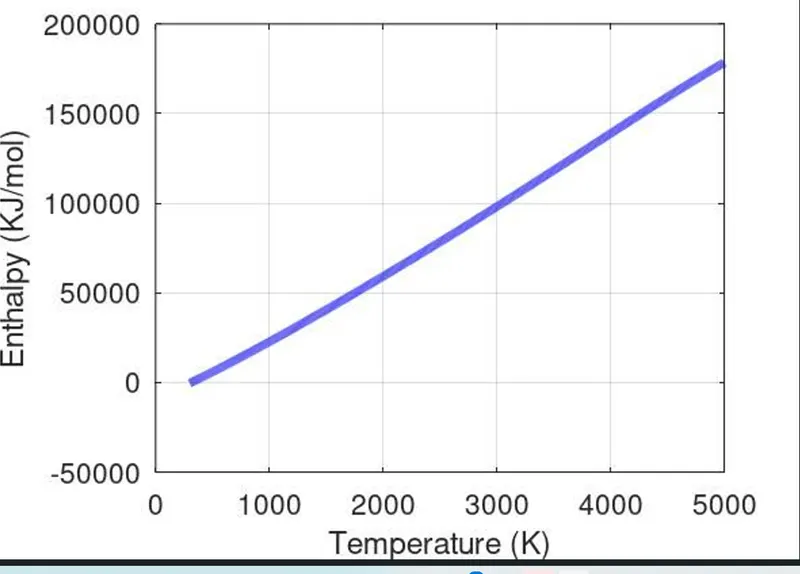
Enthalpy vs Temperature range of O2:
Specific Heat vs Temperature range of N2:
Entropy vs Temperature range of N2:
Enthalpy vs Temperature range of N2:
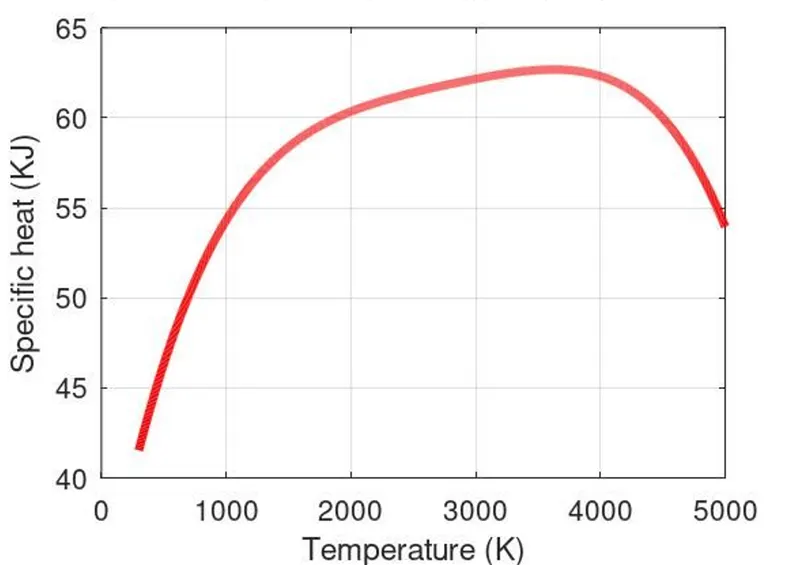
Specific Heat vs Temperature range of CO2:
Entropy vs Temperature range of CO2:
Enthapy vs Temperature range CO2:
Conclusion:
The specific heat, entropy & enthalpy for all the species are calculated and plotted against the local temperature range. The molecular weight is calculated for all the species.
REFERENCES: