Project 1 - Parsing NASA thermodynamic data
PROJECT-1
Parsing NASA Thermodynamic Data
Aim:
NASA came up with polynomials that can be used to evaluate thermodynamic properties such as Cp, H and S. They have also documented the co-efficients that are required to evaluate these polynomials for 1000+ species.
To guide you we have broken down the problem into meaningful bits that you can work on individually.
Write a function that extracts the 14 co-efficients and calculates the enthalpy, entropy and specific heats for all the species in the data file.
So we use fopen to open the THERMO data from the program.
Governing Equations:
Here R is the universal gas constant, T is the temeprature
Cp/R = a1 + a2T + a3T^2 + a4T^3+ a5T^4
H/R = a1 + a2 T/2+ a3 T^2/3+ a4 T^3/4+ a5 T^4/5+ a6 T^5/6
S/R = a1 lnT+a2T+a3T^2/2+a4T^3/3+a5T^4/4 + a7
Objectives Of the Object:
The FIRST 7 coefficients are HIGH-temperature coefficients and the SECOND 7 coefficients are LOW-temperature coefficients.
Also use the LOCAL TEMPERATURE RANGES which is unique for each individual species, not the GLOBAL TEMPERATURE RANGE.
- Calculate the molecular weight of each species and display it in the command window.
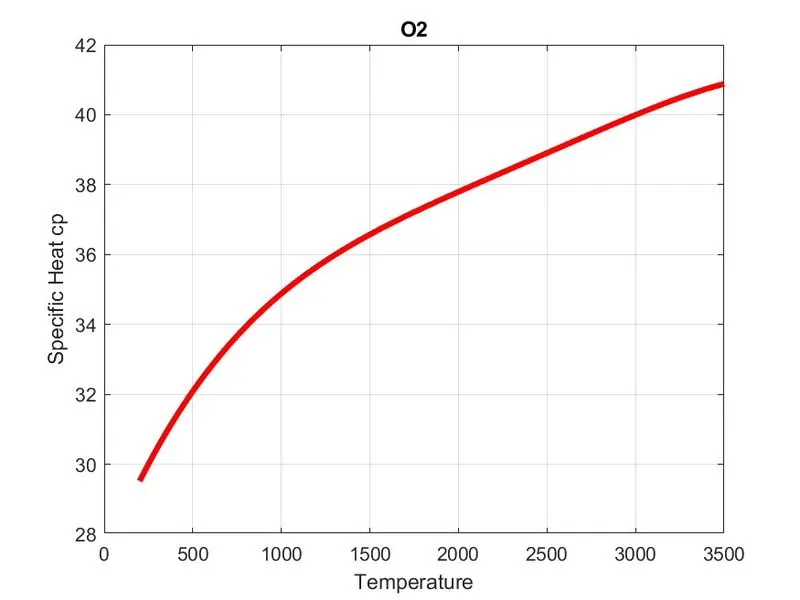
- Plot the Cp, Enthalpy and Entropy for the local temperature range (low temperature : high temperature) specific for each species.
- Save the plots as images with appropriate names and dump them in separate folders for each species with suitable name. All these should be generated automatically.
The main program that you will submit will just take the "THERMO.dat" file as an input and generate Cp, H and S plots.
Body of the Content:
function [S] = entropy(x1,x2,x3,x4,x5,x7,x8,x9,x10,x11,x12,x14,temp,low_temp,R)
if temp>=low_temp
    S = (x1*log(temp)+x2*temp+x3*(temp.^2/2)+x4*(temp.^3/3)+x5*(temp.^4/4)+x7)*R;
else
    S = (x8*log(temp)+x9*temp+x10*(temp.^2/2)+x11*(temp.^3/3)+x12*(temp.^4/4)+x14)*R;
end
end
function [H] = enthalpy(x1,x2,x3,x4,x5,x6,x8,x9,x10,x11,x12,x13,temp,low_temp,R)
if temp<=low_temp
    H = (x8+(x9*(temp/2))+(x10*(temp.^2/3))+(x11*(temp.^3/4))+(x12*(temp.^4/5))+(x13.^temp)).*temp*R;
else
      H = (x1+(x2*(temp/2))+(x3*(temp.^2/3))+(x4*(temp.^3/4))+(x5*(temp.^4/5))+(x6.^temp)).*temp*R;

end
end

function [cp] = specific_heat(x1,x2,x3,x4,x5,x8,x9,x10,x11,x12,temp,low_temp,R)
if temp<=low_temp
    cp = (x8+(x9.*temp)+(x10.*temp.^2)+(x11.*temp.^3)+(x12.*temp.^4))*R;
else
    cp = (x1+x2.*(temp)+x3.*(temp).^2+x4.*(temp).^3+x5.*(temp).^4).*R;

end
end
clear all
close all
clc


% PROJECT 1  PARASING NASA THERMODYNAMIC DATA

% OPENING A FILE
f1 = fopen('THERMO.dat','r');
% Using for loop to read the first five lines
for i = 1:5
    %fdget to read each five line froma file
    a = fgetl(f1);
end
% using for loop toget 1 to 53 species
for i = 1:53
% Getting the first header line which were a character from a different data
header_line = fgetl(f1);
% Splitting the string based on space
a = strsplit(header_line,' ');

% We use curley bracket to detemine the character
% First cell represents species_name
species_name = a{1};
% Were local,lower,medium,higher temperatures, we are converting them into string numbers
 z = length(a);
low_temp = str2double(a(end-3));
mid_temp = str2double(a(end-1));
high_temp = str2double(a(end-2));
% Giving The values from the data file and converting character into numbers
co_effic_line1 = fgetl(f1);

position_E1 = strfind(co_effic_line1,'E');
% strdouble is used convert char to num
a1 = str2double(co_effic_line1(1:(position_E1(1)+3)));
a2 = str2double(co_effic_line1((position_E1(1)+4):(position_E1(2)+3)));
a3 = str2double(co_effic_line1((position_E1(2)+4):(position_E1(3)+3)));
a4 = str2double(co_effic_line1((position_E1(3)+4):(position_E1(4)+3)));
a5 = str2double(co_effic_line1((position_E1(4)+4):(position_E1(5)+3)));

co_effic_line2 = fgetl(f1);

position_E2 = strfind(co_effic_line2,'E');

a6 = str2double(co_effic_line2((position_E2(1)+3)));
a7 = str2double(co_effic_line2((position_E2(1)+4):(position_E2(2)+3)));
a8 = str2double(co_effic_line2((position_E2(2)+4):(position_E2(3)+3)));
a9 = str2double(co_effic_line2((position_E2(3)+4):(position_E2(4)+3)));
a10 = str2double(co_effic_line2((position_E2(4)+4):(position_E2(5)+3)));


co_effic_line3 = fgetl(f1);

position_E3 = strfind(co_effic_line3,'E');
a11 = str2double(co_effic_line3((position_E3(1)+3)));
a12 = str2double(co_effic_line3((position_E3(1)+4):(position_E3(2)+3)));
a13 = str2double(co_effic_line3((position_E3(2)+4):(position_E3(3)+3)));
a14 = str2double(co_effic_line3((position_E3(3)+4):(position_E3(4)+3)));
% Teperature Value
T = linspace(low_temp,high_temp,500);

%Calculation of specific heat, enthalpy,entropy;
R = 8.314;% Universal gas constant value in J mol^-1K^-1
% creating Temperature values for plot from function
[cp]= specific_heat(a1,a2,a3,a4,a5,a8,a9,a10,a11,a12,T,low_temp,R);
[H]  = enthalpy(a1,a2,a3,a4,a5,a6,a8,a9,a10,a11,a12,a13,T,low_temp,R);
[S]  = entropy(a1,a2,a3,a4,a5,a7,a8,a9,a10,a11,a12,a14,T,low_temp,R);
% Creating a directory for the species
mkdir(species_name)
cd(species_name)

% plotting cp vs T for the species
figure(1)
plot(T,cp,'LineWidth',3,'Color','r')
grid on
title(species_name)
xlabel('Temperature')
ylabel('Specific Heat cp')

% plotting H vs T for species
figure(2)
plot(T,H,'LineWidth',3,'Color','r')
grid on
title(species_name)
xlabel('Temperature')
ylabel('Enthalpy H')

% plotting H vs T for species
figure(3)
plot(T,S,'LineWidth',3,'Color','r')
grid on;
title(species_name)
xlabel('Temperature')
ylabel('Entropy S')
% mkdir(species_name)
% Changing the directory
% cd(['C:\Users\roger\Desktop\mathlab practice\ %s',species_name]);

% Saving the Plots as a image in the Species_name folder
grid on;
saveas(1,'Specific Heat.jpg');
grid on;
saveas(2,'Enthalpy.jpg');
grid on;
saveas(3,'Entropy.jpg');
cd ..
%% Calculating The molecular Weight
elements = ["H","C","N","O","A"];
molecular_weight = 0;
% Atomic_weight = [1,12,14,16,40];
Mass = [1.0,29.36,52.37,14.008,15.78,40.63];

for i =1:length(species_name)
    for j = 1:length(elements)
        if strcmpi(species_name(i),elements(j))
            molecular_weight = molecular_weight+Mass(j);
            y=j;
        end
    end

    number = str2double(species_name(i));
    if (number>1)
        molecular_weight = molecular_weight+(Mass(y))*(number-1);
    end
    sprintf("molecular weightof %s is %d",species_name,molecular_weight);

end
end
fclose(f1);
Plots:
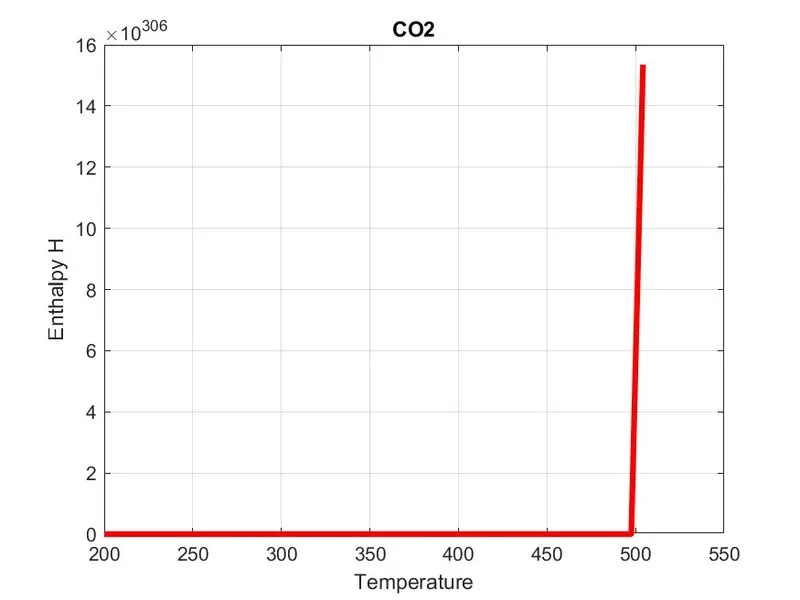
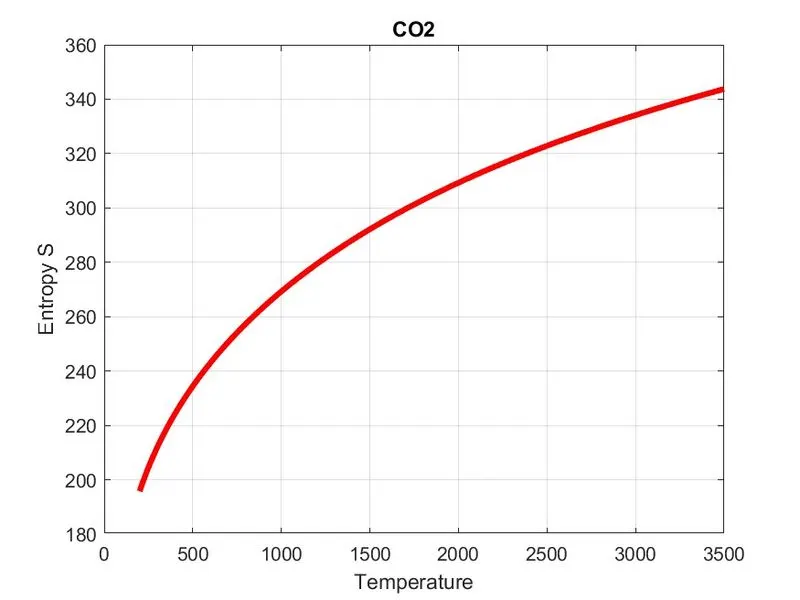
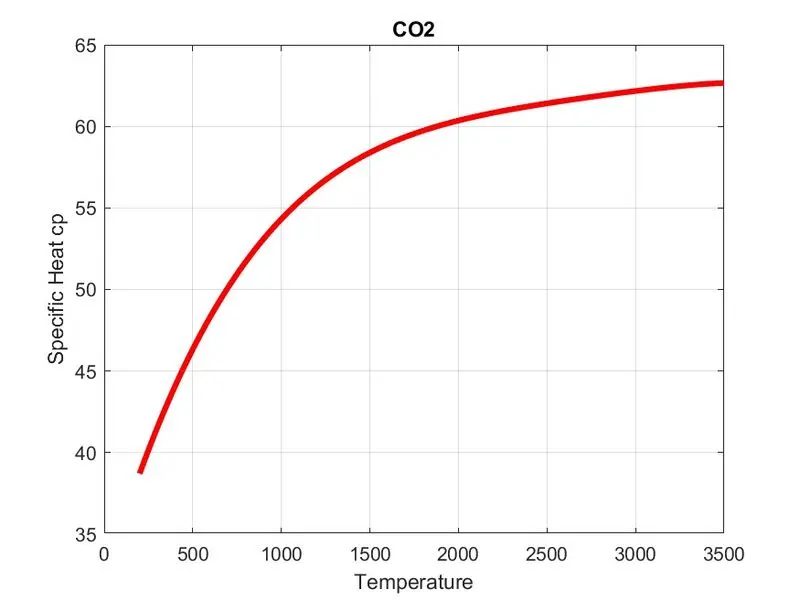
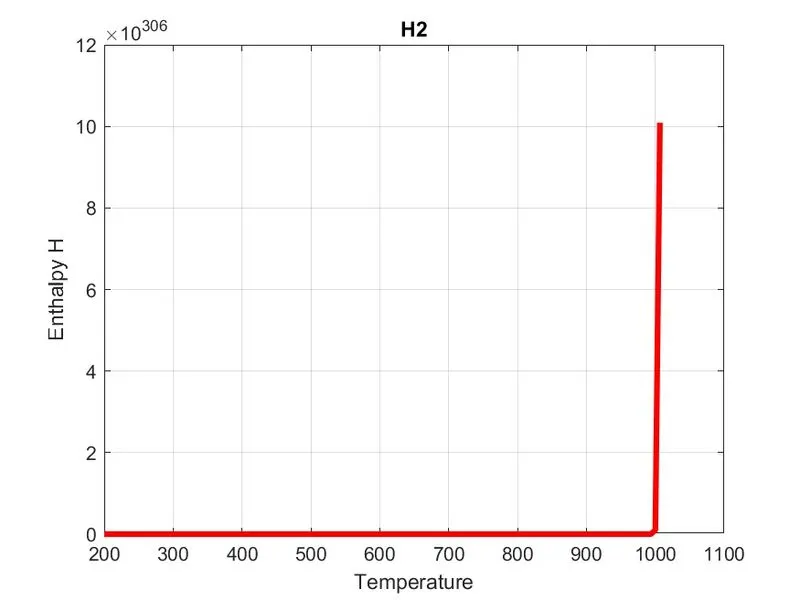
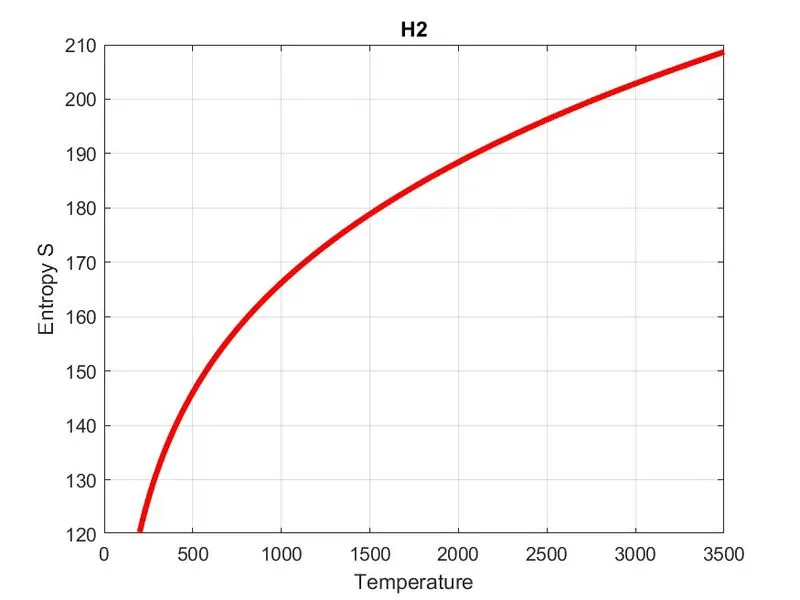
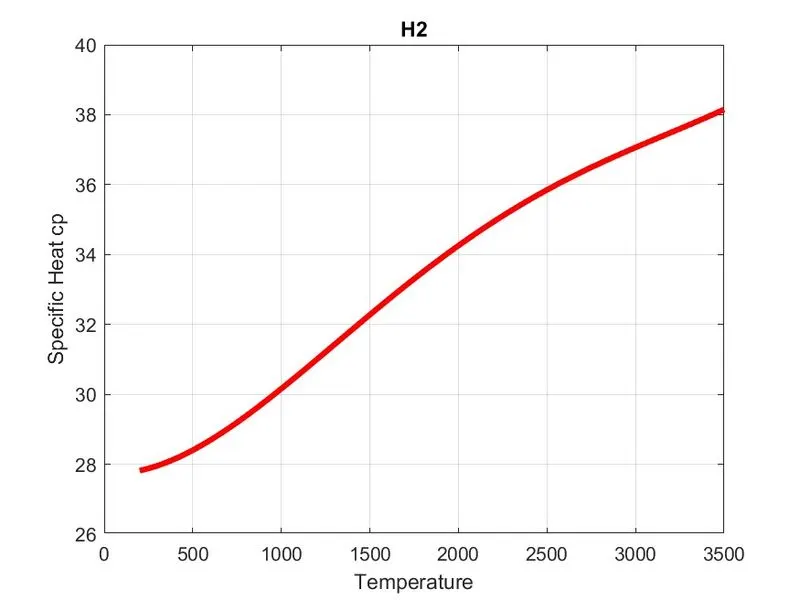
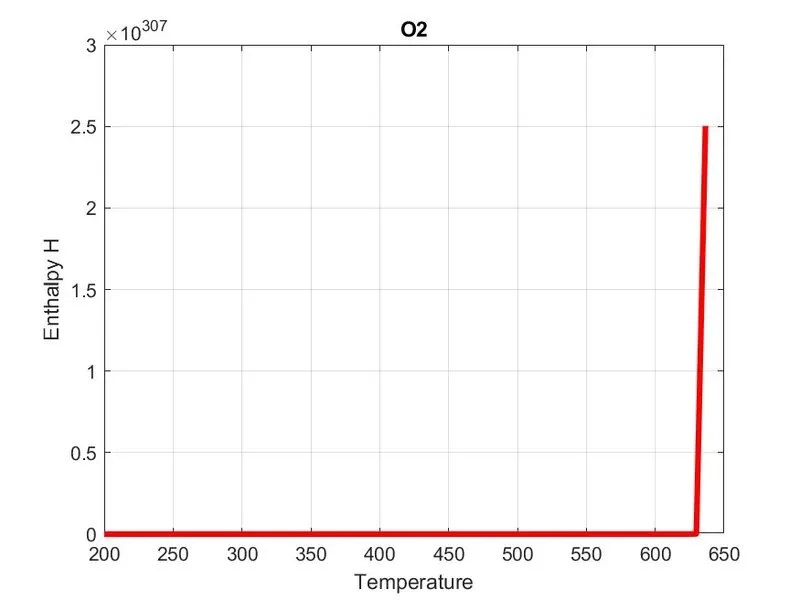
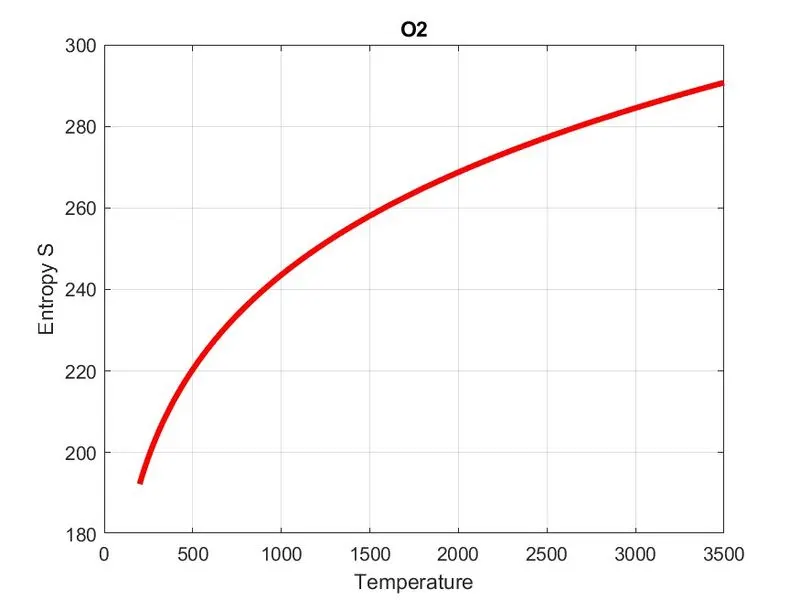
Conclusion:
The result has been achieved we able to calculate the values for specific heat, enthalpy, entropy, for the given species were each and every species plot has been stored in sperate folder using mkdir and cd inbuilt command from MATLAB and also able to calculate the molecular weight for the species and shown in the result.
The errors occurs while the running the code is were the strdouble were not typed so the values are in characters instead of numbers. And also some of the mistakes in functions like giving extra values we able to clear the values and start run the program.
The function, if, else, for loop were used as main part of the code to solve it simply.