Project 1 - Data Cleaning and Transformation using Pivot table and Charts for the Report on requirement of Team Hiring
Answers
All the answers are done in a single excel sheet. that is attached with this.
d) maded a customized ribbon called ABC
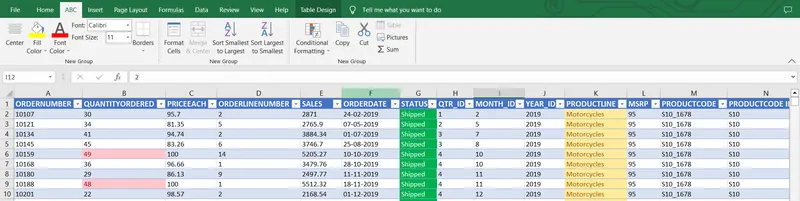
h) answer is callcuated using pivot table. {other wise we can use SUMIF () to calculate Specific region =SUMIF(range,criteria,[Sum_range])}
All the Questions answers are in the excel workbook