Project 1 - Data Cleaning and Transformation using Pivot table and Charts for the Report on requirement of Team Hiring
A. Formatting for the data
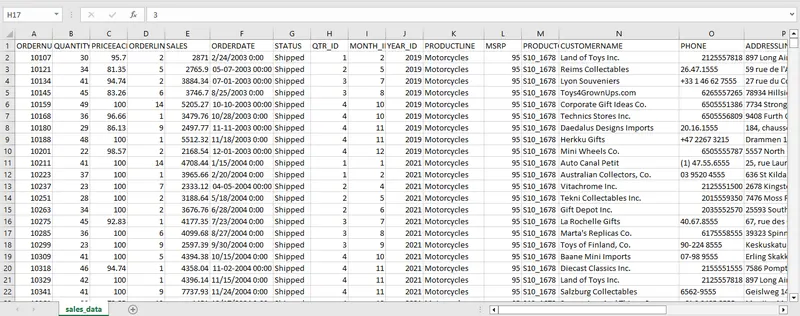
Screen Shot before formatting data
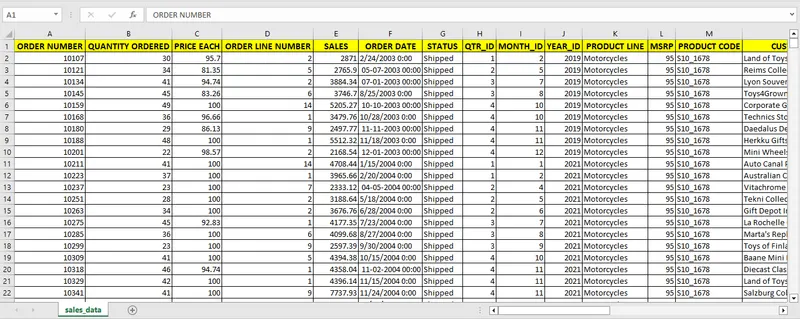
Screen shot after Formatting the Data
B. The Operations on Sales
i. Total Sum of Sales -> =SUM(E2:E2824) -> 10032628.85
ii. Average of Sales -> =AVERAGE(E2:E2824) -> 3553.889072
iii. Standard Deviation of Sales -> =STDEV.P(E2:E2824) -> 1841.538852
iv. Variance of Sales -> =VAR.P(E2:E2824) -> 3391265.334
v. Maximum of Sales -> =MAX(E2:E2824) -> 14082.8
vi. Minimum of Sales -> =MIN(E2:E2824) -> 482.13
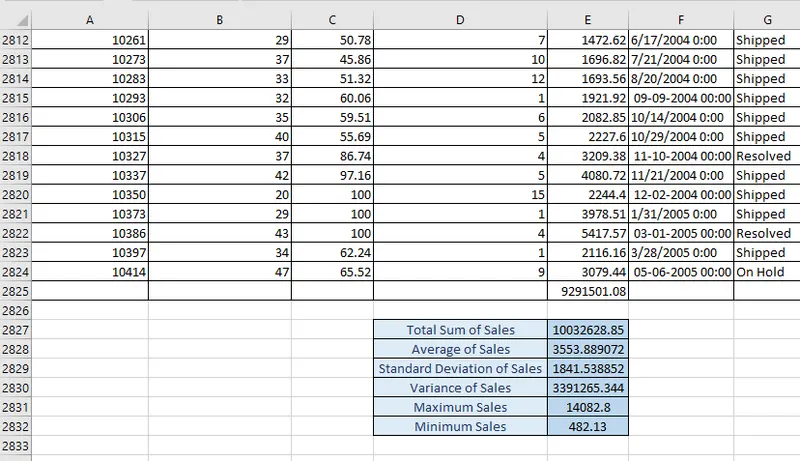
Screen shot of the Operation on sales values
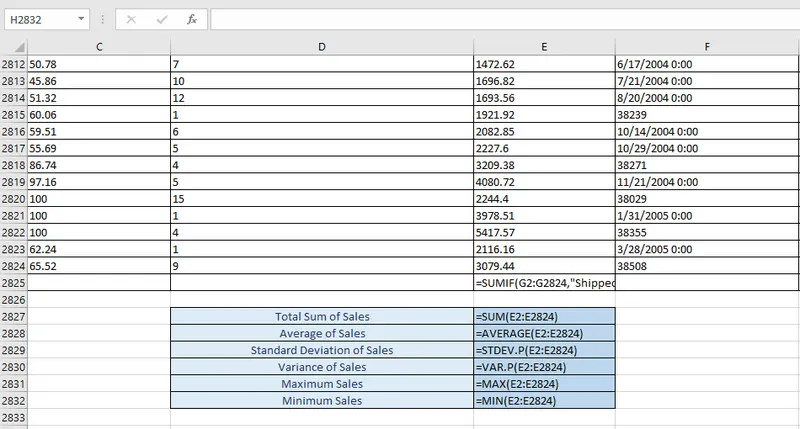
Screen shot of the Operation on sales Formulas
C. Pivot Table For the ProductLine and Sales
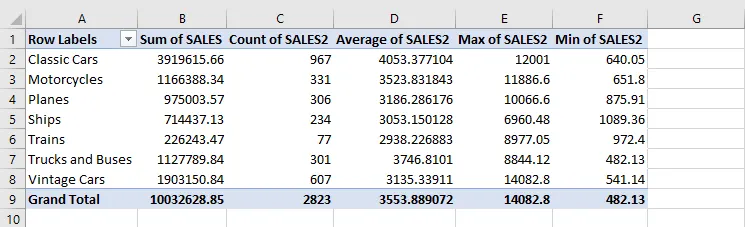
Screen Shot of the Pivot Table on Product Line and Sales
D. Ribbon for Title of The data Set
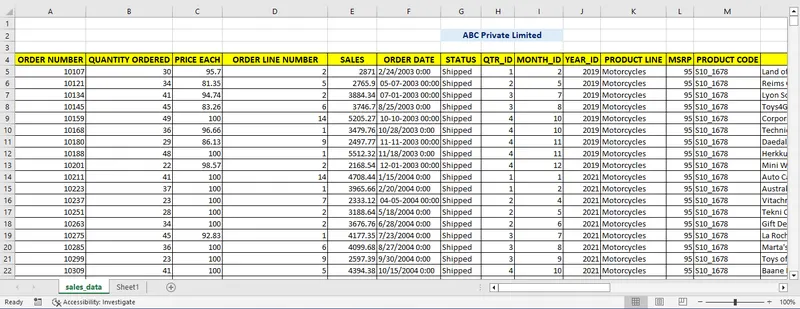
Screenshot of The Ribbon with title on the Data set
E. Quantities ordered by Each Country in years 2019, 2020, 2021 in different Quarters
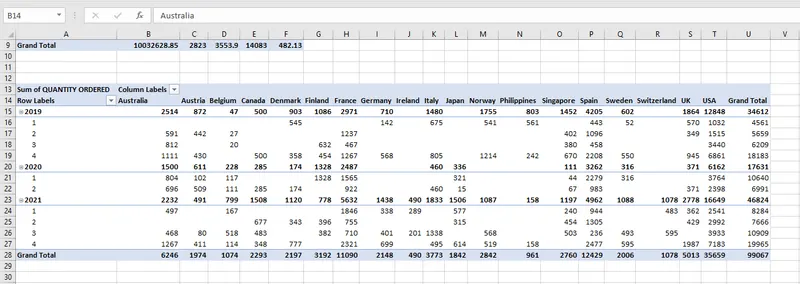
Screen shot of the Pivot Table for Quantities ordered by each country in years 2019, 2020, 2021 in different quarters.
F. Conditional Formatiing for the Column ProductLine
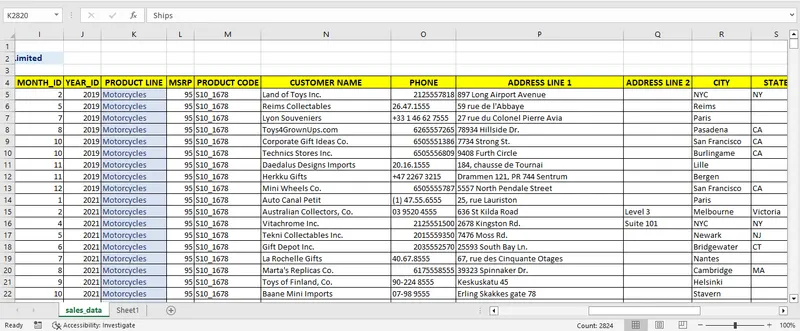
Screen Shot of Conditional Formatting Output
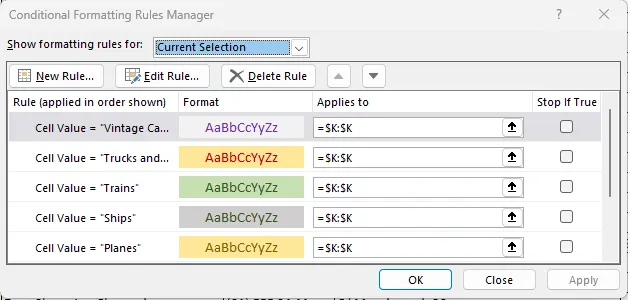
Screen Shot of Conditioal formatting rules
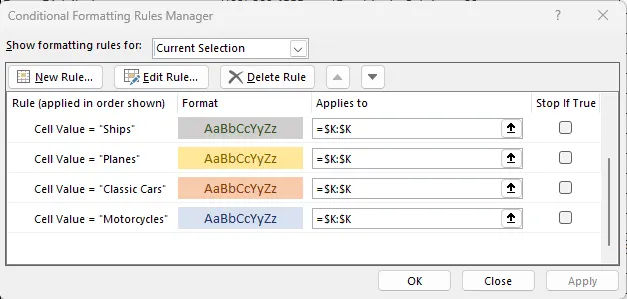
Screen shot of Conditional Formatting Rules
G. Replacing the year values 2003 with 2019, 2004 with 2020, 2005 with 2021 in order date.
Screen Shot of the year values in order date before replacing
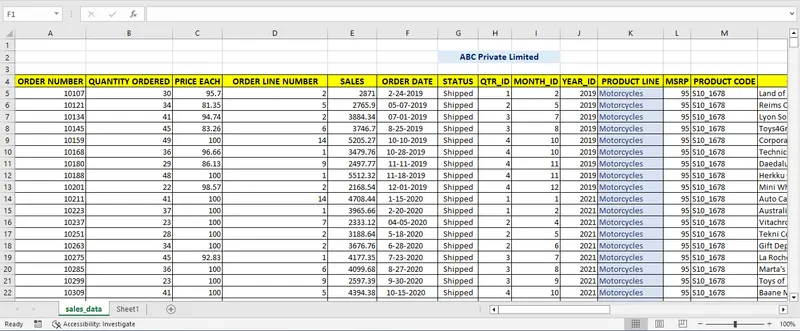
Screen Shot of the year values in order date after replacing
H. To Calculate the total Sales of the Status “Shipped”, “Cancelled”, “Disputed”, “In Process”, “On Hold”, “Resolved” products.
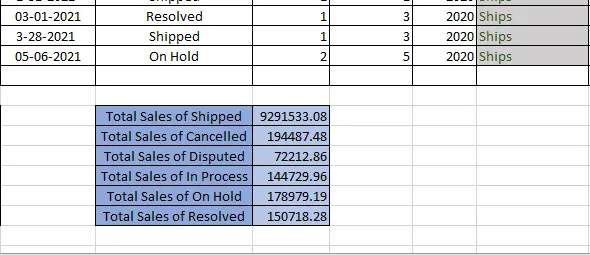
Screen shot of the Total Sales Calculated for the status
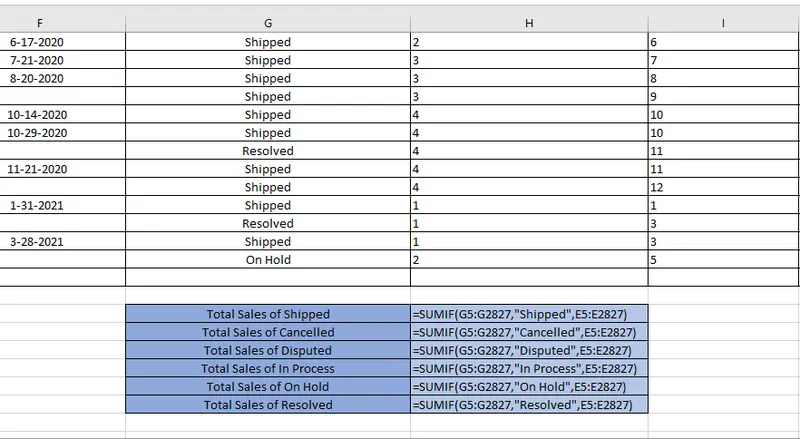
Screen shot of the Total Sales Calculated for the status
I. Adding two more columns for splitting data on Product Code.
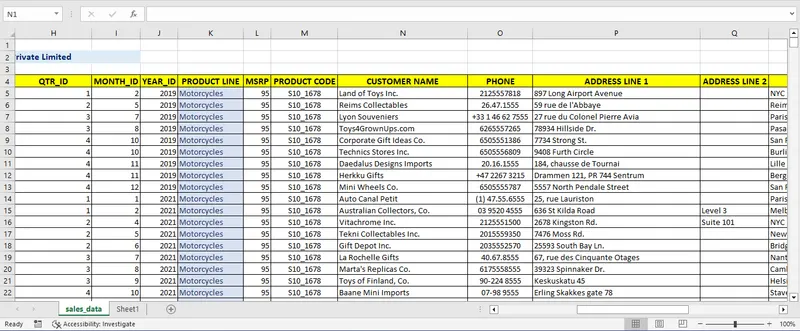
Screen Shot of Product Code Before splitting the data and adding in new columns
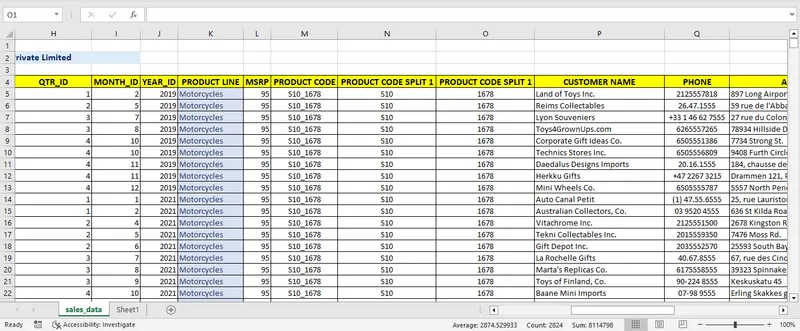
Screen Shot of Product Code after splitting the data and adding in new columns
J. Top 10% values Highlighted Quantity Ordered field using conditional formatting
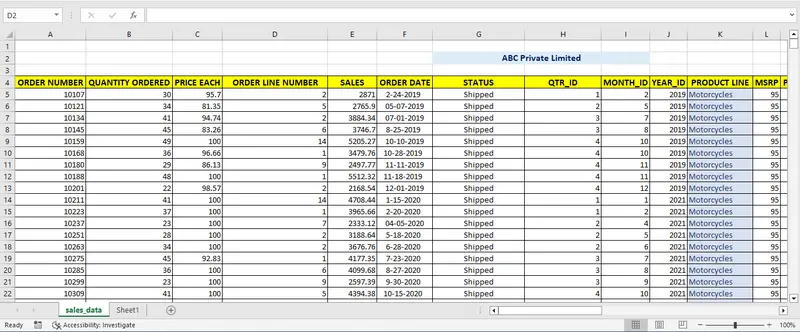
Screen shot of the 10% Values Before Highlighted Quantity Ordered
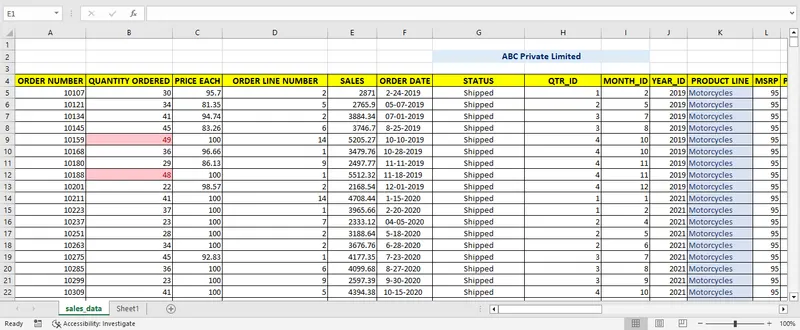
Screen shot of the 10% Values Before Highlighted Quantity Ordered