Project 1 - Data Cleaning and Transformation using Pivot table and Charts for the Report on requirement of Team Hiring
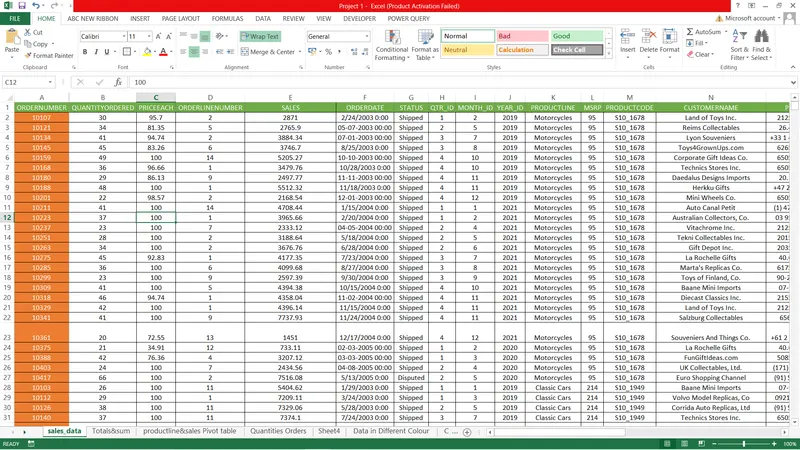
A.Data with using borders, font size and appropriate alignment of the content:-
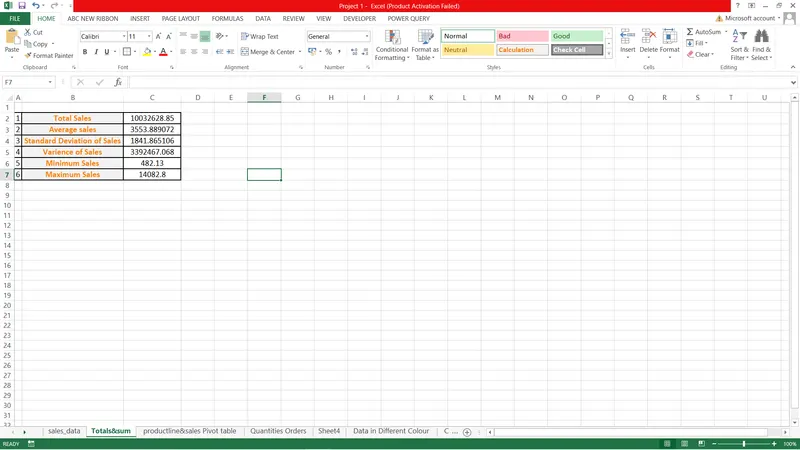
B. Make summary of Products Sales:-
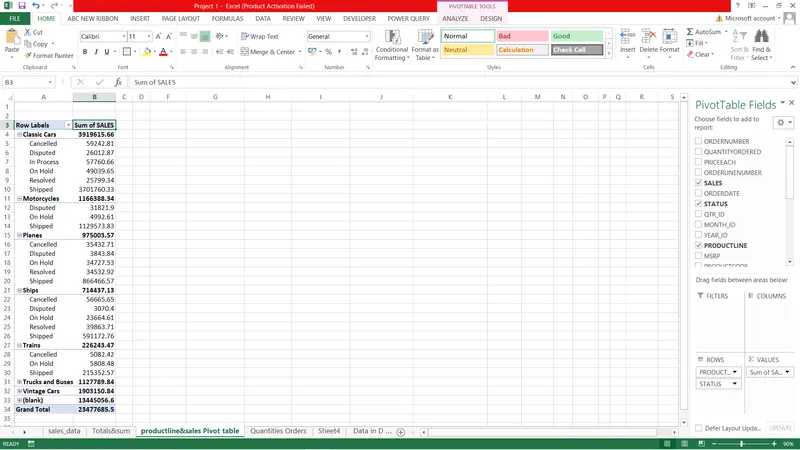
C.Table based on fields Status, ProductLine and Sales using Pivot Table:-
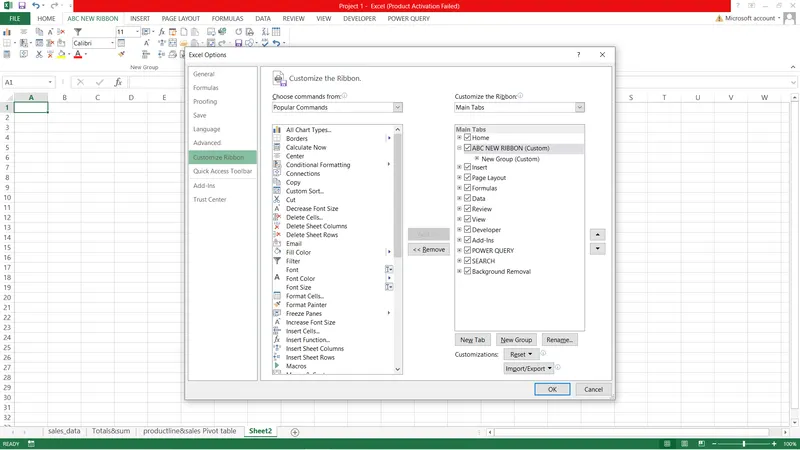
D. Customized Ribbon by naming ABC and keep all data formatting commands:-
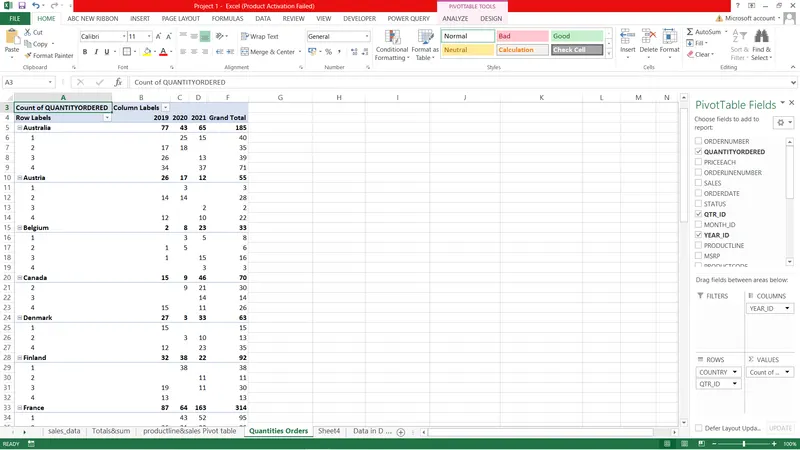
E.Analyse the Quantities ordered by each Country in Year 2019,2020 and 2021:-
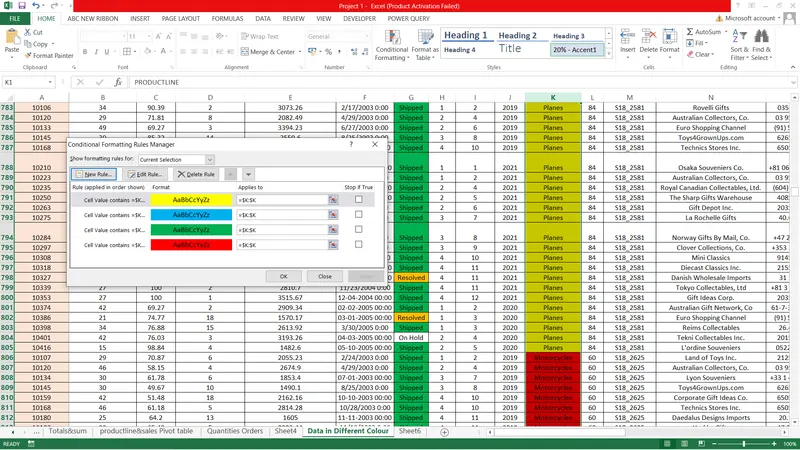
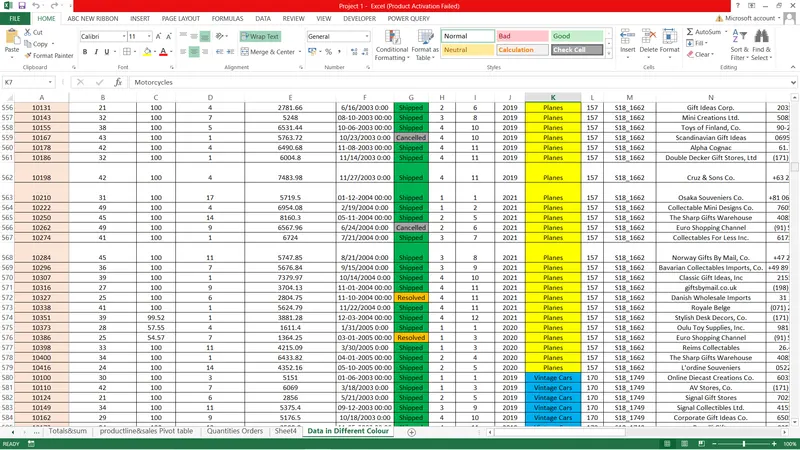
F.data in different colours for values in field Status and ProductLine using conditional formatting:-
Status conditional formatting:-
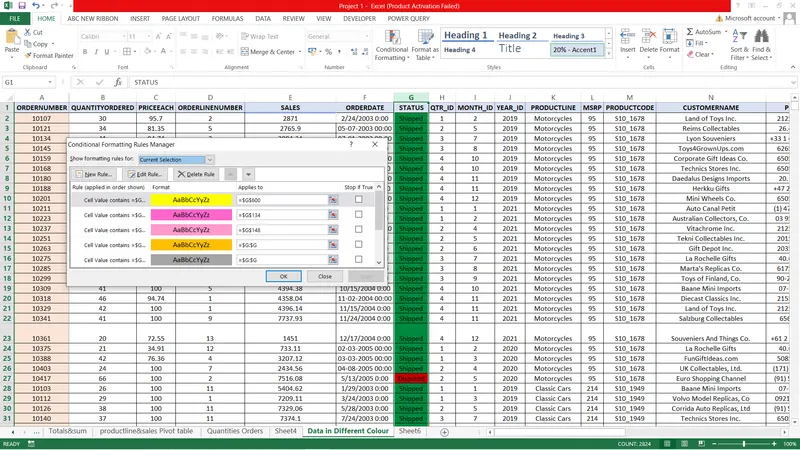
ProductLine using conditional formatting:-
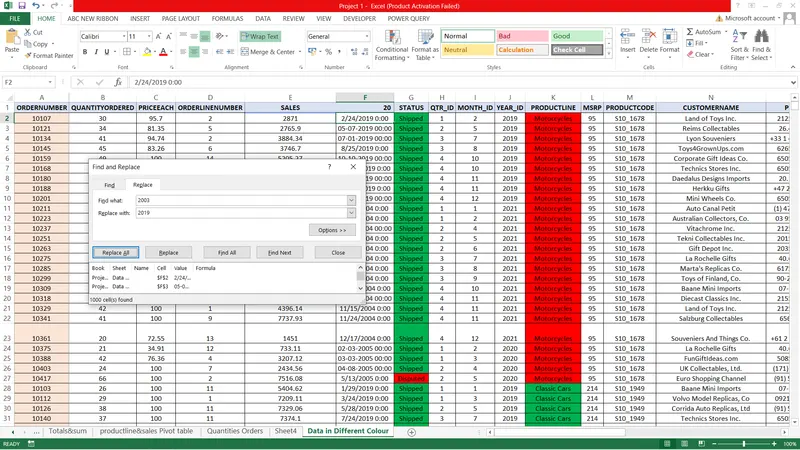
G.date formatting and change values of 2003 to 2019, 2004 to 2020 and 2005 to 2021:-
2003 to 2019
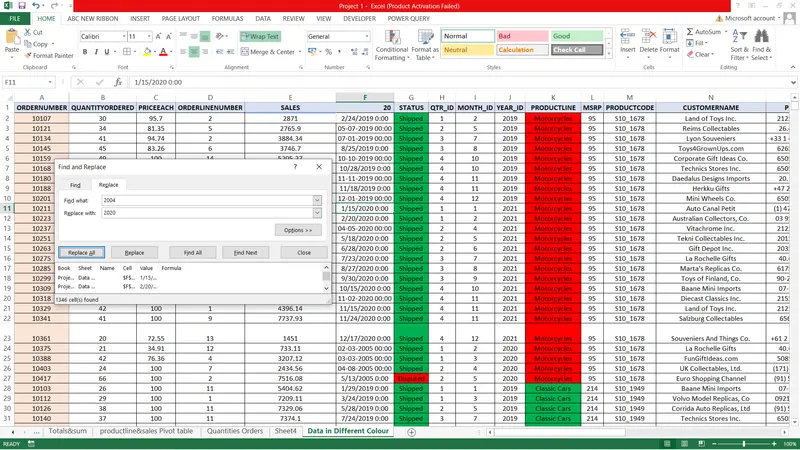
2004 to 2020
2005 to 2021
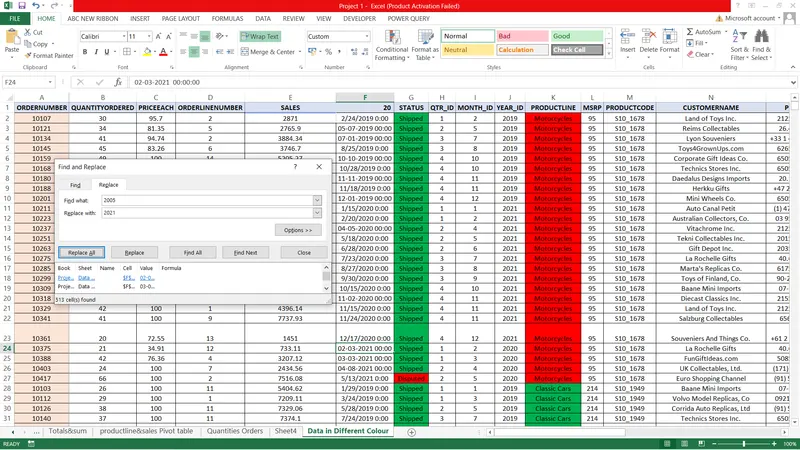
over all
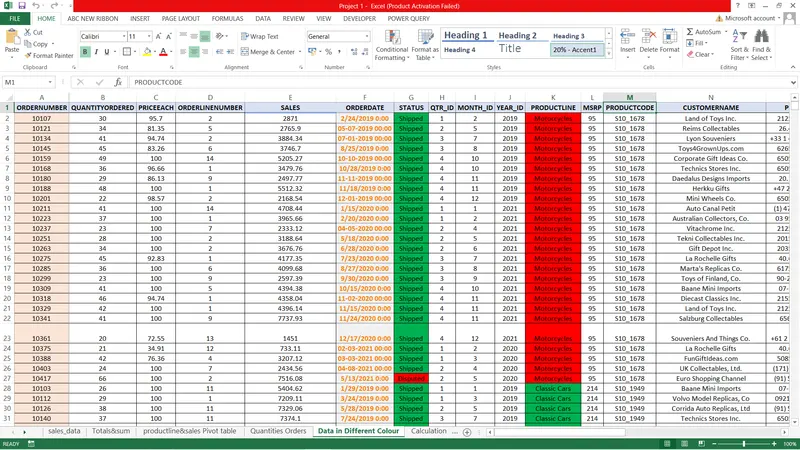
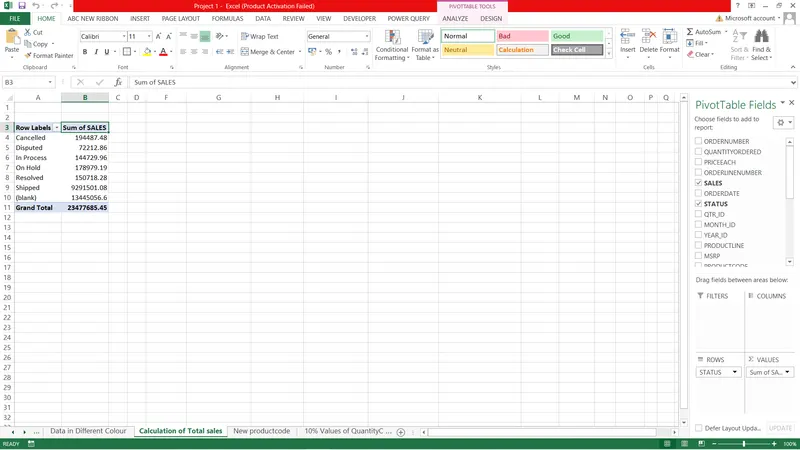
H.Calculate the total sales of all “Shipped”, “Cancelled”, “Disputed”, “In Process”, “On Hold”, “Resolved” products:-
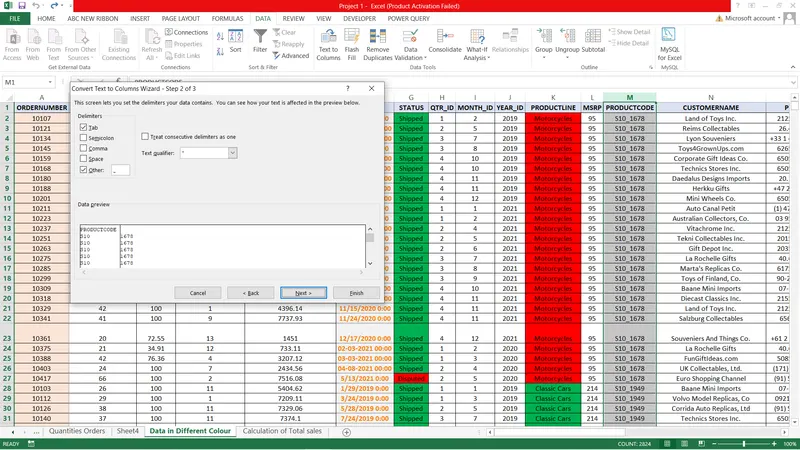
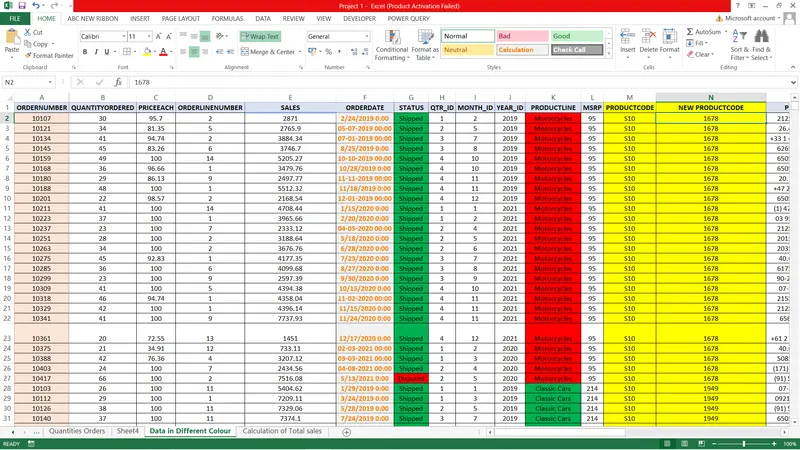
I.Add two new fields in data sheet with reference to Productcode using text functions:-
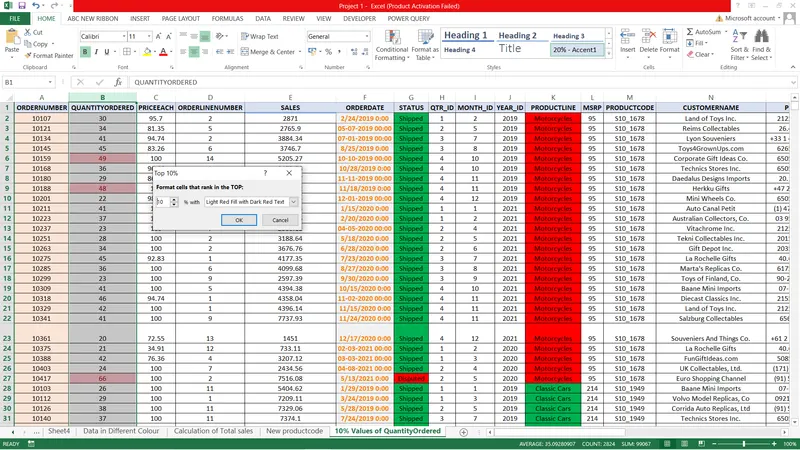
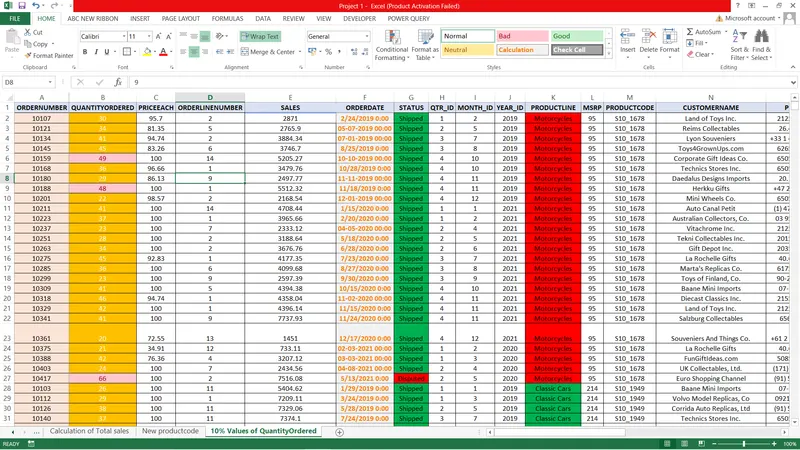
J.Highlight the top 10% values of QuantityOrdered field using Conditional Formatting:-