Project 1 - Data Cleaning and Transformation using Pivot table and Charts for the Report on requirement of Team Hiring
AIM:
Data Cleaning and Transformation using Pivot table and Charts for the Report on requirement of Team Hiring using MSExcel
DISCRIPTION:
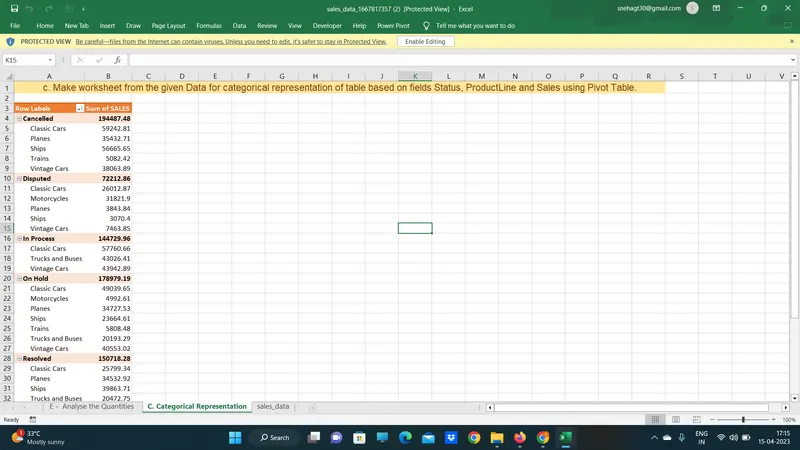
- Make worksheet from the given Rata for categorical representation of table based on Felds Status, ProductLine and Sales using Pivot Table.
- Make Customized Ribbon by naming and keep all data formatting commands in the newly created Ribbon.
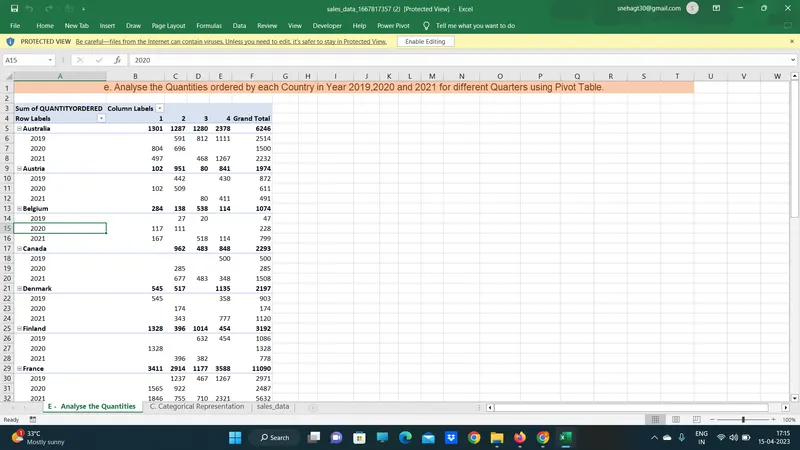
- Practiced Data cleaning activities, Operations using pivot table and charts by this project.
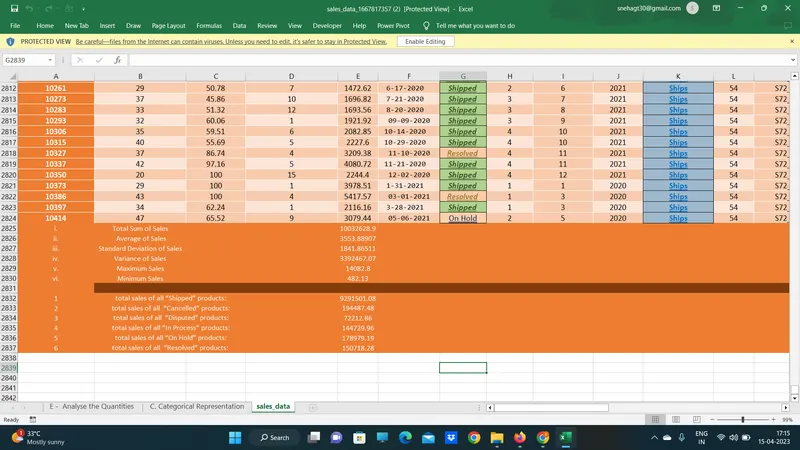
- Worked with functions like SUM, SUMIF, MAX, MIN, STDEV, VAR, AVERAGE and features like Pivot table, Conditional formatting etc.
- It looks around 2 hours to complete this project which involves Data cleaning to getting the precise data.
CONCLUSION:
Overall, this project demonstrates the importance of data cleaning and transformation in making informed decisions. By using tools like pivot tables and charts in MS Excel, we can extract valuable insights from large datasets and use them to improve the efficiency and productivity of an organization.