Project 1 - Data Cleaning and Transformation using Pivot table and Charts for the Report on requirement of Team Hiring
Company ABC Private Limited is manufacturing and selling below mentioned Products:
- Classic Cars
- Motorcycles
- Planes
- Ships
- Trains
- Trucks and Buses
- Vintage Cars
As Business Analyst of the Company, you are required to perform following mentioned tasks on the provided dataset.
a. Do proper formatting of the data with using borders, font size and appropriate alignment of the content.
in sheet sales_data
b. Make summary of Products Sales by providing
- Total Sum of Sales
- Average of Sales
- Standard Deviation of Sales
- Variance of Sales
- Maximum Sales
- Minimum Sales
in sheet b
c. Analyse the sales happened by product line & status using pivot table
in sheet c
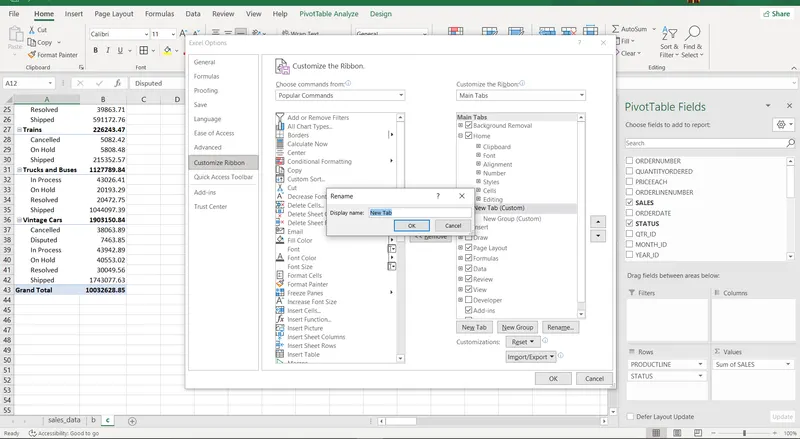
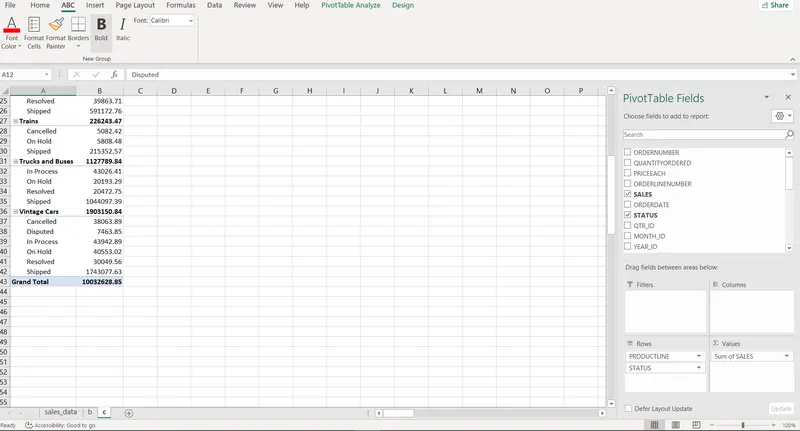
d. Make Customized Tab by naming ABC and keep few data formatting commands in the newly created Tab.
screen shots attached and in image 2 tab is shown
e. Analyse the Quantities ordered by each Country in Year 2019,2020 and 2021 for different Quarters using Pivot Table.
in sheet e
f. Present the data in different colours for values in field Status and ProductLine using conditional formatting.
don in sheet sales_data using conditional formatting
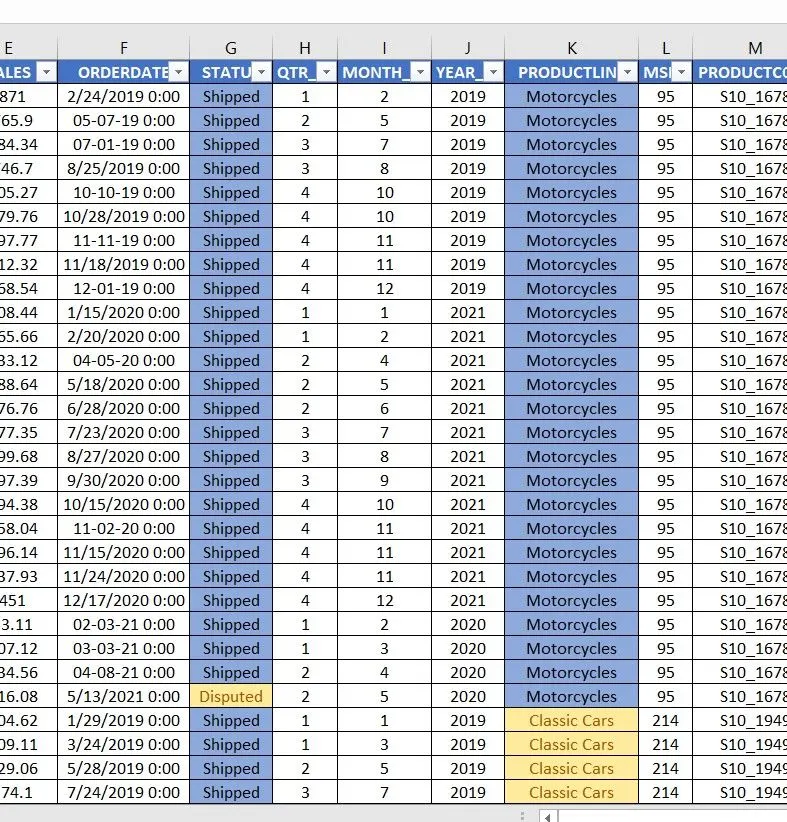
g. change values of 2003 to 2019, 2004 to 2020 and 2005 to 2021 by using proper date formatting options.
screen shots attached
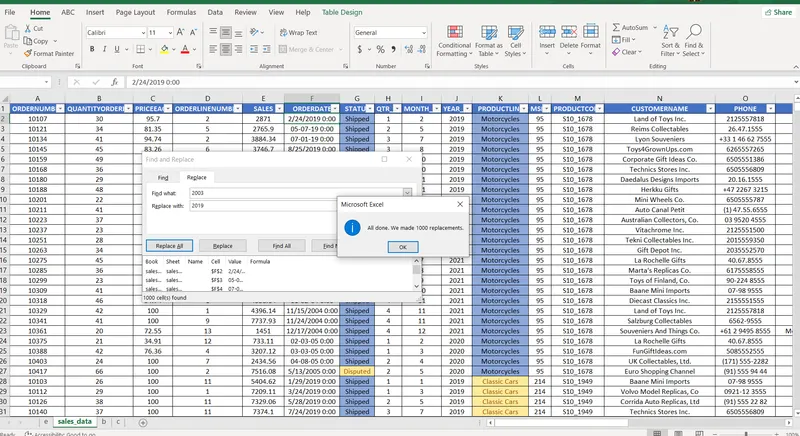
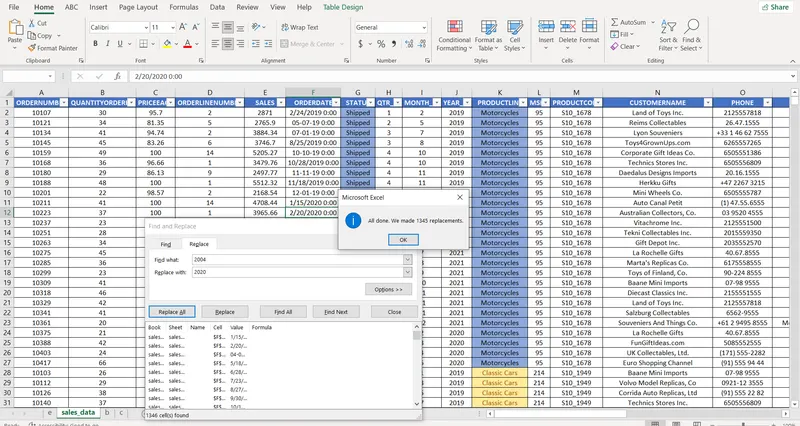
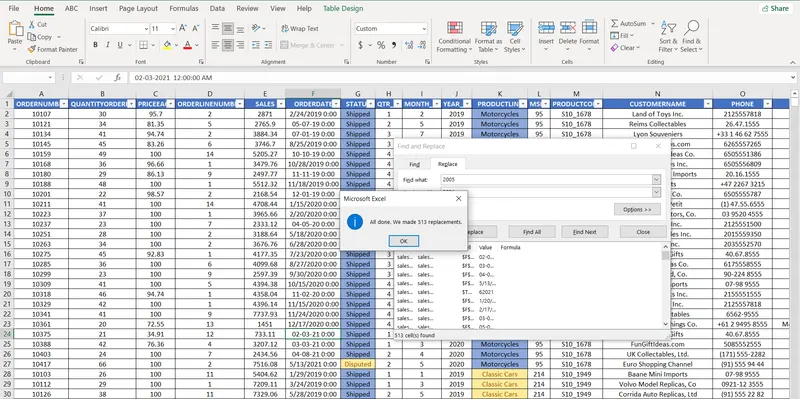
h. Calculate the total sales of all “Shipped”, “Cancelled”, “Disputed”, “In Process”, “On Hold”, “Resolved” products. (Hint:Use pivot table or sumif function)
in sheet h
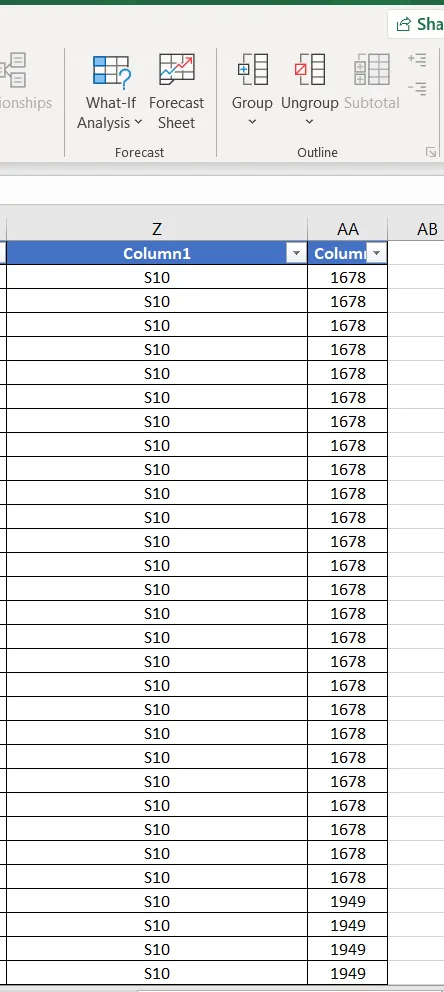
i. Split the productcode field into two using text functions Example :S10_1678 -> S10 in one column and 1678 in another column.
in sheet sales_data and screen shots attached
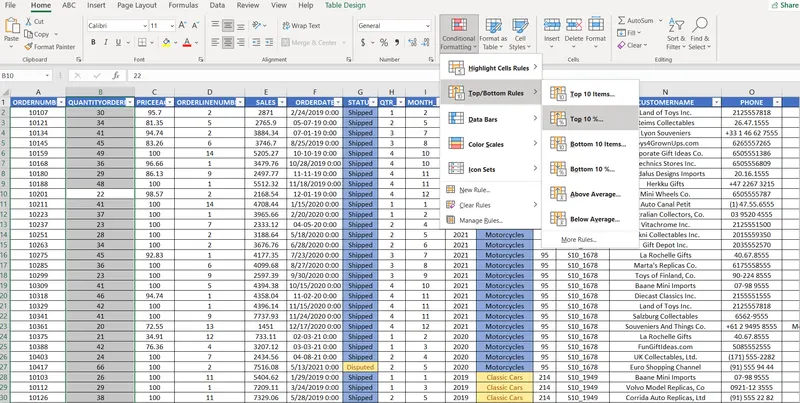
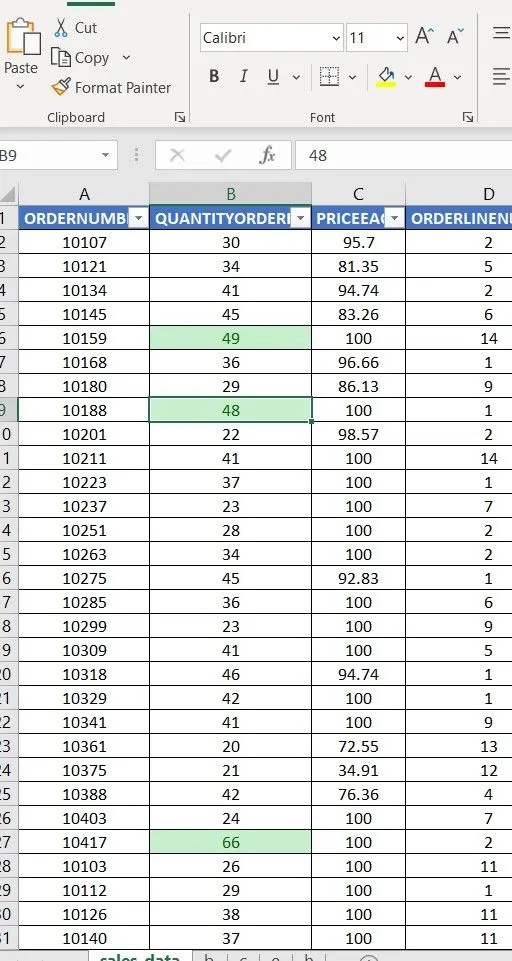
j. Highlight the top 10% values of QuantityOrdered field using Conditional Formatting
done using conditional formatting in sheet sales_data and screen shots attached