Project 1 - COVID-19 Vaccinations Trend Analysis
SKILL-LYNC POWERBI PROJECT-2 REPORT

COVID-19 VACCINATIONS TREND ANALYSIS
1. AIM:
The project aims to analyse the COVID-19 vaccination trend from 2021-2022 and provide insights, trends, and recommendations based on the analysis.
2. INTRODUCTION:
This Project is to analyze the vaccine data on how the vaccination drive is going around the world and try to find out the inference of how the immunization process is going on worldwide. It also explains the importance of studying the COVID-19 vaccination trend and its impact on public health. Further, Highlights the significance of analysing the data from 2021-2022 to understand the progress and challenges faced during that period. It also mentions the Insights of the project, such as identifying vaccination rates, analysing distribution patterns, and evaluating the effectiveness of vaccination campaigns.
3. PROBLEM STATEMENT:
The COVID-19 pandemic has posed significant challenges in achieving widespread vaccination coverage. This project aims to analyze the vaccination trend from 2021-2022 to identify factors influencing vaccination rates and different vaccines used and their availability to different countries with different attributes of changing trends.
4. METHODOLOGY:
Data Collection:
The dataset is collected from the Kaggle website and available for the public which is collected from the respective health departments of the countries and the WHO. The dataset contains information for the period December 2020 to March 2022.
Data Cleaning:
This Datasets has some null values in some columns after loading it to PowerBI where some null values is changed to Zero using ‘Replace Values’ option using PowerBI Query editor. Finally transformed and loaded back for creating trends with visuals in PowerBI.
ANALYSIS AND VISUALIZATIONS:
The following are the key visual insights of trends obtained from the dataset.
Dashboard with Trends-Overview:
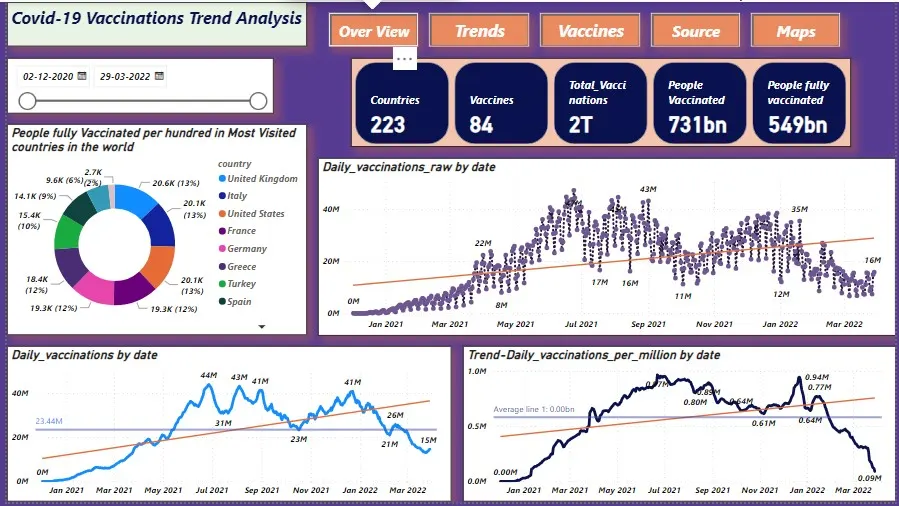
The Pie chart in the dashboard depicts the data of people fully vaccinated percentage for the specially selected most visited Top 10 countries in the world for tourism in which the UK, Italy, US tops the list with 13% followed by France, Germany, Greece, Turkey, and Spain.
The row card in the visual depicts that there are 223 countries, 84 types of vaccines, 548 billion people worldwide have been fully vaccinated against COVID-19, total number of COVID-19 vaccinations administered is over 2 trillion. And 731 billion people have received at least one dose or both doses of the COVID-19 vaccine.
Daily vaccination conducted by countries around the world:
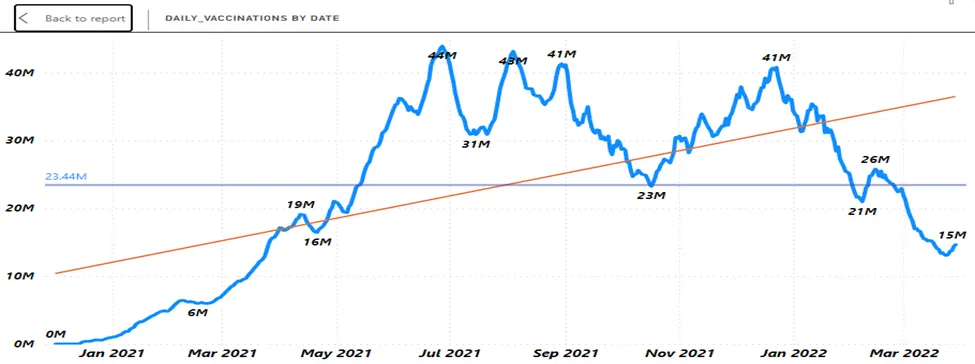
The line graph depicting the vaccination trend shows a gradual increase in the number of people vaccinated from January 2021, reaching a peak of 44 million doses administered in June 2021. It also has an average vaccination rate of 23 million. The graph exhibits variations in subsequent months, with a drop to 23 million doses in a day, followed by a rise to 41 million doses by the end of March 2022, approximately 15 million doses were administered.
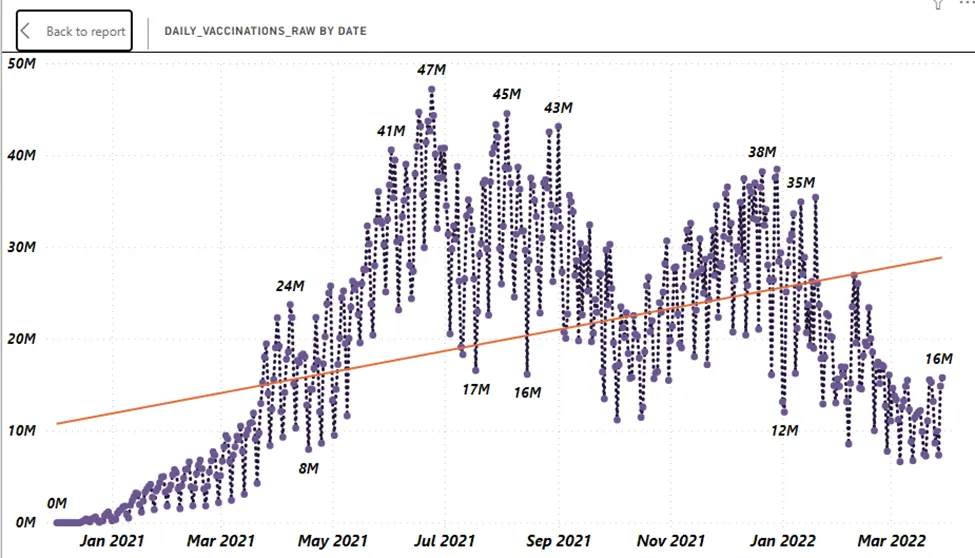
This line chart of daily vaccinations raw data shows a repeating pattern as that of daily vaccination data.
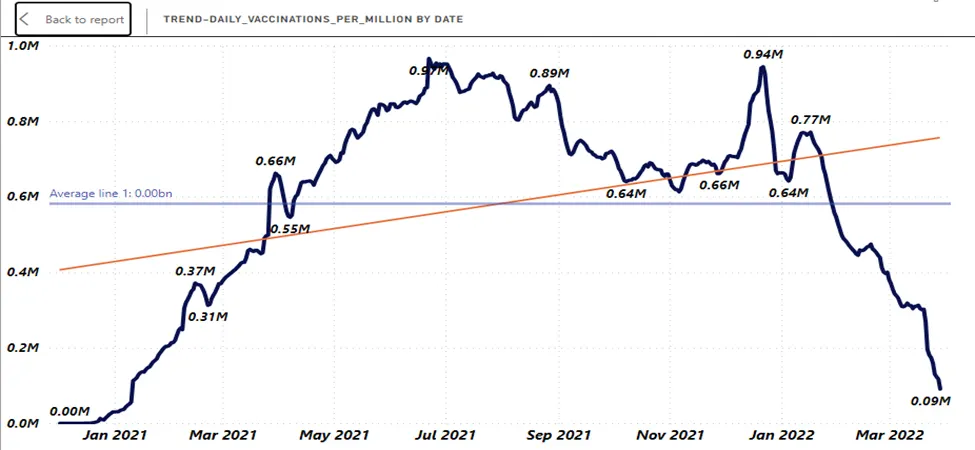
The daily vaccinations per million show seasonality due to the increased availability of vaccines, seasonal patterns in vaccination campaigns, public awareness and increased gradually in Jan 2022. It has an average of 1 billion daily vaccination rate over the date.
Different Trend analysis of people vaccinated data in the world:
Dashboard:
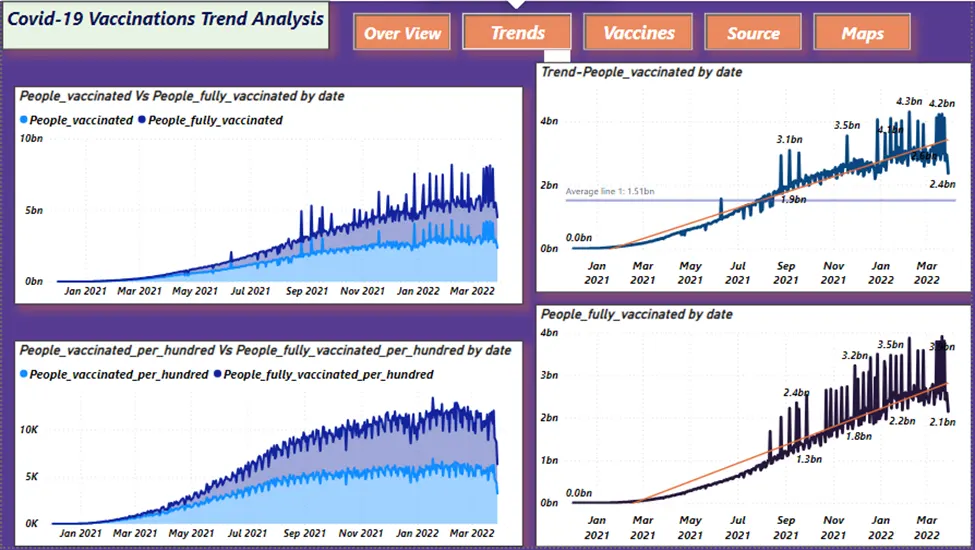
People vaccinated Vs People fully vaccinated:
The rate of people vaccinated with one dose gradually increases on Jan 2022 than people fully vaccinated and finally, the numbers for people fully vaccinated is higher when compared to people vaccinated. The Average number of people vaccinated by date line graph shows an average of 1.1 billion by September 2021 and it changed significantly over the end of December 2021. And the People fully vaccinated line chart has a trend of increasing rate in 2021 with 3.9 billion.
People vaccinated per hundred Vs People fully vaccinated per hundred by date:
These two trends show that 2021 was the peak year over the date. In 2021, COVID-19 vaccination campaigns were in full swing, with a focus on vaccinating as many people as possible to curb the spread of the virus and mitigate its impact.
Different Vaccines available in the world by country & its popularity:
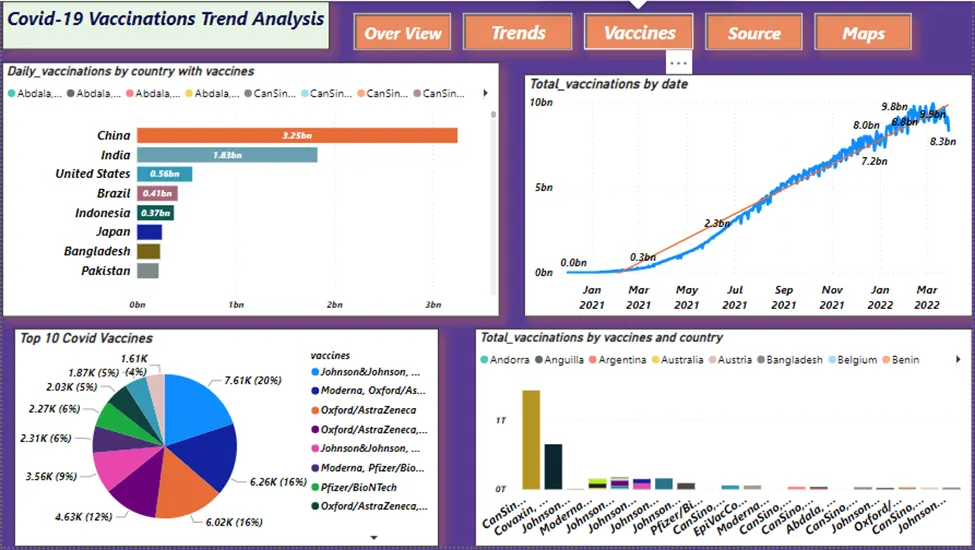
The total vaccination line chart trended upwards with seasonality from 2.3 billion in 2021 to 9.9 billion in 2022. The daily vaccination bar chart depicts that China has administrated the most vaccines of 3.2 billion in the world followed by India, US and at the last some countries including Saint Helena, San Marino has 0 vaccinations. The US has started the vaccination drive very early and India is moving quite steadily despite it has started vaccination late. While the rest of the countries are showing a steady decrease from 411 million daily vaccinations.
The pie chart lists out the top 10 most used vaccines in the world among which Johnson & Johnson, Moderna, Pfizer/BioNTech stands first. The bar chart also talks about the popularity of vaccines based on the total vaccinations by country CanSino tops followed by Covaxin, Johnson Moderna (Pfizer).
The variation in daily vaccinations can be attributed to factors such as population size, vaccine availability, vaccination campaigns, and government policies. The high number of vaccinations in China, India, and the US reflects their large populations and proactive vaccination efforts. The popularity of vaccines differed based on factors such as efficacy, availability, and government policies.
Different sources of information about their Vaccines:
Dashboard:
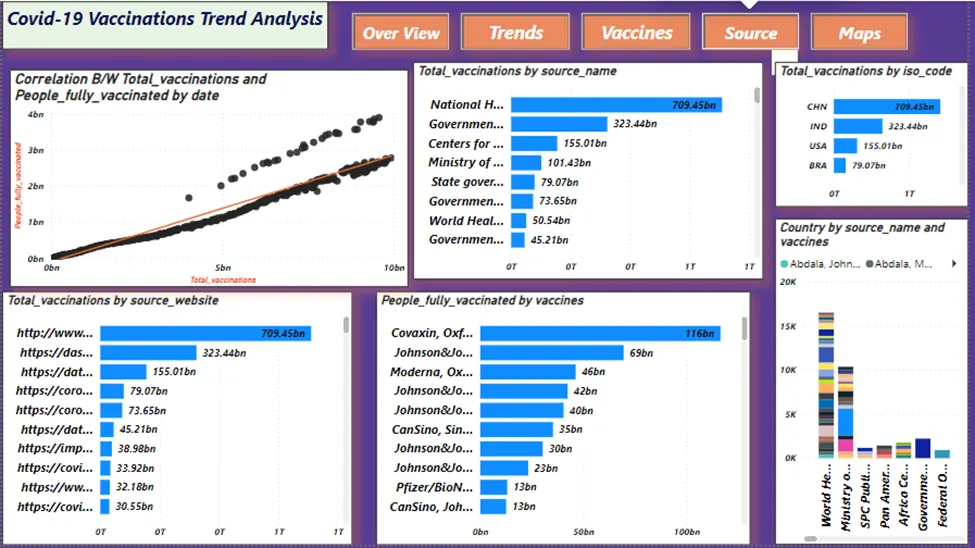
The bar chart reveals that the National Health Organization is the primary source with the highest number of total vaccines, followed by the Government of India. The corresponding bar chart displays the respective website names associated with these sources based on total vaccinations.
Based on the scatter plot, there appears to be a positive correlation between total vaccinations and people fully vaccinated. As the number of total vaccinations increases, the number of people fully vaccinated also tends to increase.
Additionally, the bar chart indicates that the ISO Code CHN (China) has a significantly higher number of total vaccines compared to other countries.
Furthermore, vaccines such as Covaxin, Oxford/AstraZeneca, and Sputnik V have a higher rate of people fully vaccinated.
Lastly, sources like the World Health Organization and the Ministry of Health have a larger number of countries with a wide range of popular vaccines compared to other sources.
Map Visuals of Countries Vaccinations:
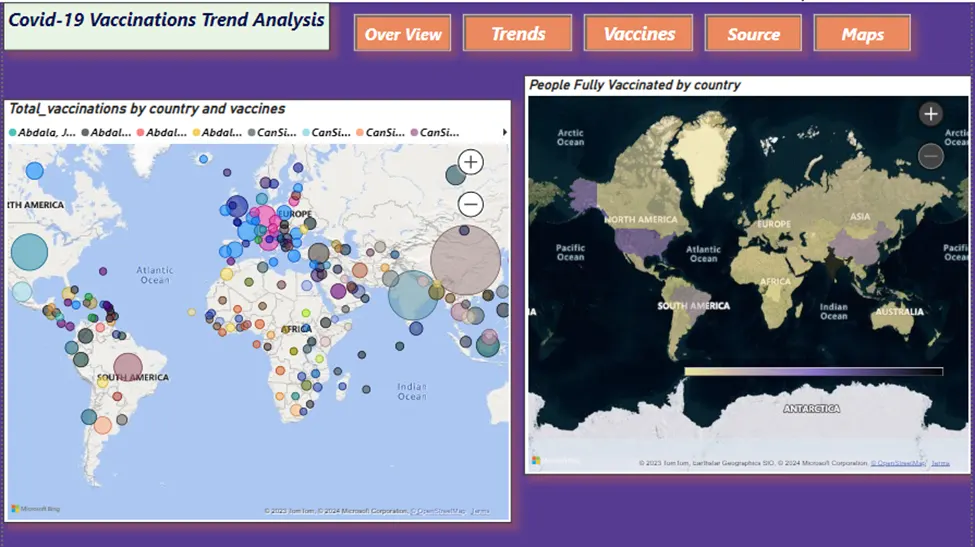
These are the Map Visuals of how vaccinations are going in different countries. In the Map visual 1-gives the popularity of vaccines based on total vaccinations in each country, the bubble size depicts the total vaccinations and colors as the type of popular vaccine in that country. In the Map visual 2, the color signifies how many people have been vaccinated fully(both 1st & 2nd doses).
5. INSIGHTS:
- The high vaccination rates in 2021 reflect the global efforts to combat the pandemic and the prioritization of vaccination as a key strategy in controlling the transmission of COVID-19.
- The high number of vaccinations in China, India, and the US reflects their large populations and initiative-taking vaccination efforts.
- The Popularity of Johnson & Johnson, Moderna, and Pfizer/BioNTech vaccines suggests their effectiveness and widespread distribution in various countries.
- The trend of vaccinations showed seasonality, with peaks and drops in daily vaccination rates.
- The global vaccination effort has made significant progress, with billions of people receiving at least one dose and millions being fully vaccinated.
- Most of the countries are not fully vaccinated.
- China has started Mass Vaccination first.
- CanSino, Covaxin, Sputnik V, and Johnson & Johnson are the widely used Vaccines in China, India, and USA.
v
6. RECOMMENDATIONS:
- Continue to prioritize and promote vaccination efforts in countries with lower percentages of fully vaccinated individuals. This will help increase overall vaccination coverage and reduce the risk of COVID-19 transmission.
- Monitor and analyse the vaccination trends to identify any potential challenges in the vaccination process. This will help in implementing targeted strategies to overcome these obstacles and ensure a smooth vaccination campaign.
- Share best practices and successful vaccination strategies among countries to facilitate knowledge exchange and improve vaccination rates globally.
- Ensure equitable distribution of vaccines to all countries, especially those with limited access to vaccines. Collaborate with international organizations and vaccine manufacturers to address supply chain issues and increase vaccine availability.
- Continue to educate the public about the importance of vaccination and address any concerns or misinformation that may hinder vaccination efforts.
7. CONCLUSION:
The analysis of the COVID-19 vaccination trend dataset reveals significant progress in global vaccination efforts. The Top 10 most visited countries for tourism, including the UK, Italy, and the US, have achieved high percentages of fully vaccinated individuals. The dataset includes information on the number of people fully vaccinated, daily vaccination trends, and the popularity of different vaccines. The vaccination rates have shown variations over time, with peaks and fluctuations in daily doses administered. It is crucial to continue monitoring and improving vaccination efforts to ensure widespread coverage and control the spread of COVID-19 global