Project 1 - COVID-19 Vaccinations Trend Analysis
PROJECT -1
Covid 19 vaccinations trend analysis
AIM:-
The aim of this Project is to create a Power BI dashboard to visualize and analyse country vaccinations data for a specific country.
INTRODUCTION:-
the COVID- 19 pandemic has had a significant impact on the world, with countries around the globe struggling to control the spread of the virus. Vaccinations have emerged as a key toll in the fight against COVID-19, with countries around the world rolling out vaccination programs to protect their populations. This project focuses on analyzing the trends in COVID-19 vaccination to identify patterns and insights that can inform policy decisions and help control the spread of the virus
PROBLEM STATEMENT
The COVID-19 pandemic has had a significant impact on public health and the global economy. Vaccinations have emerged as a critical tool in controlling the spread of the virus and reducing its impact. However, there are still many challenges associated with rolling out vaccination programs globally, including supply chain issues, vaccine hesitancy, and distribution challenges. This project aims to analyse the trends in COVID-19 vaccinations to identify areas where improvements can be made to vaccination programs and to inform policy decisions related to the ongoing pandemic.
METHODOLOGY
Step 1: - First Download the country vaccinations data
Step 2: Open Power BI > load the data through Excel file
Step 3: In data cleaning I cleaned the data with the transform data option present in Power BI because the dataset was not cleaned and included some missing values, so with the help of the duplicates function in Power BI, I cleaned the data and replace the null values with 0 and then started working on it.
Step 4: Data Interpretation
In this data interpretation step, I found out some important information about the data set
- <!-- [if !supportLists]-->· <!--[endif]-->The data set was almost clear and completed
- <!-- [if !supportLists]-->· <!--[endif]-->There is total of 86512 rows and 15 columns
Step 5: Build Visualization
ANALYSIS
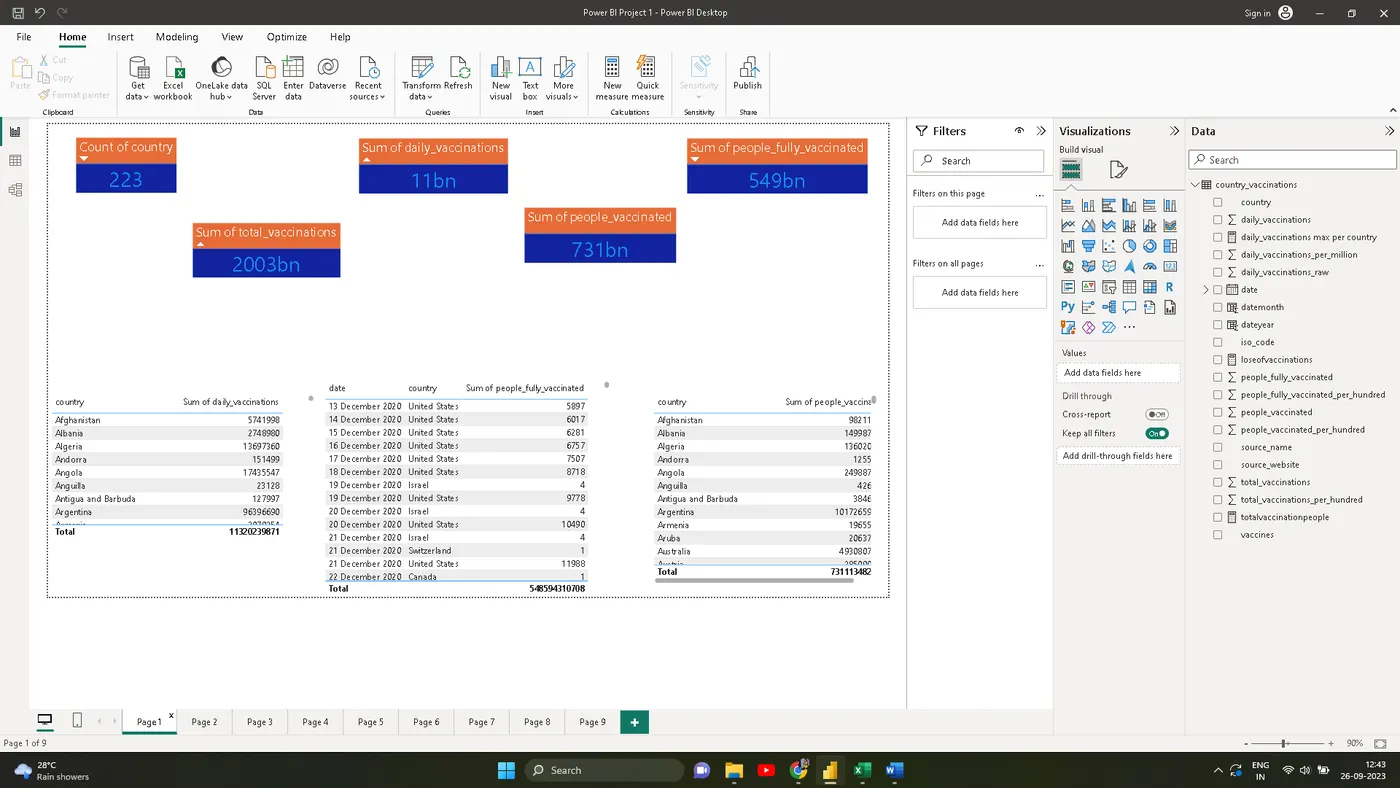
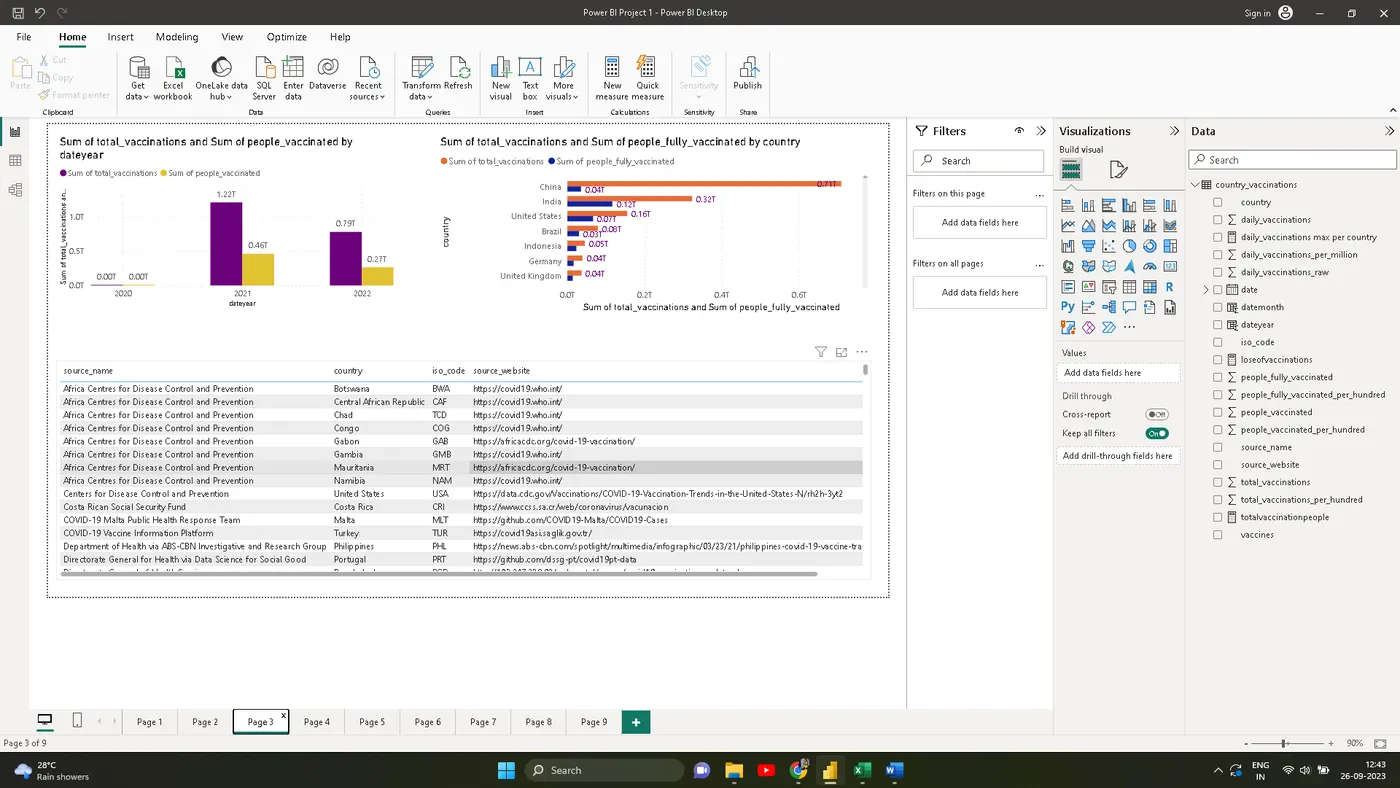
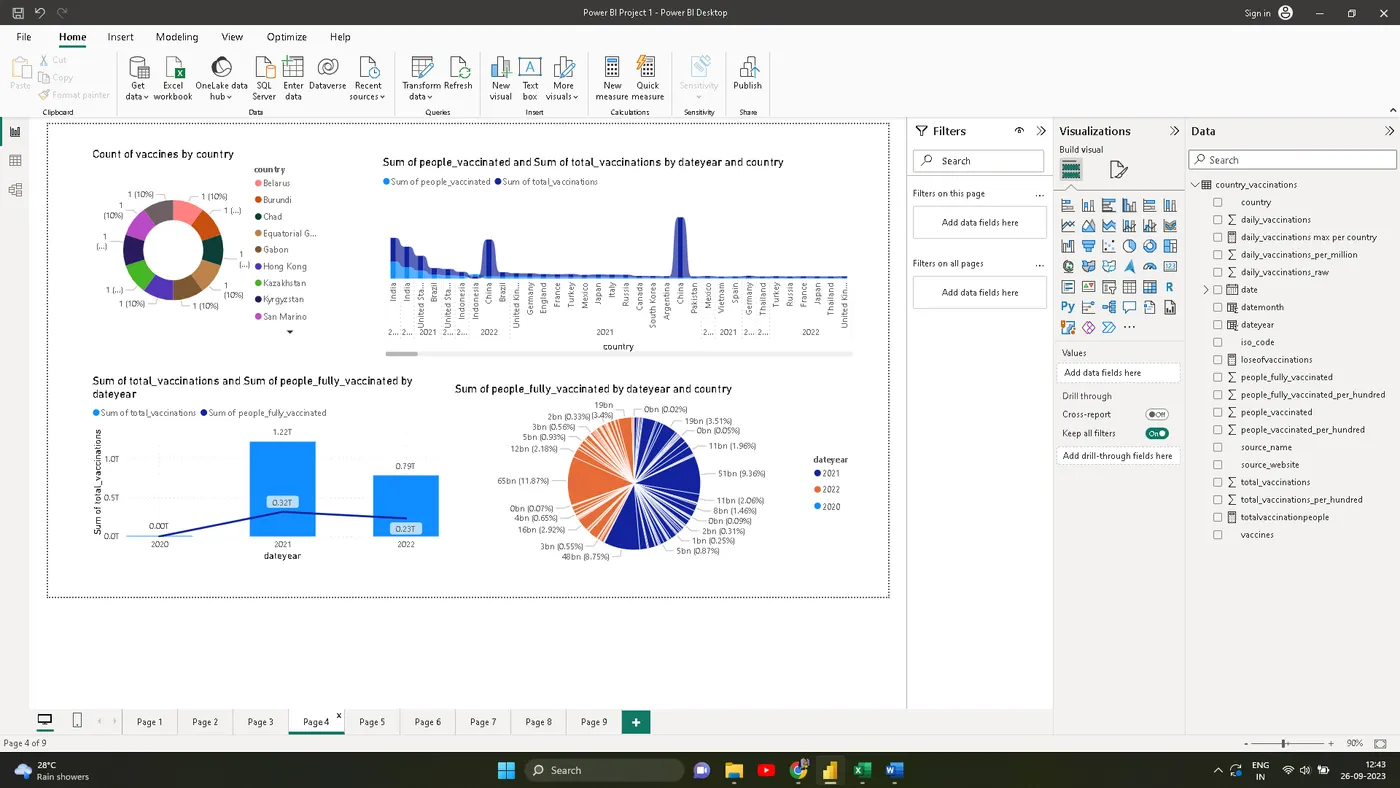
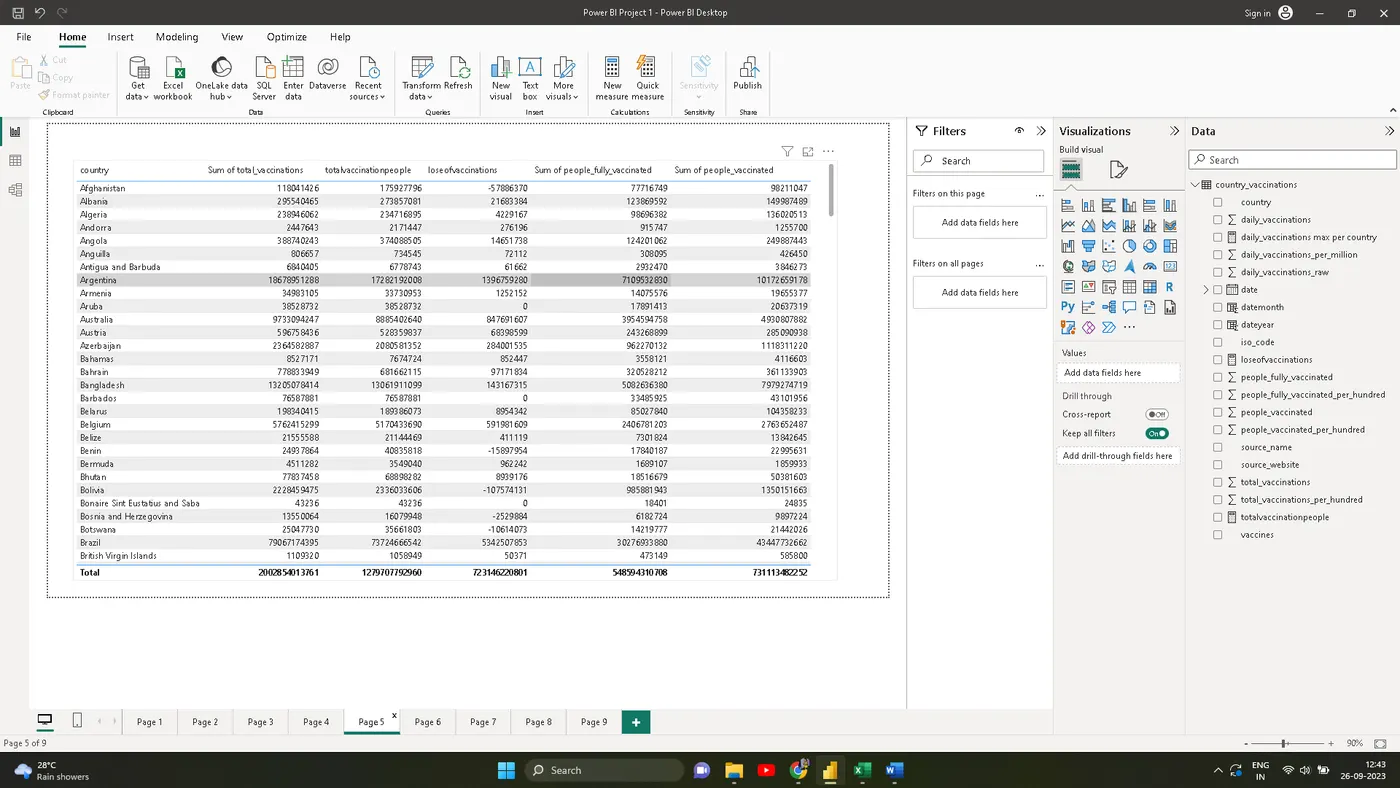
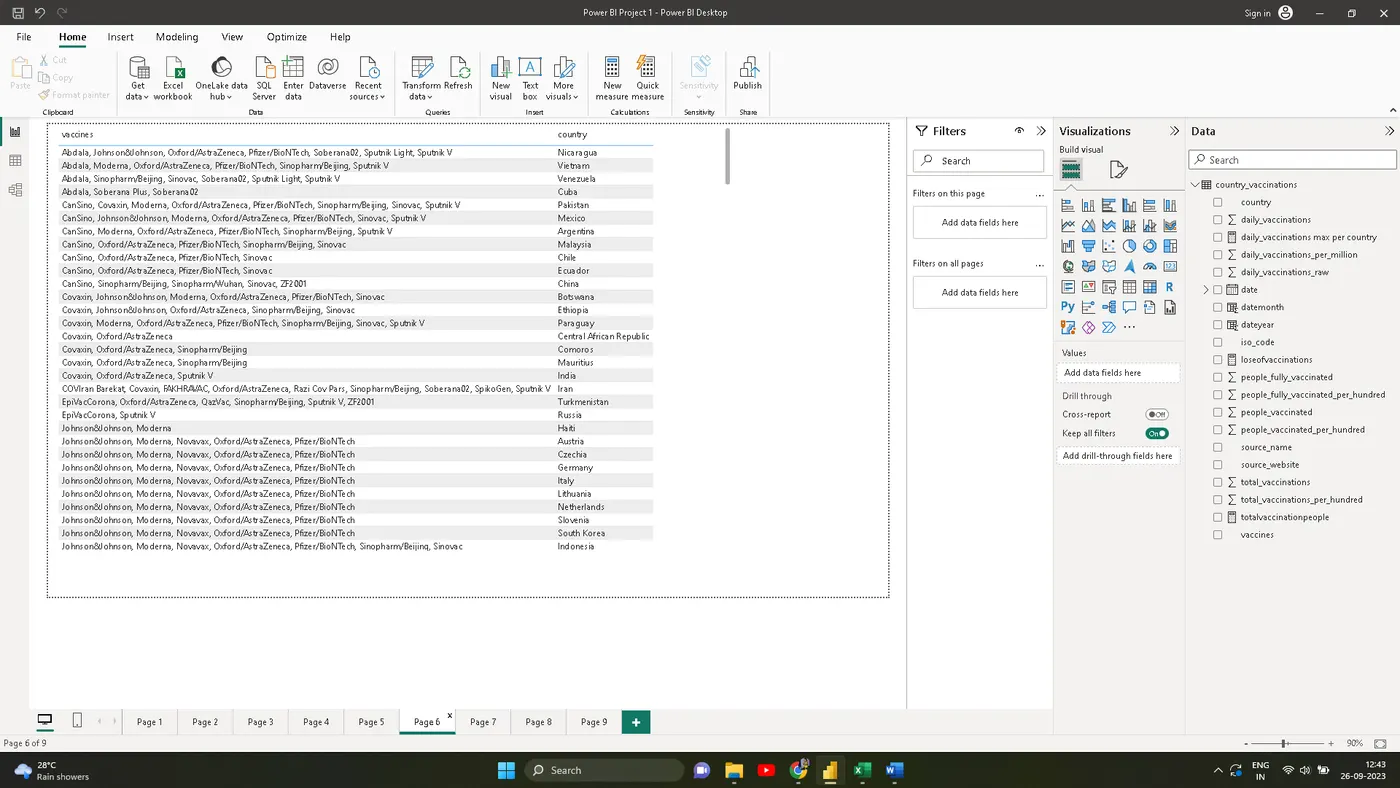
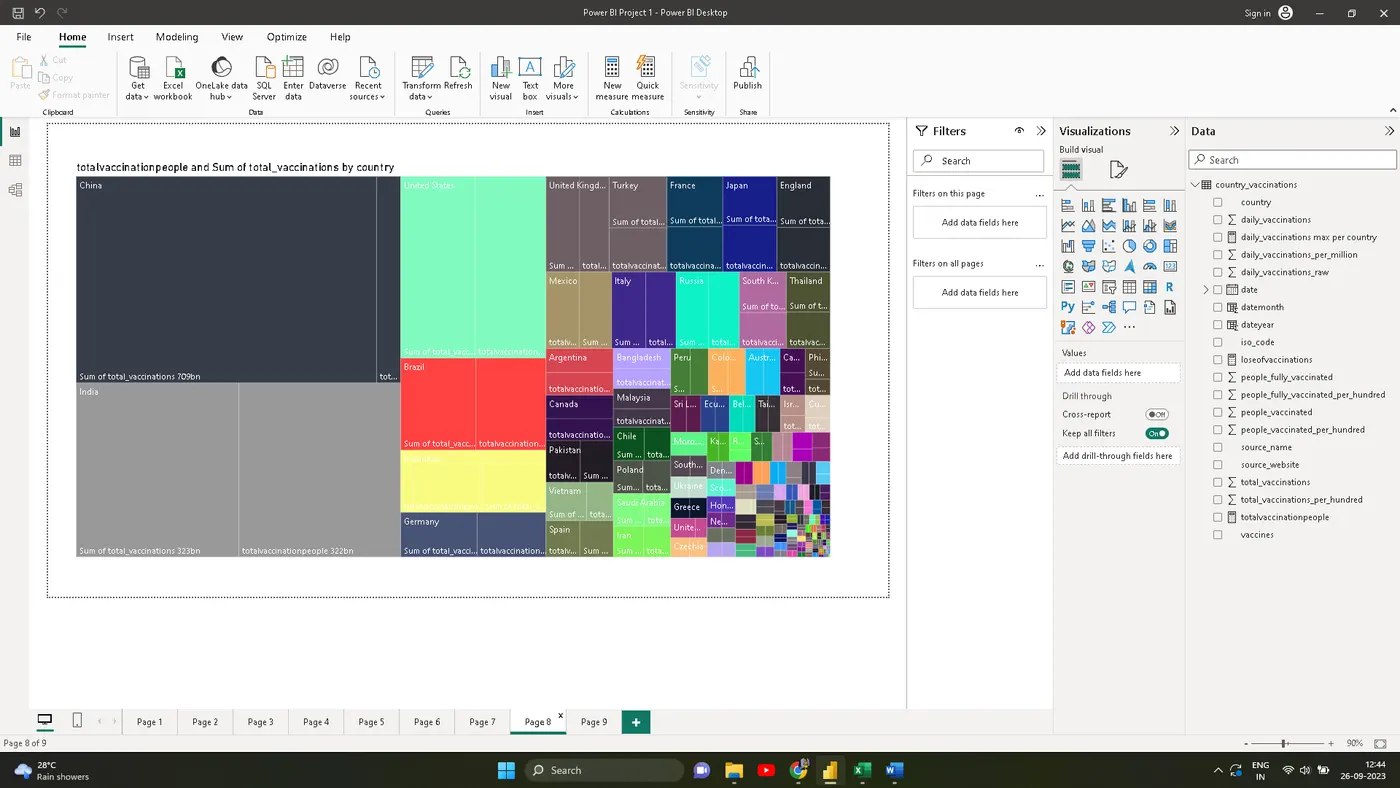
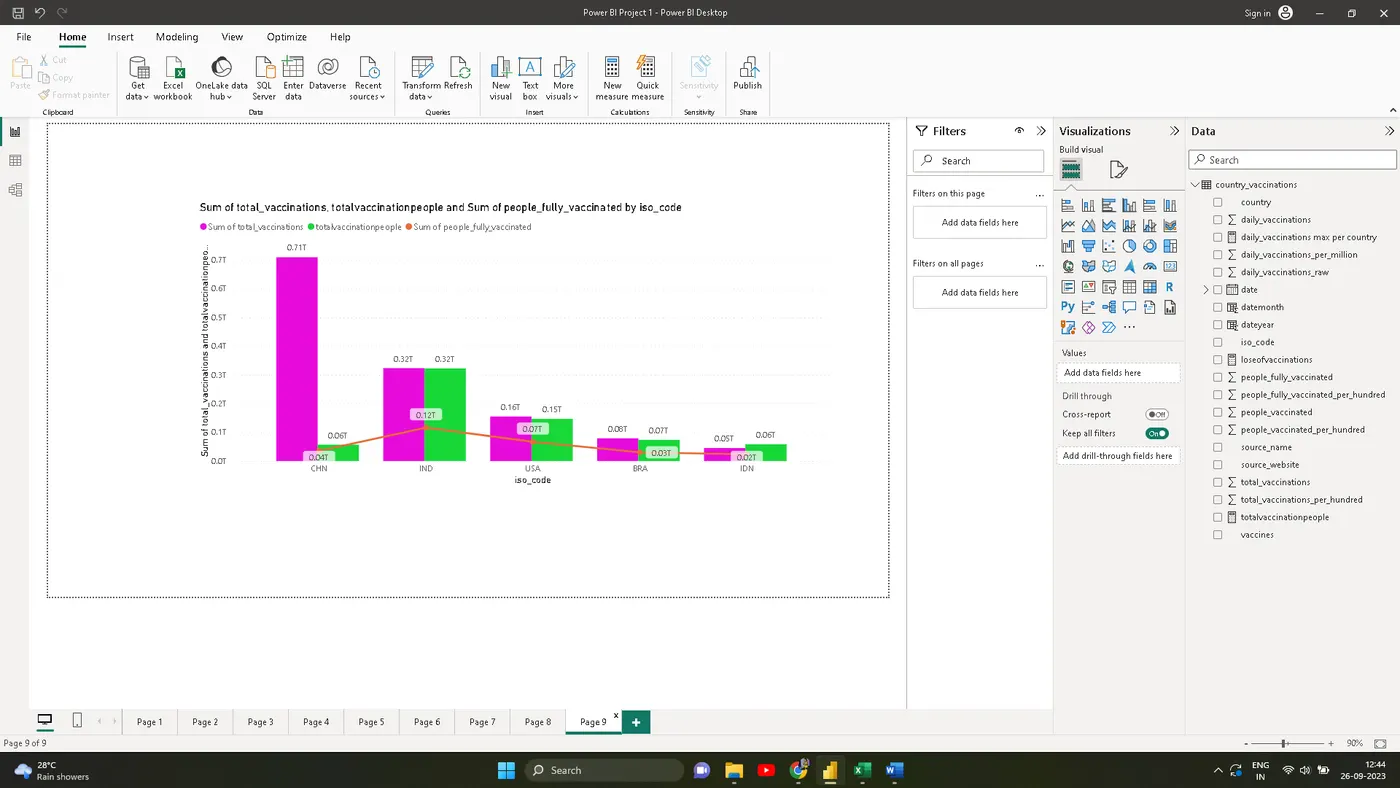
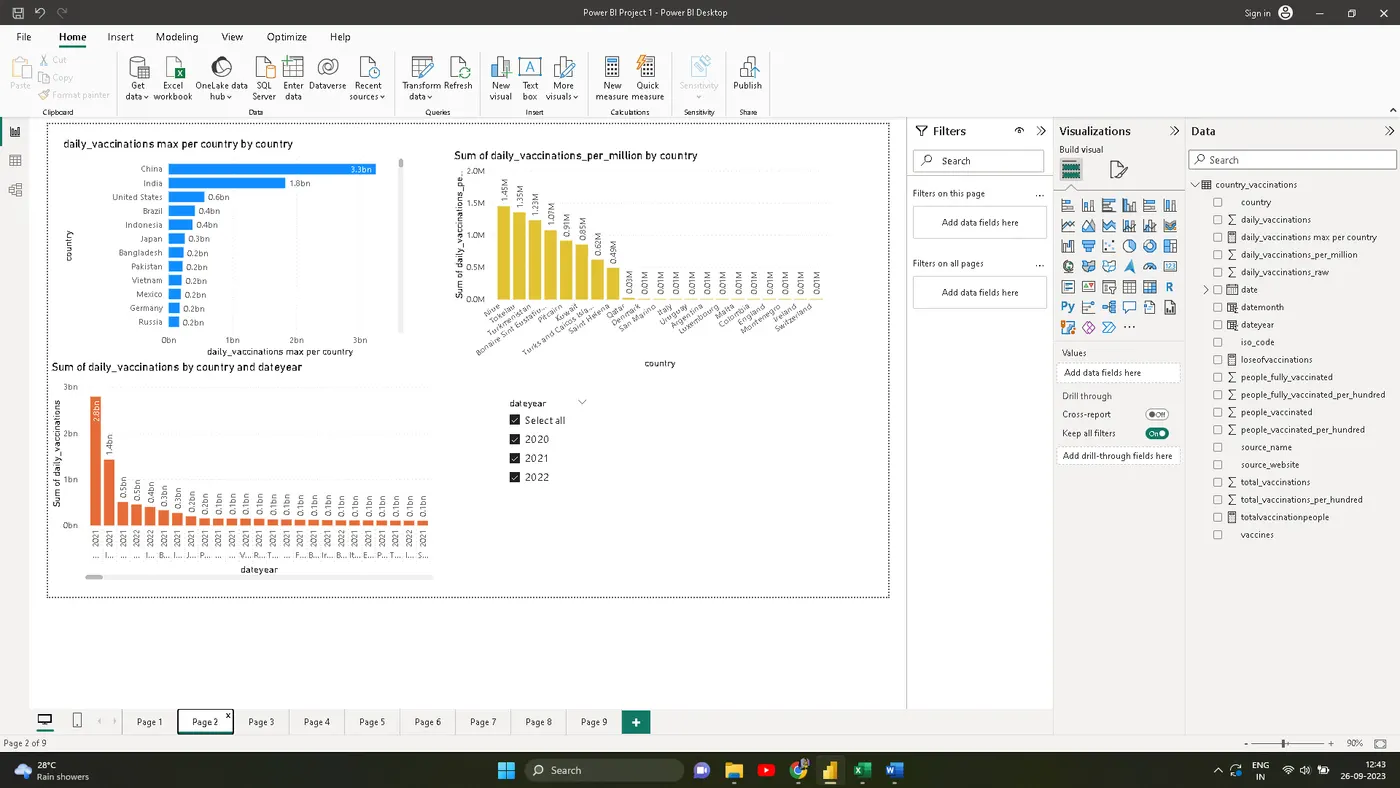
From the above visualization find some interesting points that are mentioned below
- <!-- [if !supportLists]-->· <!--[endif]-->India is the No1in fully vaccinated people.
- <!-- [if !supportLists]-->· <!--[endif]-->The dataset is available for 2021 and 2022
- <!-- [if !supportLists]-->· <!--[endif]-->The total of 223 countries participates in vaccination
- <!-- [if !supportLists]-->· <!--[endif]-->Daily vaccination is highest in august month
INSIGHTS
The analysis will provide several key insights into the trends and patterns related to COVID-19 vaccinations. Some of the key insights include:
<!-- [if !supportLists]-->· <!--[endif]-->Distribution challenges have been a significant barrier to effective vaccination programs.
<!-- [if !supportLists]-->· <!--[endif]-->The Pfizer and Moderns vaccines have the highest efficacy rates.
RECOMANDATIONS.
Based on the insights gathered from the analysis, the following recommendations are made:
<!-- [if !supportLists]-->· <!--[endif]-->Countries with lower vaccination rates should focus on improving their vaccine distribution strategies to ensure that vaccines are reaching all parts of their population.
<!-- [if !supportLists]-->· <!--[endif]-->Governments and international organizations should work to address the underlying economic and social factors that are contributing to vaccine hesitancy in certain populations.
<!-- [if !supportLists]-->· <!--[endif]-->Governments should prioritize the use of Pfizer and Moderns vaccines to maximize the effectiveness of their vaccination programs.
CONCLUSION
The COVID-19 pandemic has had a significant impact on public health and the global economy. Vaccinations have emerged as a critical tool in controlling the spread of the virus and reducing its impact. This project has analyses the trends in COVID-19 vaccinations worldwide to identify.
VISULAZATIONS USING CHARTS