Project 1 - COVID-19 Vaccinations Trend Analysis
COVID-19 Vaccinations Trend Analysis
Aim :
The aim of this project is to analyze the data regarding individuals who received vaccinations and those who are fully vaccinated, categorized by country during the years 2021 and 2022.
Introduction:
The COVID-19 pandemic, caused by the Corona virus, had a devastating impact worldwide, resulting in numerous fatalities. Originating in Wuhan, China in 2019, the virus spread globally through human contact. It exhibited symptoms ranging from mild fever and cold to severe breathing difficulties due to lung damage. With no initial vaccine or cure available, the world witnessed a significant loss of lives. Countries implemented strict measures, isolating themselves to prevent further transmission, which led to financial and mental health challenges for people confined to their homes. In response, various health organizations embarked on a mission to develop a vaccine or cure to halt the pandemic.
In the later stages of 2020, experimental vaccines were successfully developed and administered to humans. These vaccines proved effective in reducing the impact of the virus. Even if individuals contracted the virus, the severity of the illness was mitigated, resulting in milder symptoms and avoiding life-threatening situations.
Many countries subsequently developed their own vaccines and supported other nations lacking resources by providing them with the vaccines they had developed.
Problem Statement:
In this project, we find out in Different Countries how many people are Vaccinated or fully Vaccinated in 2021 and 2022 and also find out how many people in different countries have completed Daily Vaccinations, Total Vaccination per hundred, People Vaccination per hundred, and Daily vaccinations per Million.
Methodology
Step 1 :
Data Importing :
In power BI desktop with the help of the get data option import the CSV data which is named as country_vaccinations and clicked load option.
Step 2 :
Data Cleaning :
After loading the data and after analyzing the data | understood that there are 86512 rows and 15 columns. And in that some of the columns contained null values I have replaced the null values by 0 with the use of replace functions and started working on the data.
Step 3 :
Visualization:
In visualization part with the help of power BI desktop software I have used different kinds of charts, graphs, cards and table to display the data in the format which will be easy to understand.
Analysis:
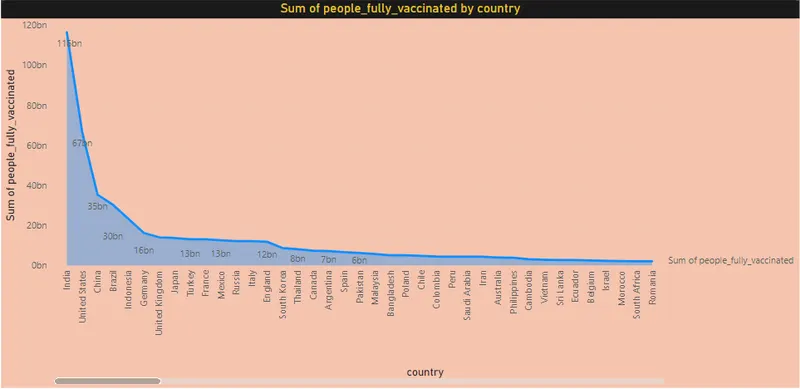
In the analysis part first | have analyzed fully vaccinated countries and the result obtained as below,
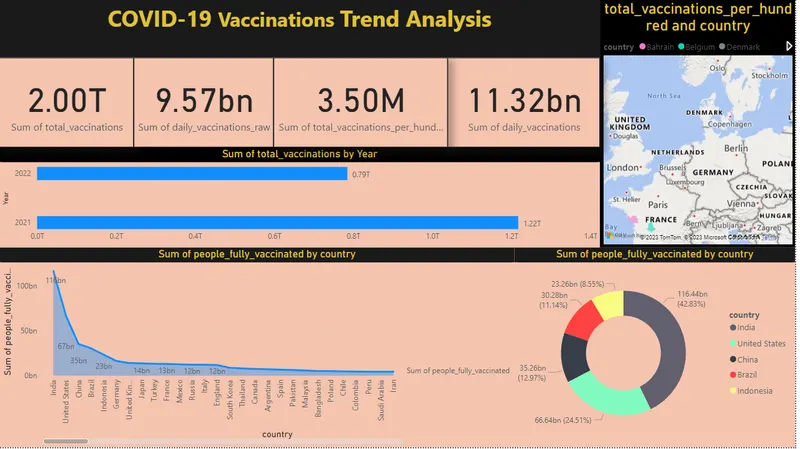
From the below image we can able to come to know that India is the top country in terms full vaccination with 116 billon , followed by united states of America and china with 67 billion and 35 billion respectively.
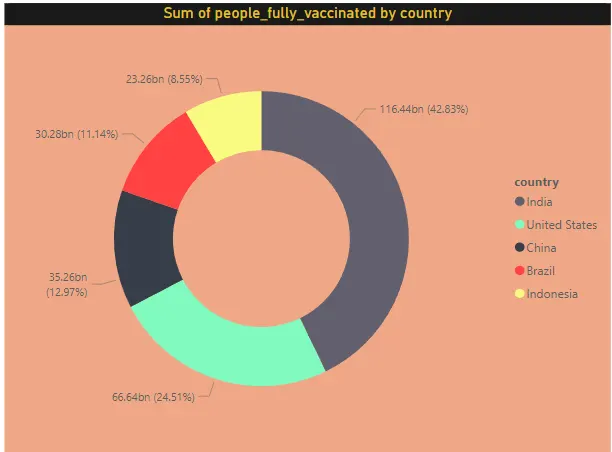
In the second analysis we have analyzed the top 5 vaccinated countries with the help of pie chart and used filter option to find the top countries and with that we came to know that India is the top country with more number of vaccinated peoples followed by United States of America China and Brazil.
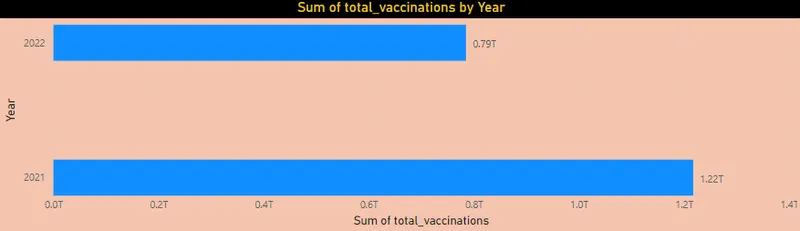
Above image have shown that daily vaccinating details year wise and here we can conclude that 2021 is a year which having maximum vaccinating details and I have used bar chart.
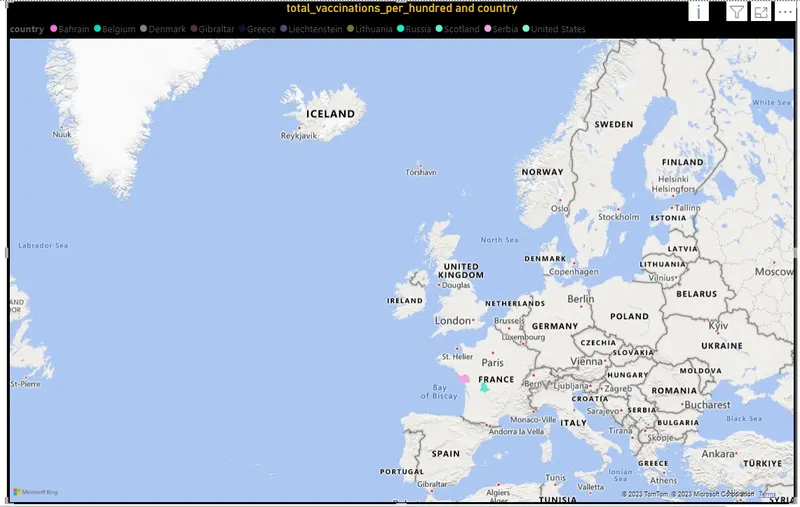
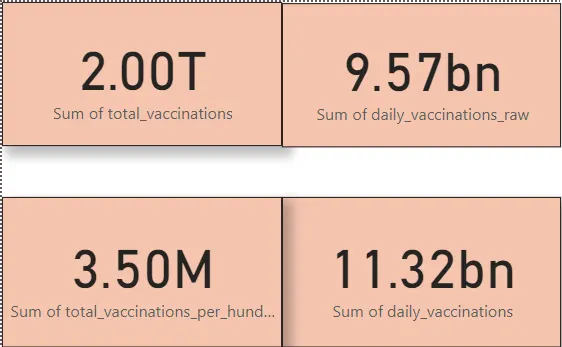
From the above images we have analyzed the daily vaccinations , people who have fully vaccinated per hundred , total vaccinations per hundred.
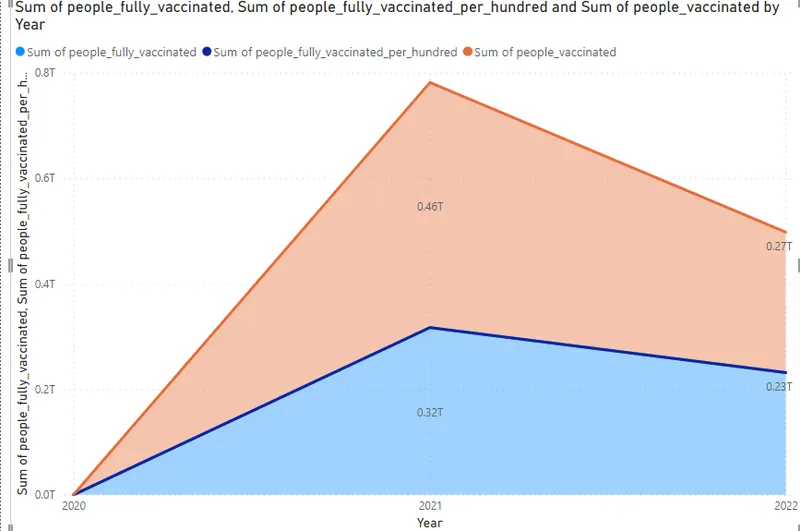
From the above image we came to know about people who have vaccinated per hundred, people who have fully vaccinated per hundred, total vaccinated per hundred and we came. to know about that 2021 was the peak year in all the 3 cases.
Dashboard:
Insights :
- Here we analyzed fully vaccinated countries in which India tops the list which indicates that people in the country where showing lots of interests to get vaccinated.
- And also analyzed top 5 vaccinated countries here also India tops the list.
- And also we analyse the sum of daily vaccinating details, fully vaccinating and vaccinating people details.
And our year wise analyse shows that 2021 was the peak year for every vaccination details.
Recommendations :
- We should collect day to day reports and we should update our records daily to get more accurate details.
So that we can move forward with more vaccination to the right country which needs the most.
Conclusions :
In this dataset we came to know that the vaccination process in every country was going in good pace that indicates we can have control of this disease very soon all over the world.