Project 1 - COVID-19 Vaccinations Trend Analysis
Project 1 COVID-19 Vaccinations Trend Analysis Power Bi
Saurabh Srivastava
The Detailed Documentation of the Project should contain.
Aim: -
This project aims to analyse data in detail on vaccinated people and fully vaccinated by year and country.
Introduction: -
The main objective of this project is to analyse the data on, COVID-19 Vaccinations. Through the Analysis of data, we can find out some important insights.
Problem Statement: -
- We can find out how many people are completely vaccinated.
- Total vaccinations by each year and then by country. In this analysis, we can see the number of people vaccinated per hundred.
Methodology: -
Step 1: Data cleaning
In data cleaning I cleaned the data with the transform data option present in Power BI because the dataset was not cleaned and included some missing values, so with the help of the duplicates function in Power BI, I cleaned the data and replace the null values with 0 and then started working on it.
Step 2: Data interpretation
In this data interpretation step, I found out some important information about the data set.
• The data set was almost clear and completed.
• I replaced the null values with 0.
• There is total of 86512 rows and 15 columns.
Step 3: Visualization
In visualization, I took the help of Power BI Desktop software to make graphs and charts here some relevant graphs and charts are attached.
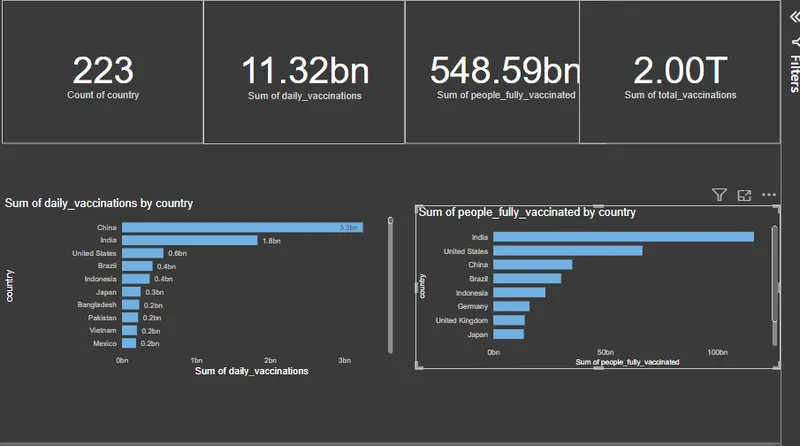
Dashboard
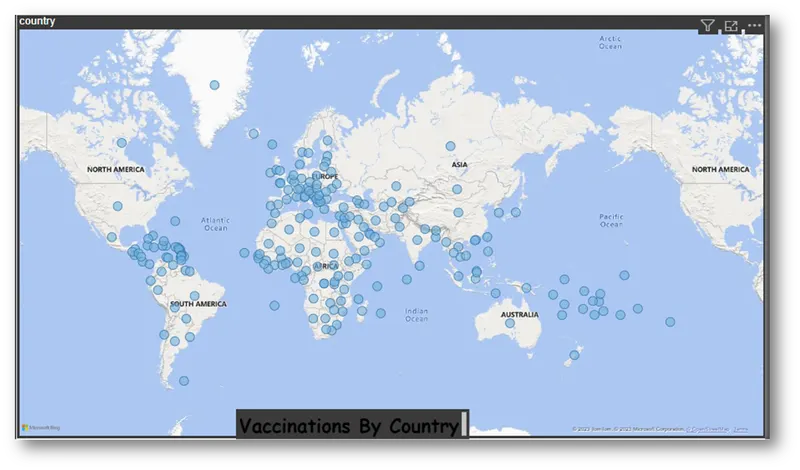
This Visualization showed the Vaccination by different Countries
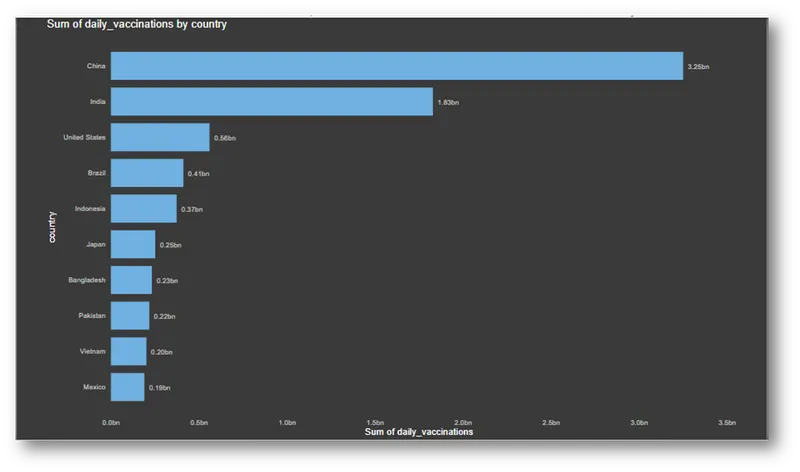
This Visualization shows the daily vaccination by top 10 countries
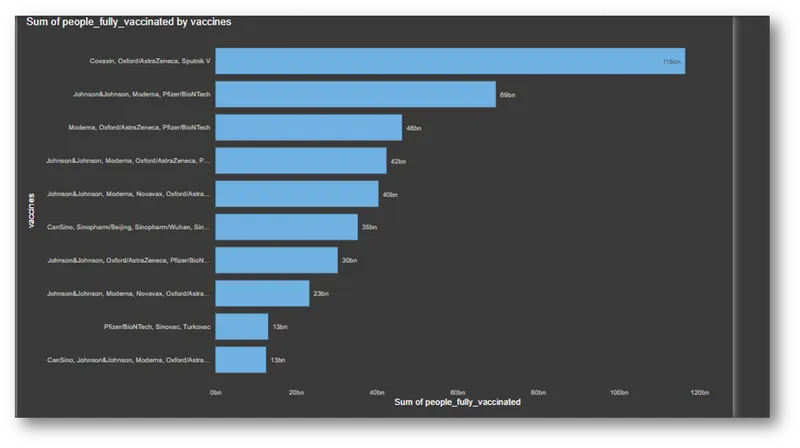
This Visualization shows the sum of fully vaccinated people by top 10 different Vaccines
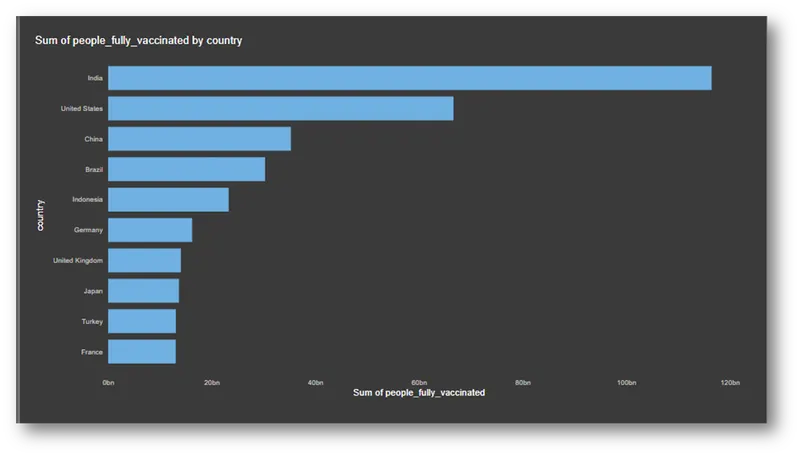
This Visualization shows the sum of fully vaccinated people by top 10 countries
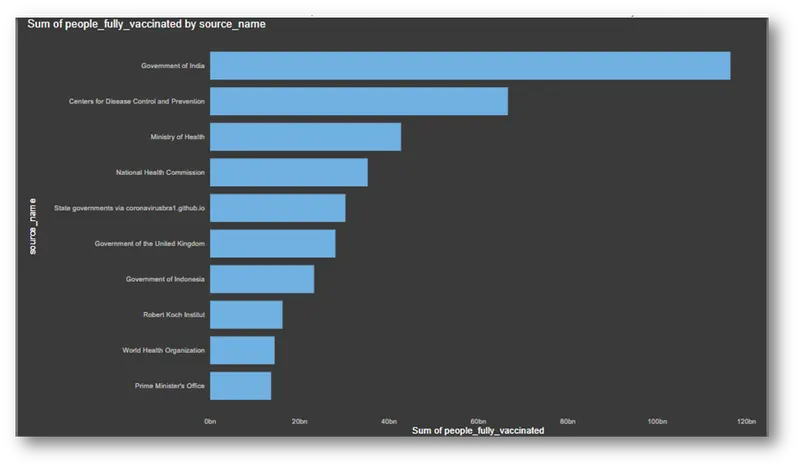
This Visualization shows the sum of fully vaccinated people by top 10 sources
In observation found some interesting points that are mentioned below.
- All Report Page Created
- According to data on people fully vaccinated in the year.
- The dataset available is from 2020,2021,2022.
- Total vaccination by the country in map visualization.
- Total Highest Top 10 Country Daily vaccination
- Total Highest Top 10 Vaccine People Fully Vaccinated
- Total Highest Top 10 Country People Fully Vaccinated
- Total Highest Top 10 Source Name People Fully Vaccinated
- Total Highest Daily vaccination is 3250342496in China.
- Highest number of vaccinations by the source name is the Govt of India is 116436444996
- Sum Of Total Vaccinations is 2002854013761
Sum Of People Fully Vaccinated is 548594310708
Insights: -
• In conclusion, we can take a look at the final Report for further analysis.
• We can see the top 10 sources.
• Countries by fully vaccination etc.
Recommendations: -
• We can collect good datasets for analysis.
• We can analyse the data of the overall world.
• Like this dataset we can perform operations with various categories, city-wise or region-wise.
• We can work on large datasets and analyse them with the proper format of the chart.
Conclusion: -
In conclusion, we can take a look at the final Report for further analysis.
As we can see in the Report the top countries vaccination-wise, Top Country by the vaccination in daily and best top 10 countries with our vaccines. Vaccination peeks in 2022. The Top 2 vaccine sources are India, and China.