predict whether the patient has heart disease or not?
import pandas as pd
import seaborn as sns
import matplotlib.pyplot as plt
In [278]:
df=pd.read_csv('heart.csv')
In [279]:
df
Out[279]:
| age | sex | cp | trtbps | chol | fbs | restecg | thalachh | exng | oldpeak | slp | caa | thall | output | |
|---|---|---|---|---|---|---|---|---|---|---|---|---|---|---|
| 0 | 63 | 1 | 3 | 145 | 233 | 1 | 0 | 150 | 0 | 2.3 | 0 | 0 | 1 | 1 |
| 1 | 37 | 1 | 2 | 130 | 250 | 0 | 1 | 187 | 0 | 3.5 | 0 | 0 | 2 | 1 |
| 2 | 41 | 0 | 1 | 130 | 204 | 0 | 0 | 172 | 0 | 1.4 | 2 | 0 | 2 | 1 |
| 3 | 56 | 1 | 1 | 120 | 236 | 0 | 1 | 178 | 0 | 0.8 | 2 | 0 | 2 | 1 |
| 4 | 57 | 0 | 0 | 120 | 354 | 0 | 1 | 163 | 1 | 0.6 | 2 | 0 | 2 | 1 |
| ... | ... | ... | ... | ... | ... | ... | ... | ... | ... | ... | ... | ... | ... | ... |
| 298 | 57 | 0 | 0 | 140 | 241 | 0 | 1 | 123 | 1 | 0.2 | 1 | 0 | 3 | 0 |
| 299 | 45 | 1 | 3 | 110 | 264 | 0 | 1 | 132 | 0 | 1.2 | 1 | 0 | 3 | 0 |
| 300 | 68 | 1 | 0 | 144 | 193 | 1 | 1 | 141 | 0 | 3.4 | 1 | 2 | 3 | 0 |
| 301 | 57 | 1 | 0 | 130 | 131 | 0 | 1 | 115 | 1 | 1.2 | 1 | 1 | 3 | 0 |
| 302 | 57 | 0 | 1 | 130 | 236 | 0 | 0 | 174 | 0 | 0.0 | 1 | 1 | 2 | 0 |
303 rows × 14 columns
In [280]:
df.isna().sum()
Out[280]:
age         0
sex         0
cp          0
trtbps      0
chol        0
fbs         0
restecg     0
thalachh    0
exng        0
oldpeak     0
slp         0
caa         0
thall       0
output      0
dtype: int64
In [281]:
df.info()
<class 'pandas.core.frame.DataFrame'>
RangeIndex: 303 entries, 0 to 302
Data columns (total 14 columns):
 #   Column    Non-Null Count  Dtype
---  ------    --------------  -----
 0   age       303 non-null    int64
 1   sex       303 non-null    int64
 2   cp        303 non-null    int64
 3   trtbps    303 non-null    int64
 4   chol      303 non-null    int64
 5   fbs       303 non-null    int64
 6   restecg   303 non-null    int64
 7   thalachh  303 non-null    int64
 8   exng      303 non-null    int64
 9   oldpeak   303 non-null    float64
 10  slp       303 non-null    int64
 11  caa       303 non-null    int64
 12  thall     303 non-null    int64
 13  output    303 non-null    int64
dtypes: float64(1), int64(13)
memory usage: 33.3 KB
In [282]:
df.describe()
Out[282]:
| age | sex | cp | trtbps | chol | fbs | restecg | thalachh | exng | oldpeak | slp | caa | thall | output | |
|---|---|---|---|---|---|---|---|---|---|---|---|---|---|---|
| count | 303.000000 | 303.000000 | 303.000000 | 303.000000 | 303.000000 | 303.000000 | 303.000000 | 303.000000 | 303.000000 | 303.000000 | 303.000000 | 303.000000 | 303.000000 | 303.000000 |
| mean | 54.366337 | 0.683168 | 0.966997 | 131.623762 | 246.264026 | 0.148515 | 0.528053 | 149.646865 | 0.326733 | 1.039604 | 1.399340 | 0.729373 | 2.313531 | 0.544554 |
| std | 9.082101 | 0.466011 | 1.032052 | 17.538143 | 51.830751 | 0.356198 | 0.525860 | 22.905161 | 0.469794 | 1.161075 | 0.616226 | 1.022606 | 0.612277 | 0.498835 |
| min | 29.000000 | 0.000000 | 0.000000 | 94.000000 | 126.000000 | 0.000000 | 0.000000 | 71.000000 | 0.000000 | 0.000000 | 0.000000 | 0.000000 | 0.000000 | 0.000000 |
| 25% | 47.500000 | 0.000000 | 0.000000 | 120.000000 | 211.000000 | 0.000000 | 0.000000 | 133.500000 | 0.000000 | 0.000000 | 1.000000 | 0.000000 | 2.000000 | 0.000000 |
| 50% | 55.000000 | 1.000000 | 1.000000 | 130.000000 | 240.000000 | 0.000000 | 1.000000 | 153.000000 | 0.000000 | 0.800000 | 1.000000 | 0.000000 | 2.000000 | 1.000000 |
| 75% | 61.000000 | 1.000000 | 2.000000 | 140.000000 | 274.500000 | 0.000000 | 1.000000 | 166.000000 | 1.000000 | 1.600000 | 2.000000 | 1.000000 | 3.000000 | 1.000000 |
| max | 77.000000 | 1.000000 | 3.000000 | 200.000000 | 564.000000 | 1.000000 | 2.000000 | 202.000000 | 1.000000 | 6.200000 | 2.000000 | 4.000000 | 3.000000 | 1.000000 |
In [283]:
df.head(10)
Out[283]:
| age | sex | cp | trtbps | chol | fbs | restecg | thalachh | exng | oldpeak | slp | caa | thall | output | |
|---|---|---|---|---|---|---|---|---|---|---|---|---|---|---|
| 0 | 63 | 1 | 3 | 145 | 233 | 1 | 0 | 150 | 0 | 2.3 | 0 | 0 | 1 | 1 |
| 1 | 37 | 1 | 2 | 130 | 250 | 0 | 1 | 187 | 0 | 3.5 | 0 | 0 | 2 | 1 |
| 2 | 41 | 0 | 1 | 130 | 204 | 0 | 0 | 172 | 0 | 1.4 | 2 | 0 | 2 | 1 |
| 3 | 56 | 1 | 1 | 120 | 236 | 0 | 1 | 178 | 0 | 0.8 | 2 | 0 | 2 | 1 |
| 4 | 57 | 0 | 0 | 120 | 354 | 0 | 1 | 163 | 1 | 0.6 | 2 | 0 | 2 | 1 |
| 5 | 57 | 1 | 0 | 140 | 192 | 0 | 1 | 148 | 0 | 0.4 | 1 | 0 | 1 | 1 |
| 6 | 56 | 0 | 1 | 140 | 294 | 0 | 0 | 153 | 0 | 1.3 | 1 | 0 | 2 | 1 |
| 7 | 44 | 1 | 1 | 120 | 263 | 0 | 1 | 173 | 0 | 0.0 | 2 | 0 | 3 | 1 |
| 8 | 52 | 1 | 2 | 172 | 199 | 1 | 1 | 162 | 0 | 0.5 | 2 | 0 | 3 | 1 |
| 9 | 57 | 1 | 2 | 150 | 168 | 0 | 1 | 174 | 0 | 1.6 | 2 | 0 | 2 | 1 |
In [284]:
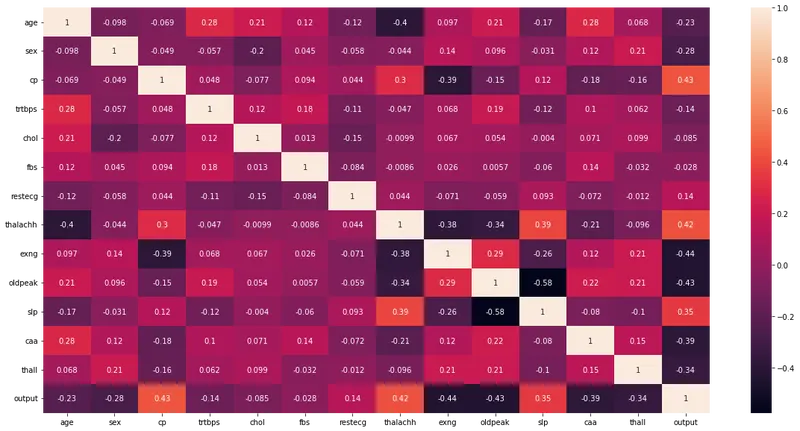
corrMatrix = df.corr()
plt.figure(figsize=(20,10))
sns.heatmap(corrMatrix, annot=True)
plt.show()
In [285]:
df['output'].value_counts().plot(kind='bar')
plt.title('Count of Disease,not Disease ')
plt.xticks([0,1],['Disease','Not Disease'],rotation=0)
plt.show()

In [286]:
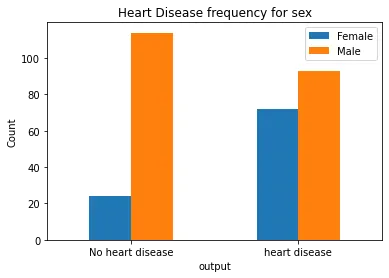
x=pd.crosstab(df.output,df.sex)
x
Out[286]:
| sex | 0 | 1 |
|---|---|---|
| output | ||
| 0 | 24 | 114 |
| 1 | 72 | 93 |
In [287]:
x.plot(kind='bar')
plt.title('Heart Disease frequency for sex')
plt.xticks([0,1],['No heart disease','heart disease'],rotation=0)
plt.ylabel('Count')
plt.legend(['Female','Male'])
plt.show()
In [288]:
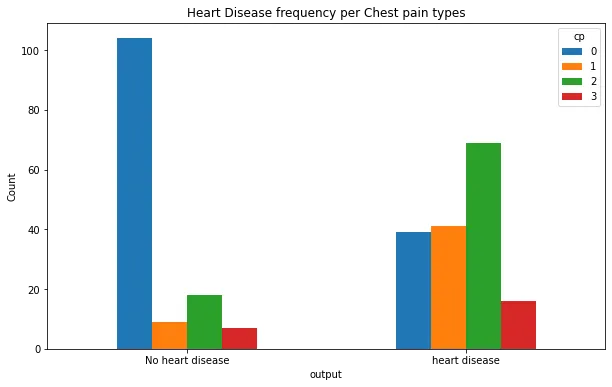
pd.crosstab(df.output,df.cp)
Out[288]:
| cp | 0 | 1 | 2 | 3 |
|---|---|---|---|---|
| output | ||||
| 0 | 104 | 9 | 18 | 7 |
| 1 | 39 | 41 | 69 | 16 |
In [289]:
pd.crosstab(df.output,df.cp).plot.bar(figsize=(10,6))
plt.title('Heart Disease frequency per Chest pain types')
plt.xticks([0,1],['No heart disease','heart disease'],rotation=0)
plt.ylabel('Count');
plt.xticks(rotation=0);
In [290]:
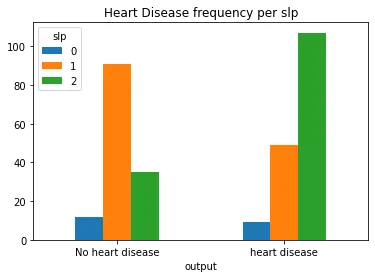
pd.crosstab(df.output,df.slp)
Out[290]:
| slp | 0 | 1 | 2 |
|---|---|---|---|
| output | |||
| 0 | 12 | 91 | 35 |
| 1 | 9 | 49 | 107 |
In [291]:
pd.crosstab(df.output,df.slp).plot(kind='bar')
plt.title('Heart Disease frequency per slp')
plt.xticks([0,1],['No heart disease','heart disease'],rotation=0)
plt.show()
In [292]:
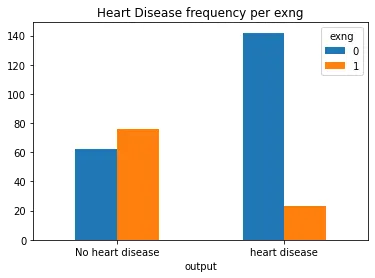
pd.crosstab(df.output,df.exng)
Out[292]:
| exng | 0 | 1 |
|---|---|---|
| output | ||
| 0 | 62 | 76 |
| 1 | 142 | 23 |
In [293]:
pd.crosstab(df.output,df.exng).plot(kind='bar')
plt.title('Heart Disease frequency per exng')
plt.xticks([0,1],['No heart disease','heart disease'],rotation=0)
plt.show()
In [294]:
X = df.drop('output',axis=1)
y = df[['output']]
In [295]:
X
Out[295]:
| age | sex | cp | trtbps | chol | fbs | restecg | thalachh | exng | oldpeak | slp | caa | thall | |
|---|---|---|---|---|---|---|---|---|---|---|---|---|---|
| 0 | 63 | 1 | 3 | 145 | 233 | 1 | 0 | 150 | 0 | 2.3 | 0 | 0 | 1 |
| 1 | 37 | 1 | 2 | 130 | 250 | 0 | 1 | 187 | 0 | 3.5 | 0 | 0 | 2 |
| 2 | 41 | 0 | 1 | 130 | 204 | 0 | 0 | 172 | 0 | 1.4 | 2 | 0 | 2 |
| 3 | 56 | 1 | 1 | 120 | 236 | 0 | 1 | 178 | 0 | 0.8 | 2 | 0 | 2 |
| 4 | 57 | 0 | 0 | 120 | 354 | 0 | 1 | 163 | 1 | 0.6 | 2 | 0 | 2 |
| ... | ... | ... | ... | ... | ... | ... | ... | ... | ... | ... | ... | ... | ... |
| 298 | 57 | 0 | 0 | 140 | 241 | 0 | 1 | 123 | 1 | 0.2 | 1 | 0 | 3 |
| 299 | 45 | 1 | 3 | 110 | 264 | 0 | 1 | 132 | 0 | 1.2 | 1 | 0 | 3 |
| 300 | 68 | 1 | 0 | 144 | 193 | 1 | 1 | 141 | 0 | 3.4 | 1 | 2 | 3 |
| 301 | 57 | 1 | 0 | 130 | 131 | 0 | 1 | 115 | 1 | 1.2 | 1 | 1 | 3 |
| 302 | 57 | 0 | 1 | 130 | 236 | 0 | 0 | 174 | 0 | 0.0 | 1 | 1 | 2 |
303 rows × 13 columns
In [296]:
y
Out[296]:
| output | |
|---|---|
| 0 | 1 |
| 1 | 1 |
| 2 | 1 |
| 3 | 1 |
| 4 | 1 |
| ... | ... |
| 298 | 0 |
| 299 | 0 |
| 300 | 0 |
| 301 | 0 |
| 302 | 0 |
303 rows × 1 columns
In [297]:
from sklearn.model_selection import train_test_split
x_train,x_test,y_train,y_test=train_test_split(X,y,test_size=0.3,random_state=3)
In [298]:
from sklearn.linear_model import LogisticRegression
In [299]:
log=LogisticRegression(max_iter=1000)
log.fit(x_train,y_train)
C:Userskeertanaconda3libsite-packagessklearnutilsvalidation.py:993: DataConversionWarning: A column-vector y was passed when a 1d array was expected. Please change the shape of y to (n_samples, ), for example using ravel().
  y = column_or_1d(y, warn=True)
Out[299]:
LogisticRegression(max_iter=1000)
In [300]:
p1=log.predict(x_test)
In [301]:
from sklearn.metrics import confusion_matrix
def con_mat(x,y):
    confusion_matrix(x,y)
    sns.heatmap(confusion_matrix(x,y),annot=True,cbar=False)
    plt.xlabel('True label')
    plt.ylabel('Predicted label')
In [302]:
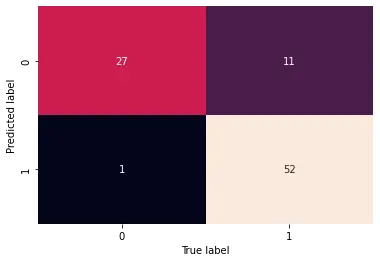
con_mat(y_test,p1)
In [303]:
from sklearn.metrics import accuracy_score
a1=accuracy_score(y_test,p1)
print('Accuracy Score of LogisticRegression is:',a1)
Accuracy Score of LogisticRegression is: 0.8681318681318682
In [304]:
from sklearn.neighbors import KNeighborsClassifier
KNN=KNeighborsClassifier(n_neighbors=4)
In [305]:
KNN.fit(x_train,y_train)
C:Userskeertanaconda3libsite-packagessklearnneighbors_classification.py:198: DataConversionWarning: A column-vector y was passed when a 1d array was expected. Please change the shape of y to (n_samples,), for example using ravel().
  return self._fit(X, y)
Out[305]:
KNeighborsClassifier(n_neighbors=4)
In [306]:
p2=KNN.predict(x_test)
In [307]:
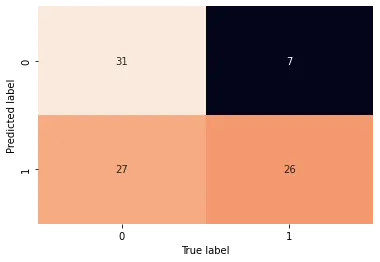
con_mat(y_test,p2)
In [308]:
a2=accuracy_score(y_test,p2)
print('Accuracy Score of K-Nearest Neighbours Classifier is:',a2)
Accuracy Score of K-Nearest Neighbours Classifier is: 0.6263736263736264
In [309]:
from sklearn.svm import SVC
In [310]:
svm=SVC()
In [311]:
svm.fit(x_train,y_train)
C:Userskeertanaconda3libsite-packagessklearnutilsvalidation.py:993: DataConversionWarning: A column-vector y was passed when a 1d array was expected. Please change the shape of y to (n_samples, ), for example using ravel().
  y = column_or_1d(y, warn=True)
Out[311]:
SVC()
In [312]:
p3=svm.predict(x_test)
In [313]:
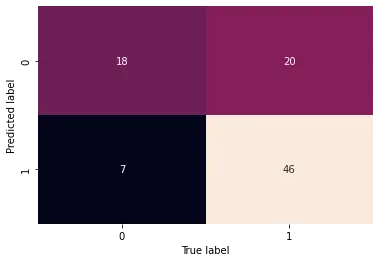
con_mat(y_test,p3)
In [314]:
a3=accuracy_score(y_test,p3)
print('Accuracy Score of Support Vector machine Classifier is:',a3)
Accuracy Score of Support Vector machine Classifier is: 0.7032967032967034
In [315]:
from sklearn.tree import DecisionTreeClassifier
clf = DecisionTreeClassifier(random_state=0)
In [316]:
clf.fit(x_train,y_train)
Out[316]:
DecisionTreeClassifier(random_state=0)
In [317]:
p4=clf.predict(x_test)
In [318]:
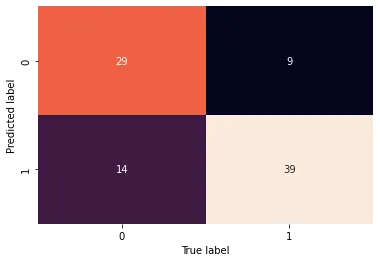
con_mat(y_test,p4)
In [319]:
a4=accuracy_score(y_test,p4)
print('Accuracy Score of Decision Tree Classifier is:',a4)
Accuracy Score of Decision Tree Classifier is: 0.7472527472527473
In [320]:
from sklearn.ensemble import RandomForestClassifier
rf= RandomForestClassifier(n_estimators = 100, random_state = 0)
In [321]:
rf.fit(x_train,y_train)
C:UserskeertAppDataLocalTempipykernel_327201149647727.py:1: DataConversionWarning: A column-vector y was passed when a 1d array was expected. Please change the shape of y to (n_samples,), for example using ravel().
  rf.fit(x_train,y_train)
Out[321]:
RandomForestClassifier(random_state=0)
In [322]:
p5=rf.predict(x_test)
In [323]:
con_mat(y_test,p5)

In [324]:
a5=accuracy_score(y_test,p5)
print('Accuracy Score of Random Forest Classifier is:',a5)
Accuracy Score of Random Forest Classifier is: 0.8241758241758241
In [325]:
print('Accuracy Score of LogisticRegression is:',a1)
print('Accuracy Score of K-Nearest Neighbours Classifier is:',a2)
print('Accuracy Score of Support Vector machine Classifier is:',a3)
print('Accuracy Score of Decision Tree Classifier is:',a4)
print('Accuracy Score of Random Forest Classifier is:',a5)
Accuracy Score of LogisticRegression is: 0.8681318681318682
Accuracy Score of K-Nearest Neighbours Classifier is: 0.6263736263736264
Accuracy Score of Support Vector machine Classifier is: 0.7032967032967034
Accuracy Score of Decision Tree Classifier is: 0.7472527472527473
Accuracy Score of Random Forest Classifier is: 0.8241758241758241
In [ ]: