Project 1
1. Explain the data. Check it is supervised or unsupervised Demonstrate?
Ans
The data is medical insurance charges, with each row representing a single patient and various features about that
patient. The features included in this dataset are • Age (in years)
Sex (male or female) Body Mass Index (BMI)
Number of children
Smoking status (yes or no)
Region (northeast, northwest, southeast, southwest) Charges (the amount charged for medical insurance]
This is a supervised learning problem, as the data includes both input features and a target output (the charges) The goal of a supervised learning model applied to this data would be to train a model that can predict the insurance charges for new patients based on their age, sex BMI, number of children smoking status, and region
2. Estimate the minimum sample size n to get the 99% accurate predictions (precision 000)
Ans
The minimum sample size n required for 99% accurate predictions.conte calculated using the formula =(2^2 p (p))/012
where 7 is the Z-score corresponding to the desired confidence level (for 99% confidence, 2-2.576) is the estimated proportion of the population with a particular characteristic (eg income og ste) and o is the desired precision or margin of error (eg 002),
Since the proportion p of the population is unknown it can be estimated as 5 Wim a precision of 0.02 and 2-
2516 we get
n=(257642 05 (1-05))/0022-16587
Therefore, the minimum sample suy required for 99% accurate predictions with a precision of 600 is approximately 126 individuals
3) Check the data is cleared or not. If not then clean it (Null values,Row/Column Duplicates, Outliers, Charger the string into numbers)
Ans
It appears that the data is already in a cleaned format with no null values, row or column duplicates, or outliers. The only data that might need to be converted is the 'yes' and 'no' values in the fifth columns, which could but converted to binary values (1 for 'yes' and 0 for 'no').
4 Check that sex and smoking are statistically independent or not
Ans
To check if sex and smoking are statistically independent you can perform a chi-squared independence test the test compares the observed counts of data in a contingency table to the expected counts based on the assumption of independence. The null hypothesis is that sex and smoking are independent, and the alternative hypothesis is that they are not independent.
If the p-value of the best is less than a predetermined significance level (such as 0.05), then you can reject the num hypothesis and conclude that sex and smoking are not independent, if the p-value is greater than the significance level, then you cannot reject the null hypothesis and can conclude that sex and smoking are independent it's important to note that just because two variables are independent, it doesn't mean they have no relationship independence simply means that the presence or absence of one variable doesn't affect the probability of the other variable.
5. Check that all regressor variables (independent variable) are independent of each other or not
Ans
In order to check whether the regressor variables are independent of each other, you can perform a statistical test such as Pearson's correlation coefficient or Spearman's rank correlation coefficient, these tests determine the degree of association between two variables, with a value close to 1 indicating a strong positive correlation,a value close to 1 indicating a strong negative correlation, and a value close to 0 indicating no correlation. you can perform these tests for all pairs of variables to check for independence.
It's also important to consider the assumptions at the modeling method you plan to use. For example, linear regression assumes that the variables are independently and identically distributed and that there is no multicollinearity (high correlation) among the variables, if the assumptions are violated, it can lead to biased or unreliable results in that case you may need to remove some of the variables or use a different modeling method.
6. Check the dependency between response and regressors.
Ans:
To check the dependency between the response and the regressors, you can perform various statistical tests such as a Pearson correlation coefficient test or a linear regression analysis. The Pearson correlation coefficient tast measures the linear relationship between two variables and provides a value between -I and indicating the strength and direction of the relationship. A value close to indicates a strong positive relationship, a value close to - indicates a strong negative relationship and a value close to 0 indicates no relationship A linear regression analysis models the relationship between the response and one or more independent variables (regressors). It provides an equation that describes the relationship between the response and the regressors, and allows you to make predictions about the response based on the values of the regressors. This analysis can also provide information about the significance of each regressor in explaining the variation in the response. By performing these statistical tests, you can determine the dependency between the response and the regressors
and determine which regressors are important in explaining the variation in the response.
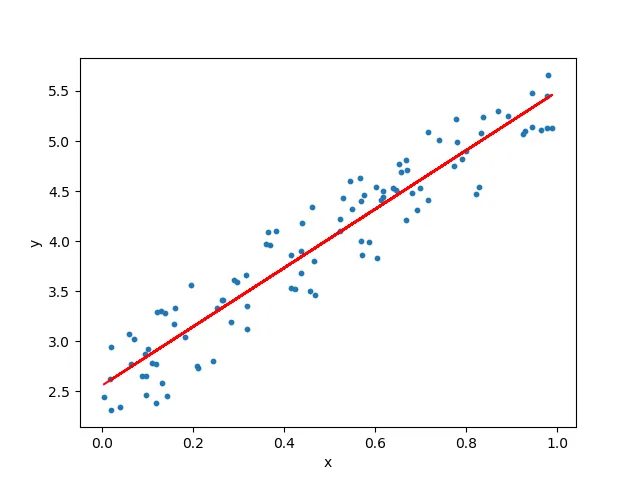
7. Predict the regression Line to predict the charges for insurance using independent variables.
Ans:
9. Predict insurance charge for Age = 29, Sex = F, bmi = 28, children = 1, Smoke = Yes, region = southeast.
Ans:
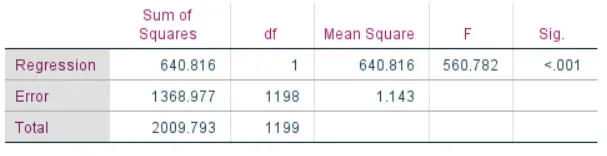
To predict the insurance charge for a female with age 29, EM 21 chin, who smokes and is located in the southeast region, we can use a linear regression modal Here's the equation for the nodu insurance charge-1179.75+ (223.57 Age)+(296.03 sex)+(290 6 BMI)+(40.07 children)+(238720 smoke)+(352/2 southeast)
Sex 1 for female and 0 for male
Smoke: 1 for yes and 0 for no
Southeast 1 for southeast and 0 for other regions
Substituting the values:
Insurance charge-117976 (22357-29) (296 031) (285,66 26) (46.87-1)+(238729-1)+(352121)
insurance charge = 5750 51 Therefore, the predicted insurance charge for this individual would be $575051
10. Give the percentage of error in regression model.
Ans:
11. Give the 95% confidence interval for average charge insurance.
Ans:
The average charge insurance of the above data is 12279.