Project 1
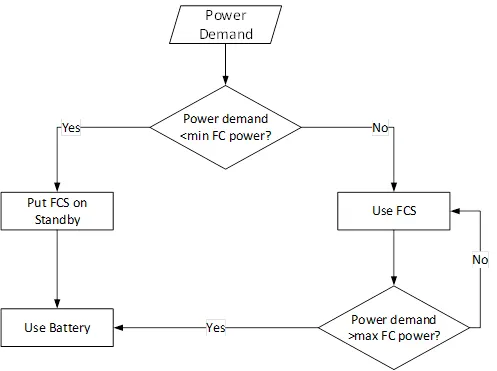
To model the flowchart, we have to assume the minimum and maximum values of power demand for fuel cells and batteries. The minimum power demand for the fuel cell is considered 100W and the maximum power demand is 1000 Watts.
Therefore, as per the flow chart, all the power demand between 100 and 1000 will be supplied by the fuel cell and other power demands will be supplied by the battery. The below tabular column shows a clear picture.
The values are assumptions and can be changed.
|
Power demand |
Supplied by |
|
0-100 |
Battery |
|
101-1000 |
Fuel cell |
|
1001-1200 |
Battery |
For the power demand values between 0 and 1200 the signal is created as a drive cycle in the signal builder block as shown below.
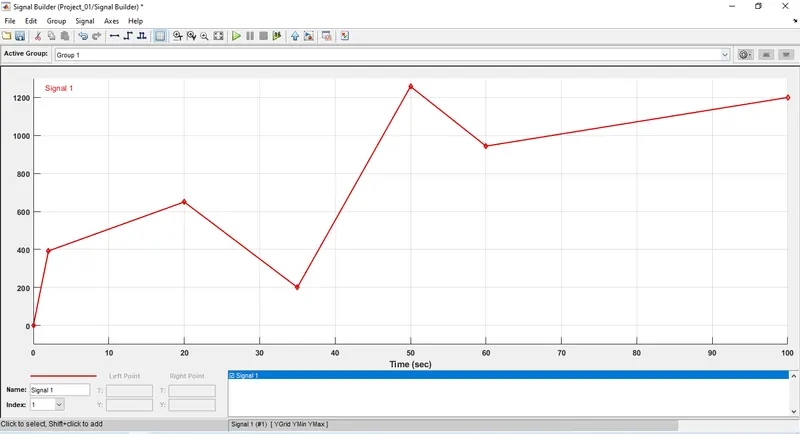
The waveform structure can be varied by clicking each node and dragging it as required.
A Simulink model for this power sharing is being created by using basic blocks like
- Interval test block
- Switch
- Sum
- Constant
- Signal builder
- Scope
Steps for creating the Simulink model
Step 1:
Place signal builder block and create the required signal for the power demand.
Step 2:
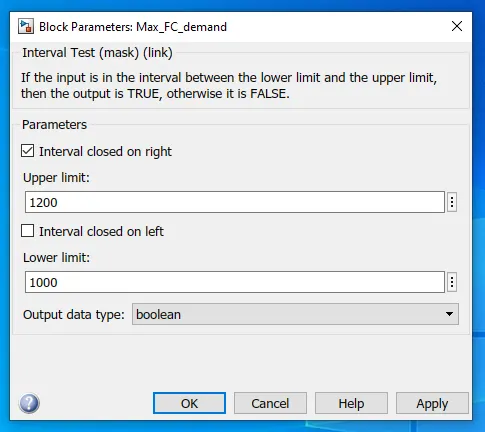
Place the "Interval test" block and set the maximum value above which the power demand will be supplied by the battery.
Step 3:
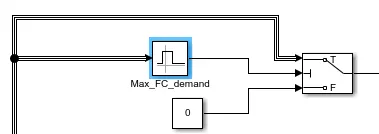
Use a switch to make sure that only the power demand limit which is set in the Interval test block is obtained. Connect as shown below
Step 4:
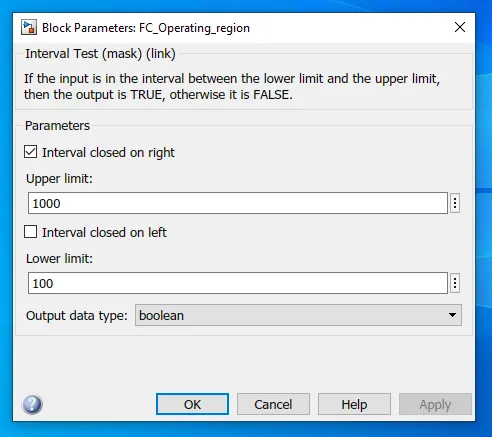
Follow step 2 and step 3 for power between 101 and 1000
Step 5:
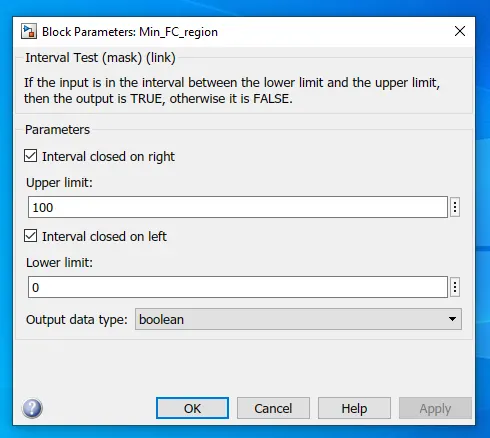
Follow steps 2 and step 3 for power between 0 and 100
Step 6:
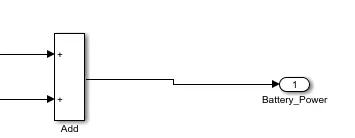
Since the battery will share the power between 0 to 100 and 1000 to 1200, add both the output from the switches as shown below
Step 7:
For fuel cell operating state use a switch with input as the power demand for value between 100 and 1000 as shown below
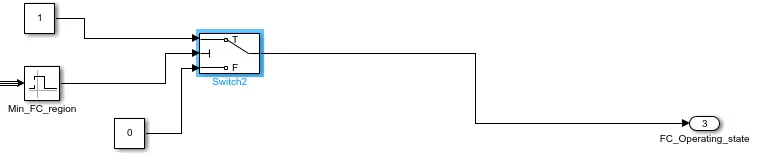
In this block, if the power is between 100 and 1000 the output from the switch will be 1(ON state) and if the input is above 1000 or below 100 the output will be 0(OFF state).
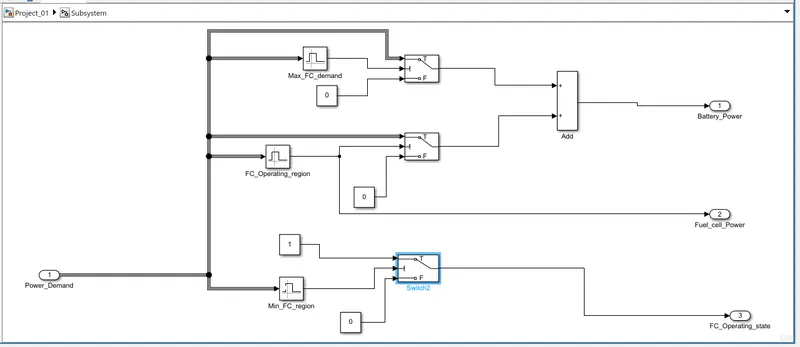
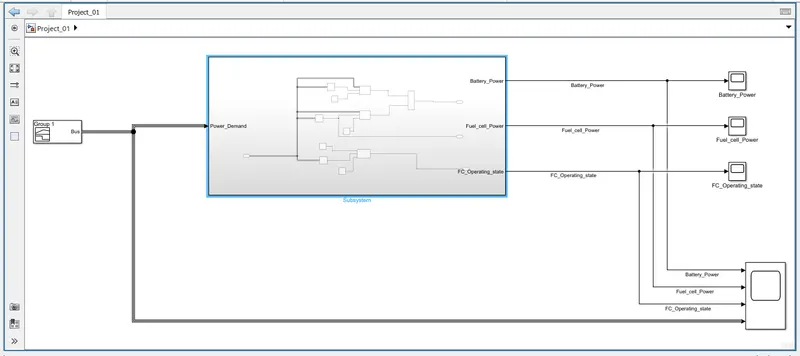
The overall block is shown below
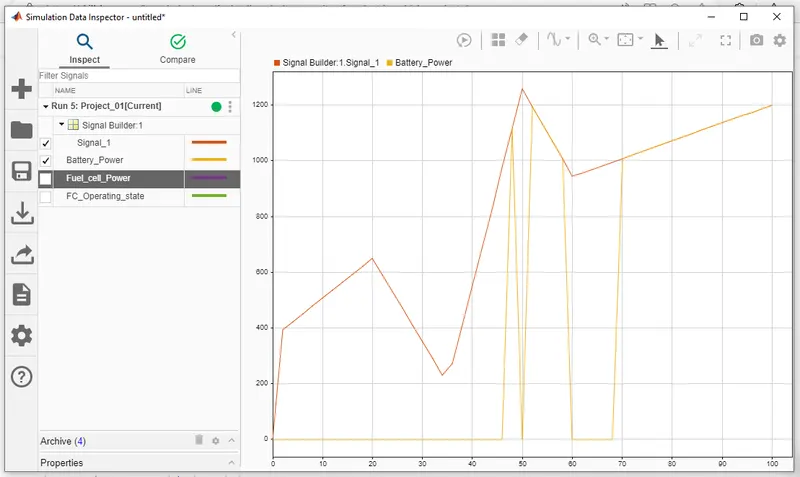
The Power demand (Input power) and the power delivered by the battery is shown below
As shown in the graph any power below 100 and power above 1000 is delivered by the battery.
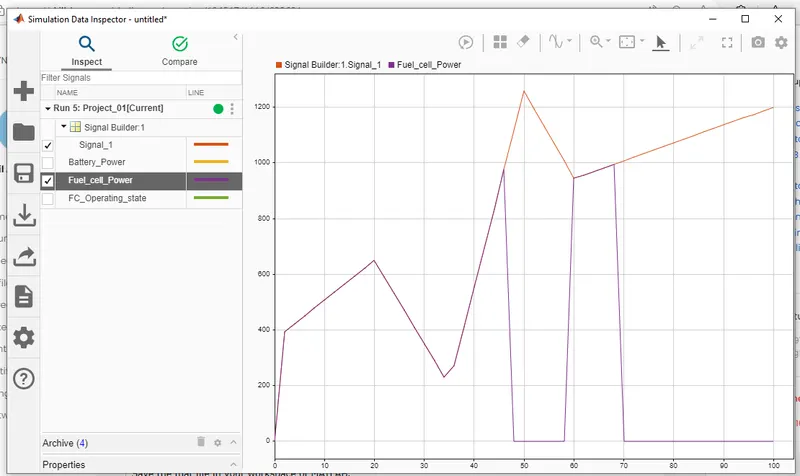
The Power demand (Input power) and the power delivered by the fuel cell are shown below
As shown in the graph any power between 101 and 1000 is delivered by the fuel cell.
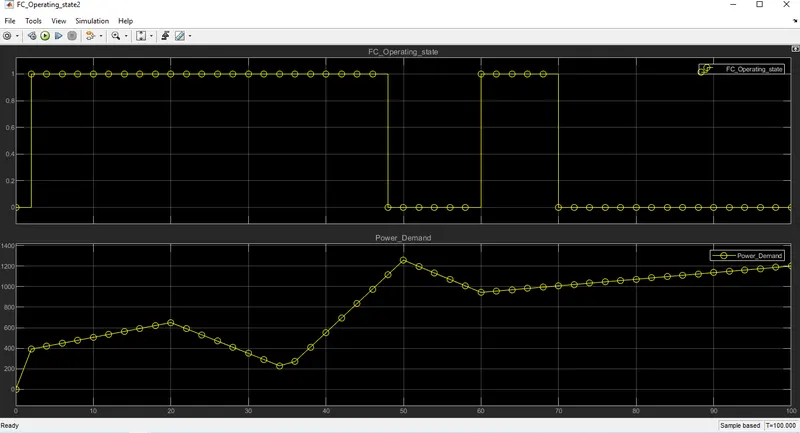
The operating state graph is shown below.
It is clearly understood that when the power demand (Input power) is between 101 and 1000 the output is 1 indicating that the operating state of fuel cell is ON and any power below 100 and above 1000 the output is 0 indicating that the operating state of fuel cell is OFF.