PARSING NASA THERMODYNAMIC DATA
OBJECTIVES:
1. To write a function that extracts the 14 temperature co-efficients and calculate properties like molecular weight, enthalpy, entropy and specific heats for all the species in the given data file.
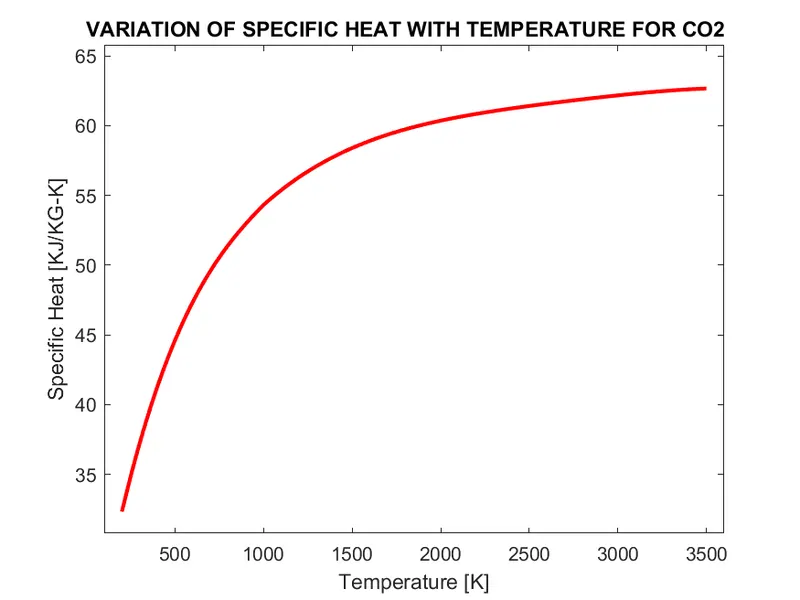
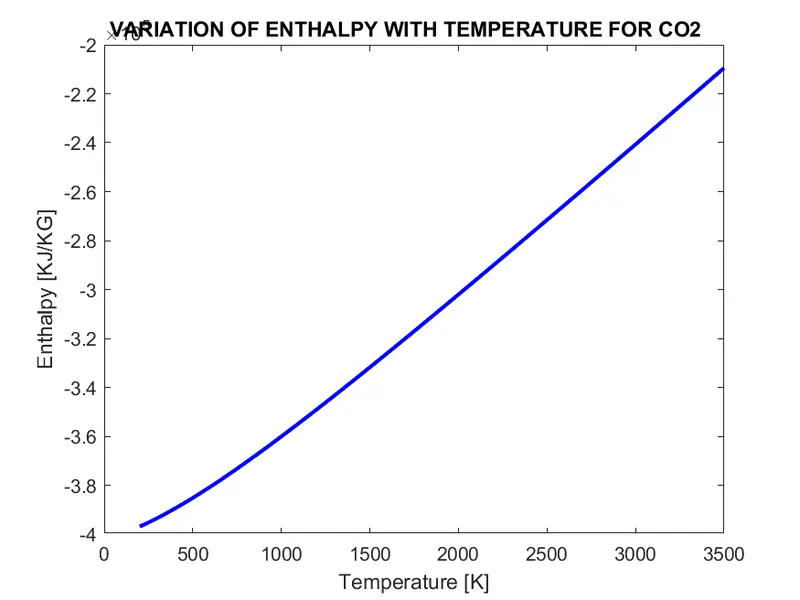
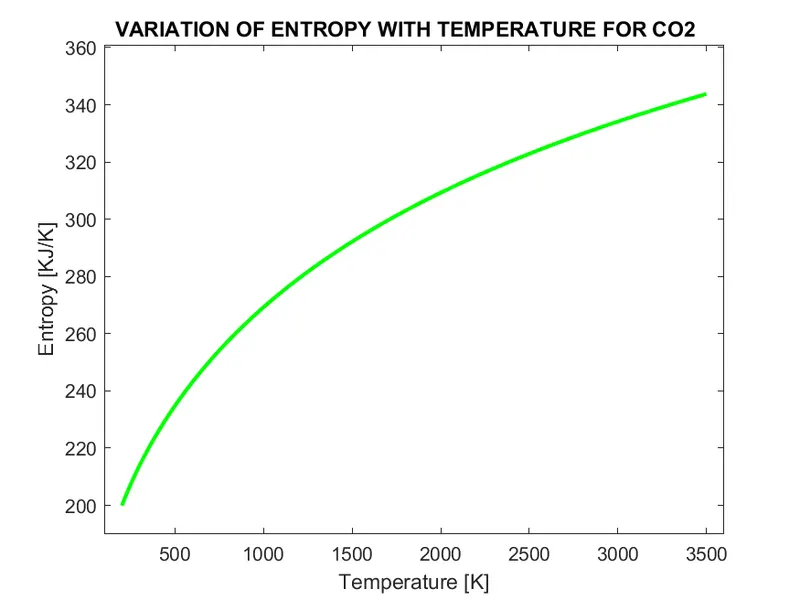
2. to plot the and save enthalpy, entropy and specific heats for the local temperature range spacific for each species and save those plots into seperate folders.
INTRODUCTION:
File Parsing:
Parsing in computer languages refers to syntactic analysis of the input code into its components parts in order to facilitate the writing of compilers and interpreters. It can be used to describe split or separation.
Parsing a file means reading in a data stream of some sort and building an in memory model of the semantic content of that data that can be easily manipulated. By doing this, we are going to split a string into parts then recognising the parts to convert into something simpler than a string.
Here in this project, we are going to parse the NASA thermodynamic data which is having 53 gas species values. To calculate the properties, species name, local temperatures and temperature coefficients are extracted from the data file.
NASA Thermodynamic data:
NASA came up with polynomials that can be used to evaluate thermodynamic properties such as `C_p`,`H`,`S`. These polynomials are given by
`C_p =(a_1 + a_2 T + a_3 T^2 + a_4 T^3 + a_5 T^4)R`
`H = (a_1 + (a_2T)/2 + (a_3 T^2)/3 + (a_4 T^3)/4 + (a_5 T^4)/5 + a_6/T)RT`
`S = (a_1 lnT + a_2T + (a_3 T^2)/2 + (a_4 T^3)/3 + (a_5 T^4)/4 + a_7)R`
where `a_1` to `a_7` are high temperature coefficients i.e if temperature lies between local high temperature to local average temperature.
`C_p =(a_8 + a_9 T + a_10 T^2 + a_11 T^3 + a_12 T^4)R`
`H = (a_8 + (a_9T)/2 + (a_10 T^2)/3 + (a_11 T^3)/4 + (a_12 T^4)/5 + a_13/T)RT`
`S = (a_8 lnT + a_9T + (a_10 T^2)/2 + (a_11 T^3)/3 + (a_12 T^4)/4 + a_14)R`
where `a_8` to `a_14` are low temperature coefficients i.e if temperature lies between local average temperature to local low temperature and `R` is the universal gas constant.
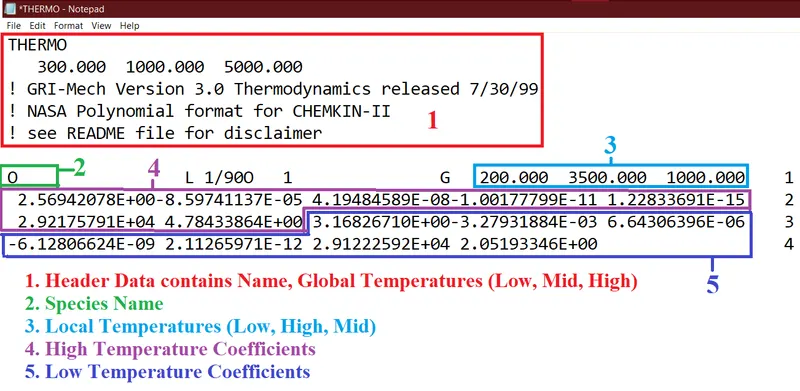
Format of NASA Thermodynamic data:
The format of NASA Thermodynamic data file looks as follows
CODE ALGORITHM:
Step 1: Open the file and read the data.
Command Use
f1 = fopen('THERMO.dat','r') Opens file THERMO.dat in read mode and stores into file f1
fgetl(f1) Used to obtain infomation line by line in file f1
Header contains 5 lines in which first line is name of file, second one is global temperature range and next 3 lines are comments.
Step 2: Selecting whether data is required for all species or a specific species.
- If data for all species selected, then the program will calculate properties for all species and plots the `T vs C_p`, `T vs H` and `T vs S` and storesthe plots in the species folder.
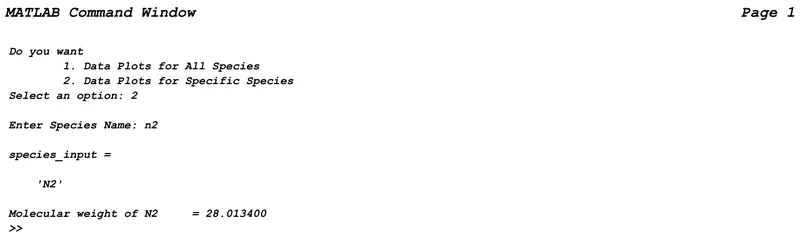
- If data for specific species is selected, name of the species is taken as input and converts the name into all upper case letters and compare the input species name all the species in the data file. If both the species names are matches, then that species number is given as input to calculate_properties function.
fprintf('Do you wantn')
fprintf('tt1. Data Plots for All Speciesn')
fprintf('tt2. Data Plots for Specific Speciesn')
option1 = input('Select an option: ');

if option1 == 1;
    % 'THERMO.dat' contains data for 53 species. To calcultate data for all species, 'for' loop from 1 to 53 is used.
    for k=1:53
        calculate_properties(k);
    end
elseif option1 == 2

   user_input = input('nEnter Species Name: ','s');
   species_input = upper(user_input)

   k=0;
   for i=1:53
        % Opening the NASA thermodynamic data file 'THERMO.dat'
        f2 = fopen('THERMO.dat','r');

        % Header Data in 'THERMO.dat" is in 5 lines. Skipping 5 lines using 'fgetl' command.
        % One of the header lines is Global Temperature(GT) range. Here we are skipping it since no where GT are used.
        for count = 1:5
            headercomment = fgetl(f2);
        end
       % Finding the Character number at the end of the header using 'ftell' command.
       header_end_charnum = ftell(f2);

       % After Header, Each species has data of 4 lines & Each line consists of 81 characters.
       % Character number at the start of each species for specific value of 'k' is given by
       charnum = header_end_charnum + 81*4*(i-1);
       % fseek(fileID, offset, origin) sets the file position indicator offset bytes from origin in the specified file.
       % offset - charnum
       % origin - bof (beginning of file)
       fseek(f2, charnum, 'bof');
       % Obtaining the first line of species data as character vector using 'fgetl' command.
       % It contains Species name and Local Temperature Range ( Low, High,Mid)
       line1 = fgetl(f2);
       % First six characters in line are Species name.
       species = line1(1:6);
       % strtok(str) parses str from left to right, using whitespace characters as delimiters,
       % and returns part or all of the text
       species_name = strtok(species);
       % Comparing the input species name with every species name in file
       if strcmp(species_input,species_name)
           k = i;
       end
       fclose(f2);
   end
   if k >=1 && 53 >= k
       calculate_properties(k);
   else
       disp('Enter Valid Species Name Only')
   end

else
    disp('select from the above given options only')
    disp('The value should be either 1 or 2')
end

fclose(f1);
Step 3: Function to calculate properties of species
function [MW] = calculate_properties(k)
where MW - molecular weight of the species
k - species number in the data file
- THERMO.dat file is opened using fopen command and first 5 lines in data file (which are header lines) are skipped using
- At the end of header lines, character number is obtained using ftell command.
- After header, each species data contains 4 lines and each line has 81 characters. Character number at the starting of specific species data is calculated and file position is set at that point using fseek command.
- First line is obtained using fgetl command which contains species name and local temperatures.
- These local temperatures are converted from character strings to numerical values using str2num command.
- Remaining 3 lines of species data contains 14 temperature coefficients which are in scientific form (for eg: 1.234E+01) which contains letter E in them and next 3 characters after E belongs to same number. After obtaining the line using fgetl command, positions of E in each line are obtained using findstr command.
- Using these positions of E, temperature coefficients are calculated.
- Temperature range is calculated using linspace command
- Properties in the temperature range are calculated using temperature coefficients and universal gas constant.
- Calculated properties are plotted for temperature range and these plots are saved into folder using saveas command. Specific folder for each species with its name is generated using mkdir command.
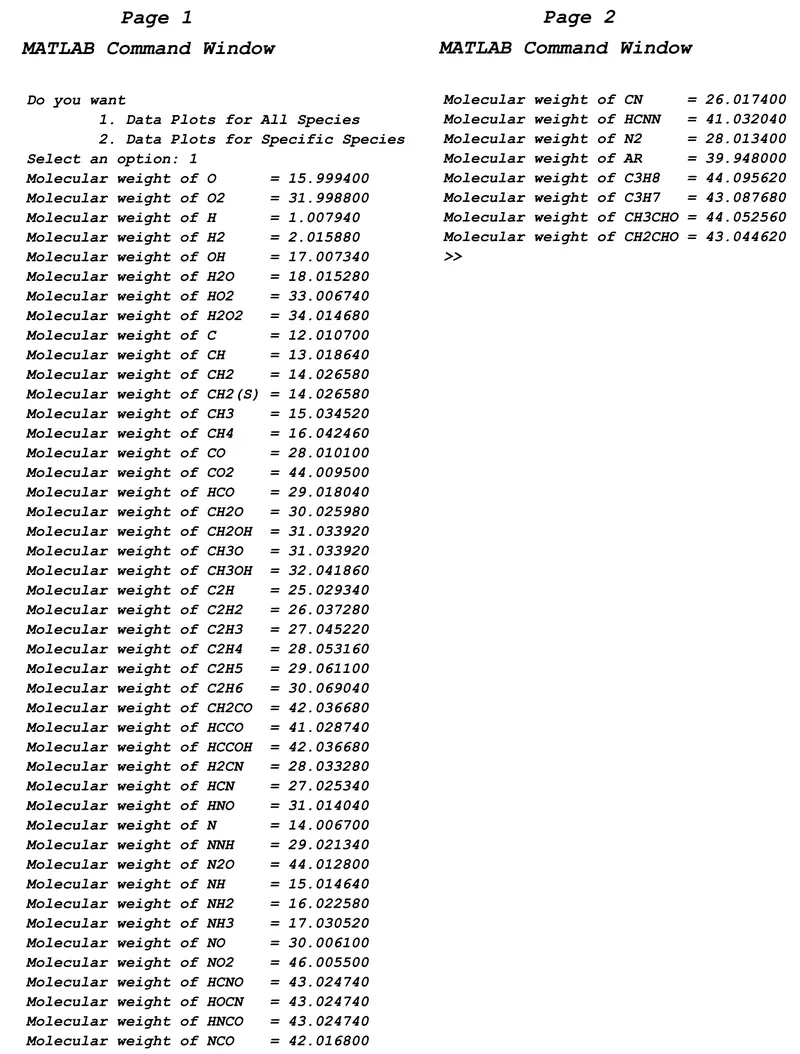
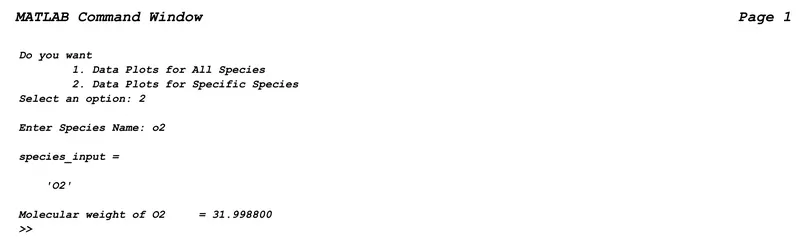
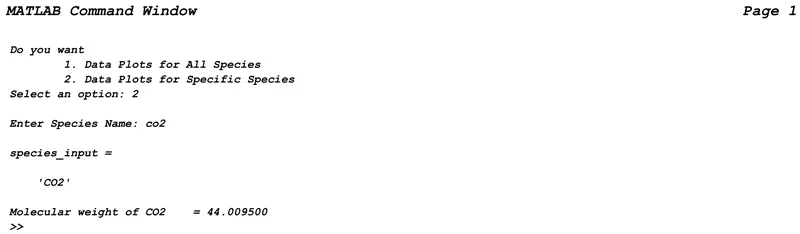
- Molecular weight of the input species is calculated and displayed in the command window
function [MW] = calculate_properties(k)
    % Universal Gas Constant value in J/mol-K or KJ/kmol-K
    R_Universal = 8.314;
    % Opening the NASA thermodynamic data file 'THERMO.dat'
    f3 = fopen('THERMO.dat','r');
    % Header Data in 'THERMO.dat" is in 5 lines. Skipping 5 lines using 'fgetl' command.
    for count = 1:5
        headercomment = fgetl(f3);
    end
    % Finding the Character number at the end of the header using 'ftell' command.
    header_end_charnum = ftell(f3);

    % After Header, Each species has data of 4 lines & Each line consists of 81 characters.
    % Character number at the start of each species for specific value of 'k' is given by
    charnum = header_end_charnum + 81*4*(k-1);
    % fseek(fileID, offset, origin) sets the file position indicator offset bytes from origin in the specified file.
    % offset - charnum
    % origin - bof (beginning of file)
    fseek(f3, charnum, 'bof');
    % Obtaining the first line of species data as character vector using 'fgetl' command.
    % It contains Species name and Local Temperature Range ( Low, High,Mid)
    line1 = fgetl(f3);
    % First six characters in line are Species name.
    species_name = line1(1:6);
    % Storing the Local Temperature values as character strings from line 1.
    Local_Low_Temp = line1(46:56);
    Local_High_Temp = line1(57:66);
    Local_Mid_Temp = line1(67:78);

    % Converting Local Temperature values as character strings into Numerical values
    Local_Low_Temp = str2num(Local_Low_Temp);
    Local_High_Temp = str2num(Local_High_Temp);
    Local_Mid_Temp = str2num(Local_Mid_Temp);


    % Obtaining the second line of species data as character vector using 'fgetl' command.
    % It contains 5 High Temperature coefficients
    charnum = header_end_charnum + 81*(4*(k-1)+1);
    fseek(f3, charnum, 'bof');
    line2 = fgetl(f3);

    % Obtaining the third line of species data as character vector using 'fgetl' command.
    % It contains 5 Temperature coefficients (1st two are High Temp and next 3 are Low Temp Coefficients)
    charnum = header_end_charnum + 81*(4*(k-1)+2);
    fseek(f3, charnum, 'bof');
    line3 = fgetl(f3);

    % Obtaining the fourth line of species data as character vector using 'fgetl' command.
    % It contains 4 Low Temperature coefficients
    charnum = header_end_charnum + 81*(4*(k-1)+3);
    fseek(f3, charnum, 'bof');
    line4 = fgetl(f3);

    % Temperature coefficients in Lines 2,3,4 are in scientific form. It contains 'E' in every coefficient.
    % To determine coefficients, location of 'E' is found in the line.
    a = findstr(line2,'E');
    b = findstr(line3,'E');
    c = findstr(line4,'E');

    % Each Coefficient is in the form 0.51536188E+05. Ater 'E', 3 characters are of that coefficient only.
    % High Temp Coefficients denoted with A1 - A7.
    % Low Temp Coefficients denoted with B1 - B7.
    % 5 High Temp Coefficients from line 2 stored as Character Strings.
    A1 = line2(1:(a(1)+3));
    A2 = line2(((a(1)+4):(a(2)+3)));
    A3 = line2(((a(2)+4):(a(3)+3)));
    A4 = line2(((a(3)+4):(a(4)+3)));
    A5 = line2(((a(4)+4):(a(5)+3)));
    % 2 High Temp Coefficients and 3 Low Temp Coefficients from line 3 stored as Character Strings.
    A6 = line3(1:(b(1)+3));
    A7 = line3(((b(1)+4):(b(2)+3)));
    B1 = line3(((b(2)+4):(b(3)+3)));
    B2 = line3(((b(3)+4):(b(4)+3)));
    B3 = line3(((b(4)+4):(b(5)+3)));
    % 4 Low Temp Coefficients from line 4 stored as Character Strings
    B4 = line4(1:(c(1)+3));
    B5 = line4(((c(1)+4):(c(2)+3)));
    B6 = line4(((c(2)+4):(c(3)+3)));
    B7 = line4(((c(3)+4):(c(4)+3)));

    % Converting all Temperature Coefficients from Character Strings to Numerical Values
    A1 = str2num(A1);
    A2 = str2num(A2);
    A3 = str2num(A3);
    A4 = str2num(A4);
    A5 = str2num(A5);
    A6 = str2num(A6);
    A7 = str2num(A7);
    B1 = str2num(B1);
    B2 = str2num(B2);
    B3 = str2num(B3);
    B4 = str2num(B4);
    B5 = str2num(B5);
    B6 = str2num(B6);
    B7 = str2num(B7);

    % Dividing Temperature Range(Local Low - Local High) in particular no of divisions using linspace command
    Temperature_Range = linspace(Local_Low_Temp,Local_High_Temp, 1000);

    % Calculation of properties Specific heat, Enthalpy, Entropy using Temperatue coefficients
    Cp = specific_heat_function(A1,A2,A3,A4,A5,B1,B2,B3,B4,B5,R_Universal,Temperature_Range,Local_Mid_Temp);
    S = entropy_function(A1,A2,A3,A4,A5,A7,B1,B2,B3,B4,B5,B7,R_Universal,Temperature_Range,Local_Mid_Temp);
    H = enthalpy_function(A1,A2,A3,A4,A5,A6,B1,B2,B3,B4,B5,B6,R_Universal,Temperature_Range,Local_Mid_Temp);

    % Plotting Temperature vs Specific Heat
    figure(1)
    plot(Temperature_Range, Cp, 'linewidth', 2, 'color', 'r');
    xlabel('Temperature [K]');
    ylabel('Specific Heat [KJ/KG-K]');
    title(sprintf('VARIATION OF SPECIFIC HEAT WITH TEMPERATURE FOR %s',species_name));
    % axis([Local_Low_Temp-100 Local_High_Temp+100 0.95*Cp(1) 1.05*Cp(end)])

    % Plotting Temperature vs Enthalpy
    figure(2)
    plot(Temperature_Range, H, 'linewidth', 2, 'color', 'b');
    xlabel('Temperature [K]');
    ylabel('Enthalpy [KJ/KG]');
    title(sprintf('VARIATION OF ENTHALPY WITH TEMPERATURE FOR %s',species_name));
    % axis([Local_Low_Temp-100 Local_High_Temp+100 0.95*H(1) 1.05*H(end)])

    % Plotting Temperature vs Entropy
    figure(3)
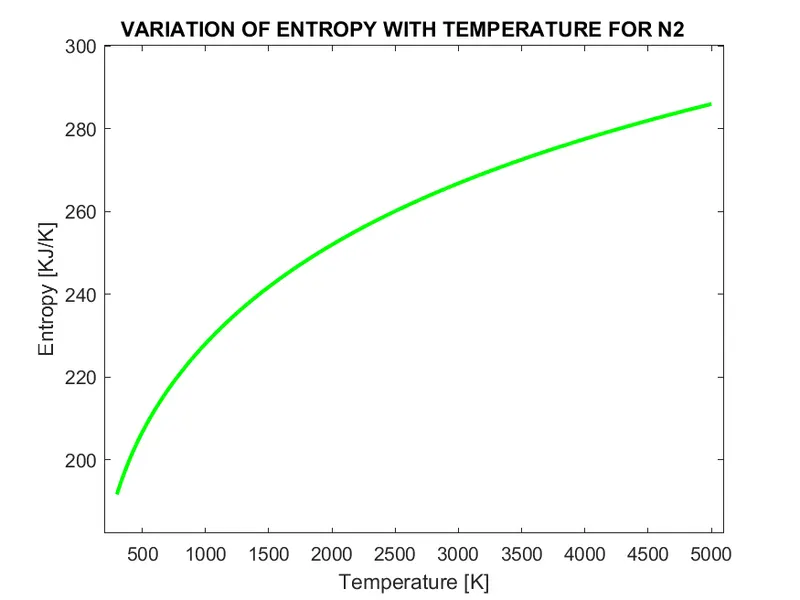
    plot(Temperature_Range, S, 'linewidth', 2, 'color', 'g');
    xlabel('Temperature [K]');
    ylabel('Entropy [KJ/K]');
    title(sprintf('VARIATION OF ENTROPY WITH TEMPERATURE FOR %s',species_name));
    % axis([Local_Low_Temp-100 Local_High_Temp+100 0.95*S(1) 1.05*S(end)])

    % Creation of folder to store plots for specific species using 'mkdir'
    mkdir(['E:SKILL-LYNCIntro2MATLABCHALLENGESProject_1Species',species_name]);
    directory = (['E:SKILL-LYNCIntro2MATLABCHALLENGESProject_1Species',species_name]);
    % Browsing into Species Name folder using 'cd' command
    cd(directory);
    % saveas(fig,filename) saves the figure specified by 'fig' to file 'filename'.
    % Specify the file name as a character vector or string that includes a file extension, for e.g, 'myplot.jpg'.
    saveas(1,'SpecificHeat.png');
    saveas(2,'Enthalpy.png');
    saveas(3,'Entropy.png');
    cd(['E:SKILL-LYNCIntro2MATLABCHALLENGESProject_1']);
    fclose(f3);

    % Calculation of Molecular weight of the species.
    MW = molecular_weight_function(species_name);

end
Step 4: Function to calculate Specific Heat
function [C_p] = specific_heat_function(a1,a2,a3,a4,a5,a8,a9,a10,a11,a12,R,T,mid_temp)
    for i = 1:length(T)
        if T(i) > mid_temp
            C_p(i) = R*(a1 + a2*T(i) + a3*(T(i))^2 + a4*(T(i))^3 + a5*(T(i))^4);
        else
            C_p(i) = R*(a8 + a9*T(i) + a10*(T(i))^2 + a11*(T(i))^3 + a12*(T(i))^4);
        end
    end
end
Step 5: Function to calculate Entropy
function [S] = entropy_function(a1,a2,a3,a4,a5,a7,a8,a9,a10,a11,a12,a14,R,T,mid_temp)
    for i = 1:length(T)
        if T(i) > mid_temp
            S(i) = R*(a1*log(T(i)) + a2*T(i) + a3*(((T(i))^2)/2) + a4*(((T(i))^3)/3) + a5*(((T(i))^4)/4) + a7);
        else
            S(i) = R*(a8*log(T(i)) + a9*T(i) + a10*(((T(i))^2)/2) + a11*(((T(i))^3)/3) + a12*(((T(i))^4)/4) + a14);
        end
    end
end
Step 6: Function to calculate Enthalpy
function [H] = enthalpy_function(a1,a2,a3,a4,a5,a6,a8,a9,a10,a11,a12,a13,R,T,mid_temp)
    for i = 1:length(T)
        if T(i) > mid_temp
            H(i) = R*T(i)*(a1 + a2*(T(i)/2) + a3*(((T(i))^2)/3) + a4*(((T(i))^3)/4) + a5*(((T(i))^4)/5) + a6/T(i));
        else
            H(i) = R*T(i)*(a8 + a9*(T(i)/2) + a10*(((T(i))^2)/3) + a11*(((T(i))^3)/4) + a12*(((T(i))^4)/5) + a13/T(i));
        end
    end
end
Step 7: Function to calculate Molecular Weight
- It take species name as input and gives its molecular weight as output.
- Basic constituents in all the given species are H, C, N, O, Ar and its atomics are defined.
- 'for' loop inside a 'for' loop is created to compare the charcters of Species Name with Constituents. If both are matched, atomic weight of that constituent is added to Molecular Weight & its position is noted
- If the Species has 'n' number of one Basic Constituent, Atomic weight of that basic constituent is multiplied by (n-1) as one time is already added above loop.
function MolecularWeight = molecular_weight_function(speciesname)

    % Converting characters of Species Name in to Upper case
    species = upper(speciesname);
    % Basic Constituents in all Species
    constituents = ['H', 'C', 'N', 'O', 'A'];
    % Atomic Weights of Basic Constituents elements.
    Atomic_weight = [1.00794, 12.0107 14.0067 15.9994 39.948];

    % 'for' loop inside a 'for' loop is created to compare the charcters of Species Name with Constituents
    % If both are matched, atomic weight of that constituent is added to Molecular Weight & its position is noted.
    MolecularWeight = 0;
    for i = 1:length(species)
        for j= 1:length(constituents)
            if strcmp(species(i), constituents(j))
               MolecularWeight = MolecularWeight + Atomic_weight(j);
               position = j;
            end
        end
        % If the Species has 'n' number of one Basic Constituent,
        % Atomic weight of that basic constituent is multiplied by (n-1) as one time is already added above loop.
        n = str2num(species(i));
        if n>1
            MolecularWeight = MolecularWeight + Atomic_weight(position)*(n-1);
        end
    end
    % Printing the Molecular Weight of Species.
    fprintf('Molecular weight of %s = %fn',species,MolecularWeight);
end
CODE:
% Parsing NASA thermodynamic data
clear all
close all
clc

% Opening the NASA thermodynamic data file 'THERMO.dat'
f1 = fopen('THERMO.dat','r');

% Header Data in 'THERMO.dat" is in 5 lines. Skipping 5 lines using 'fgetl' command.
% One of the header lines is Global Temperature(GT) range. Here we are skipping it since no where GT are used.
for count = 1:5
    headercomment = fgetl(f1);
end
% Header = fgetl(f1);
% Global_Temp = fgetl(f1);
% % GTemp = strsplit(Global_Temp,' ')
% % Global_Low_Temp = str2double(GTemp(2))
% % Global_Mid_Temp = str2double(GTemp(3))
% % Global_High_Temp = str2double(GTemp(4))


fprintf('Do you want\n')
fprintf('\t\t1. Data Plots for All Species\n')
fprintf('\t\t2. Data Plots for Specific Species\n')
option1 = input('Select an option: ');

if option1 == 1;
    % 'THERMO.dat' contains data for 53 species. To calcultate data for all species, 'for' loop from 1 to 53 is used.
    for k=1:53
        calculate_properties(k);
    end
elseif option1 == 2

   user_input = input('\nEnter Species Name: ','s');
   species_input = upper(user_input)

   k=0;
   for i=1:53
        % Opening the NASA thermodynamic data file 'THERMO.dat'
        f2 = fopen('THERMO.dat','r');

        % Header Data in 'THERMO.dat" is in 5 lines. Skipping 5 lines using 'fgetl' command.
        % One of the header lines is Global Temperature(GT) range. Here we are skipping it since no where GT are used.
        for count = 1:5
            headercomment = fgetl(f2);
        end
       % Finding the Character number at the end of the header using 'ftell' command.
       header_end_charnum = ftell(f2);

       % After Header, Each species has data of 4 lines & Each line consists of 81 characters.
       % Character number at the start of each species for specific value of 'k' is given by
       charnum = header_end_charnum + 81*4*(i-1);
       % fseek(fileID, offset, origin) sets the file position indicator offset bytes from origin in the specified file.
       % offset - charnum
       % origin - bof (beginning of file)
       fseek(f2, charnum, 'bof');
       % Obtaining the first line of species data as character vector using 'fgetl' command.
       % It contains Species name and Local Temperature Range ( Low, High,Mid)
       line1 = fgetl(f2);
       % First six characters in line are Species name.
       species = line1(1:6);
       % strtok(str) parses str from left to right, using whitespace characters as delimiters,
       % and returns part or all of the text
       species_name = strtok(species);
       % Comparing the input species name with every species name in file
       if strcmp(species_input,species_name)
           k = i;
       end
       fclose(f2);
   end
   if k >=1 && 53 >= k
       calculate_properties(k);
   else
       disp('Enter Valid Species Name Only')
   end

else
    disp('select from the above given options only')
    disp('The value should be either 1 or 2')
end

fclose(f1);

%%%%%%%%%%%%%%%%%%%%%%%%%%%%%%%%%%%%%%%%%%%%%%%%%%%%%%%%%%%%%%%%%%%%%%%%%%%%%%%%%%%%%%%%%%%%%%%%%%%%
%%%%%%%%%%%% Function to Calculate Properties and create Data Plots for Specific Species %%%%%%%%%%%
%%%%%%%%%%%%%%%%%%%%%%%%%%%%%%%%%%%%%%%%%%%%%%%%%%%%%%%%%%%%%%%%%%%%%%%%%%%%%%%%%%%%%%%%%%%%%%%%%%%%
function [MW] = calculate_properties(k)
    % Universal Gas Constant value in J/mol-K or KJ/kmol-K
    R_Universal = 8.314;
    % Opening the NASA thermodynamic data file 'THERMO.dat'
    f3 = fopen('THERMO.dat','r');
    % Header Data in 'THERMO.dat" is in 5 lines. Skipping 5 lines using 'fgetl' command.
    for count = 1:5
        headercomment = fgetl(f3);
    end
    % Finding the Character number at the end of the header using 'ftell' command.
    header_end_charnum = ftell(f3);

    % After Header, Each species has data of 4 lines & Each line consists of 81 characters.
    % Character number at the start of each species for specific value of 'k' is given by
    charnum = header_end_charnum + 81*4*(k-1);
    % fseek(fileID, offset, origin) sets the file position indicator offset bytes from origin in the specified file.
    % offset - charnum
    % origin - bof (beginning of file)
    fseek(f3, charnum, 'bof');
    % Obtaining the first line of species data as character vector using 'fgetl' command.
    % It contains Species name and Local Temperature Range ( Low, High,Mid)
    line1 = fgetl(f3);
    % First six characters in line are Species name.
    species_name = line1(1:6);
    % Storing the Local Temperature values as character strings from line 1.
    Local_Low_Temp = line1(46:56);
    Local_High_Temp = line1(57:66);
    Local_Mid_Temp = line1(67:78);

    % Converting Local Temperature values as character strings into Numerical values
    Local_Low_Temp = str2num(Local_Low_Temp);
    Local_High_Temp = str2num(Local_High_Temp);
    Local_Mid_Temp = str2num(Local_Mid_Temp);


    % Obtaining the second line of species data as character vector using 'fgetl' command.
    % It contains 5 High Temperature coefficients
    charnum = header_end_charnum + 81*(4*(k-1)+1);
    fseek(f3, charnum, 'bof');
    line2 = fgetl(f3);

    % Obtaining the third line of species data as character vector using 'fgetl' command.
    % It contains 5 Temperature coefficients (1st two are High Temp and next 3 are Low Temp Coefficients)
    charnum = header_end_charnum + 81*(4*(k-1)+2);
    fseek(f3, charnum, 'bof');
    line3 = fgetl(f3);

    % Obtaining the fourth line of species data as character vector using 'fgetl' command.
    % It contains 4 Low Temperature coefficients
    charnum = header_end_charnum + 81*(4*(k-1)+3);
    fseek(f3, charnum, 'bof');
    line4 = fgetl(f3);

    % Temperature coefficients in Lines 2,3,4 are in scientific form. It contains 'E' in every coefficient.
    % To determine coefficients, location of 'E' is found in the line.
    a = findstr(line2,'E');
    b = findstr(line3,'E');
    c = findstr(line4,'E');

    % Each Coefficient is in the form 0.51536188E+05. Ater 'E', 3 characters are of that coefficient only.
    % High Temp Coefficients denoted with A1 - A7.
    % Low Temp Coefficients denoted with B1 - B7.
    % 5 High Temp Coefficients from line 2 stored as Character Strings.
    A1 = line2(1:(a(1)+3));
    A2 = line2(((a(1)+4):(a(2)+3)));
    A3 = line2(((a(2)+4):(a(3)+3)));
    A4 = line2(((a(3)+4):(a(4)+3)));
    A5 = line2(((a(4)+4):(a(5)+3)));
    % 2 High Temp Coefficients and 3 Low Temp Coefficients from line 3 stored as Character Strings.
    A6 = line3(1:(b(1)+3));
    A7 = line3(((b(1)+4):(b(2)+3)));
    B1 = line3(((b(2)+4):(b(3)+3)));
    B2 = line3(((b(3)+4):(b(4)+3)));
    B3 = line3(((b(4)+4):(b(5)+3)));
    % 4 Low Temp Coefficients from line 4 stored as Character Strings
    B4 = line4(1:(c(1)+3));
    B5 = line4(((c(1)+4):(c(2)+3)));
    B6 = line4(((c(2)+4):(c(3)+3)));
    B7 = line4(((c(3)+4):(c(4)+3)));

    % Converting all Temperature Coefficients from Character Strings to Numerical Values
    A1 = str2num(A1);
    A2 = str2num(A2);
    A3 = str2num(A3);
    A4 = str2num(A4);
    A5 = str2num(A5);
    A6 = str2num(A6);
    A7 = str2num(A7);
    B1 = str2num(B1);
    B2 = str2num(B2);
    B3 = str2num(B3);
    B4 = str2num(B4);
    B5 = str2num(B5);
    B6 = str2num(B6);
    B7 = str2num(B7);

    % Dividing Temperature Range(Local Low - Local High) in particular no of divisions using linspace command
    Temperature_Range = linspace(Local_Low_Temp,Local_High_Temp, 1000);

    % Calculation of properties Specific heat, Enthalpy, Entropy using Temperatue coefficients
    Cp = specific_heat_function(A1,A2,A3,A4,A5,B1,B2,B3,B4,B5,R_Universal,Temperature_Range,Local_Mid_Temp);
    S = entropy_function(A1,A2,A3,A4,A5,A7,B1,B2,B3,B4,B5,B7,R_Universal,Temperature_Range,Local_Mid_Temp);
    H = enthalpy_function(A1,A2,A3,A4,A5,A6,B1,B2,B3,B4,B5,B6,R_Universal,Temperature_Range,Local_Mid_Temp);

    % Plotting Temperature vs Specific Heat
    figure(1)
    plot(Temperature_Range, Cp, 'linewidth', 2, 'color', 'r');
    xlabel('Temperature [K]');
    ylabel('Specific Heat [KJ/KG-K]');
    title(sprintf('VARIATION OF SPECIFIC HEAT WITH TEMPERATURE FOR %s',species_name));
    % axis([Local_Low_Temp-100 Local_High_Temp+100 0.95*Cp(1) 1.05*Cp(end)])

    % Plotting Temperature vs Enthalpy
    figure(2)
    plot(Temperature_Range, H, 'linewidth', 2, 'color', 'b');
    xlabel('Temperature [K]');
    ylabel('Enthalpy [KJ/KG]');
    title(sprintf('VARIATION OF ENTHALPY WITH TEMPERATURE FOR %s',species_name));
    % axis([Local_Low_Temp-100 Local_High_Temp+100 0.95*H(1) 1.05*H(end)])

    % Plotting Temperature vs Entropy
    figure(3)
    plot(Temperature_Range, S, 'linewidth', 2, 'color', 'g');
    xlabel('Temperature [K]');
    ylabel('Entropy [KJ/K]');
    title(sprintf('VARIATION OF ENTROPY WITH TEMPERATURE FOR %s',species_name));
    % axis([Local_Low_Temp-100 Local_High_Temp+100 0.95*S(1) 1.05*S(end)])

    % Creation of folder to store plots for specific species using 'mkdir'
    mkdir(['E:\SKILL-LYNC\Intro2MATLAB\CHALLENGES\Project_1\Species\',species_name]);
    directory = (['E:\SKILL-LYNC\Intro2MATLAB\CHALLENGES\Project_1\Species\',species_name]);
    % Browsing into Species Name folder using 'cd' command
    cd(directory);
    % saveas(fig,filename) saves the figure specified by 'fig' to file 'filename'.
    % Specify the file name as a character vector or string that includes a file extension, for e.g, 'myplot.jpg'.
    saveas(1,'SpecificHeat.png');
    saveas(2,'Enthalpy.png');
    saveas(3,'Entropy.png');
    cd(['E:\SKILL-LYNC\Intro2MATLAB\CHALLENGES\Project_1']);
    fclose(f3);

    % Calculation of Molecular weight of the species.
    MW = molecular_weight_function(species_name);

end

%%%%%%%%%%%%%%%%%%%%%%%%%%%%%%%%%%%%%%%%%%%%%%%%%%%%%%%%%%%%%%%%%%%%%%%%%%%%%%%%%%%%%%%%%%%%%%%%%%%%
%%%%%%%%%%%%%%%%%% Function to Calculate Specific Heat for Different Temperatures %%%%%%%%%%%%%%%%%%
%%%%%%%%%%%%%%%%%%%%%%%%%%%%%%%%%%%%%%%%%%%%%%%%%%%%%%%%%%%%%%%%%%%%%%%%%%%%%%%%%%%%%%%%%%%%%%%%%%%%
function [C_p] = specific_heat_function(a1,a2,a3,a4,a5,a8,a9,a10,a11,a12,R,T,mid_temp)
    for i = 1:length(T)
        if T(i) > mid_temp
            C_p(i) = R*(a1 + a2*T(i) + a3*(T(i))^2 + a4*(T(i))^3 + a5*(T(i))^4);
        else
            C_p(i) = R*(a8 + a9*T(i) + a10*(T(i))^2 + a11*(T(i))^3 + a12*(T(i))^4);
        end
    end
end

%%%%%%%%%%%%%%%%%%%%%%%%%%%%%%%%%%%%%%%%%%%%%%%%%%%%%%%%%%%%%%%%%%%%%%%%%%%%%%%%%%%%%%%%%%%%%%%%%%%%
%%%%%%%%%%%%%%%%%%%% Function to Calculate Entropy for Different Temperatures %%%%%%%%%%%%%%%%%%%%%%
%%%%%%%%%%%%%%%%%%%%%%%%%%%%%%%%%%%%%%%%%%%%%%%%%%%%%%%%%%%%%%%%%%%%%%%%%%%%%%%%%%%%%%%%%%%%%%%%%%%%
function [S] = entropy_function(a1,a2,a3,a4,a5,a7,a8,a9,a10,a11,a12,a14,R,T,mid_temp)
    for i = 1:length(T)
        if T(i) > mid_temp
            S(i) = R*(a1*log(T(i)) + a2*T(i) + a3*(((T(i))^2)/2) + a4*(((T(i))^3)/3) + a5*(((T(i))^4)/4) + a7);
        else
            S(i) = R*(a8*log(T(i)) + a9*T(i) + a10*(((T(i))^2)/2) + a11*(((T(i))^3)/3) + a12*(((T(i))^4)/4) + a14);
        end
    end
end

%%%%%%%%%%%%%%%%%%%%%%%%%%%%%%%%%%%%%%%%%%%%%%%%%%%%%%%%%%%%%%%%%%%%%%%%%%%%%%%%%%%%%%%%%%%%%%%%%%%%
%%%%%%%%%%%%%%%%%%%%% Function to calculate Enthalpy for Different Temperatures %%%%%%%%%%%%%%%%%%%%
%%%%%%%%%%%%%%%%%%%%%%%%%%%%%%%%%%%%%%%%%%%%%%%%%%%%%%%%%%%%%%%%%%%%%%%%%%%%%%%%%%%%%%%%%%%%%%%%%%%%
function [H] = enthalpy_function(a1,a2,a3,a4,a5,a6,a8,a9,a10,a11,a12,a13,R,T,mid_temp)
    for i = 1:length(T)
        if T(i) > mid_temp
            H(i) = R*T(i)*(a1 + a2*(T(i)/2) + a3*(((T(i))^2)/3) + a4*(((T(i))^3)/4) + a5*(((T(i))^4)/5) + a6/T(i));
        else
            H(i) = R*T(i)*(a8 + a9*(T(i)/2) + a10*(((T(i))^2)/3) + a11*(((T(i))^3)/4) + a12*(((T(i))^4)/5) + a13/T(i));
        end
    end
end

%%%%%%%%%%%%%%%%%%%%%%%%%%%%%%%%%%%%%%%%%%%%%%%%%%%%%%%%%%%%%%%%%%%%%%%%%%%%%%%%%%%%%%%%%%%%%%%%%%%%
%%%%%%%%%%%%%%%%%%%% Function to Calculate Molecular Weight of Specific Species %%%%%%%%%%%%%%%%%%%%
%%%%%%%%%%%%%%%%%%%%%%%%%%%%%%%%%%%%%%%%%%%%%%%%%%%%%%%%%%%%%%%%%%%%%%%%%%%%%%%%%%%%%%%%%%%%%%%%%%%%
function MolecularWeight = molecular_weight_function(speciesname)

    % Converting characters of Species Name in to Upper case
    species = upper(speciesname);
    % Basic Constituents in all Species
    constituents = ['H', 'C', 'N', 'O', 'A'];
    % Atomic Weights of Basic Constituents elements.
    Atomic_weight = [1.00794, 12.0107 14.0067 15.9994 39.948];

    % 'for' loop inside a 'for' loop is created to compare the charcters of Species Name with Constituents
    % If both are matched, atomic weight of that constituent is added to Molecular Weight & its position is noted.
    MolecularWeight = 0;
    for i = 1:length(species)
        for j= 1:length(constituents)
            if strcmp(species(i), constituents(j))
               MolecularWeight = MolecularWeight + Atomic_weight(j);
               position = j;
            end
        end
        % If the Species has 'n' number of one Basic Constituent,
        % Atomic weight of that basic constituent is multiplied by (n-1) as one time is already added above loop.
        n = str2num(species(i));
        if n>1
            MolecularWeight = MolecularWeight + Atomic_weight(position)*(n-1);
        end
    end
    % Printing the Molecular Weight of Species.
    fprintf('Molecular weight of %s = %f\n',species,MolecularWeight);
end
OUTPUT:
For all species:
1. Command window
2. Screenshot of the window where all the folders are saved.

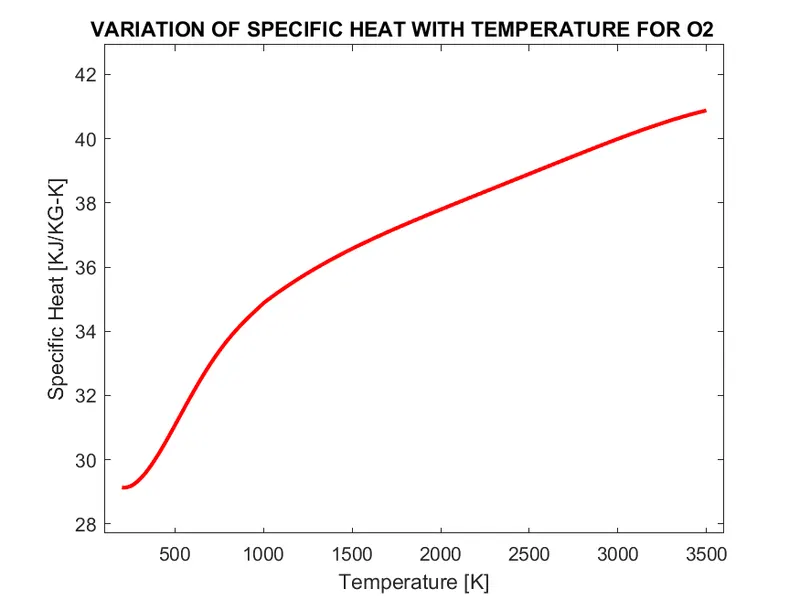
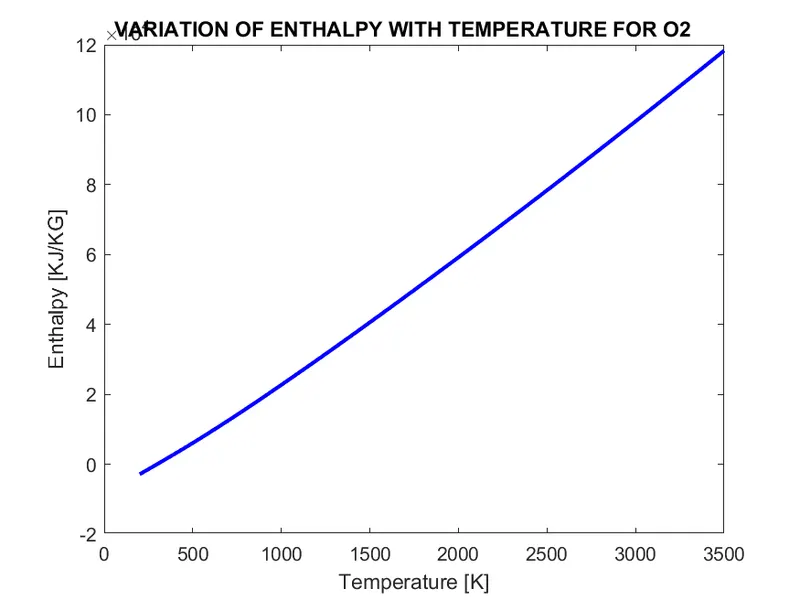
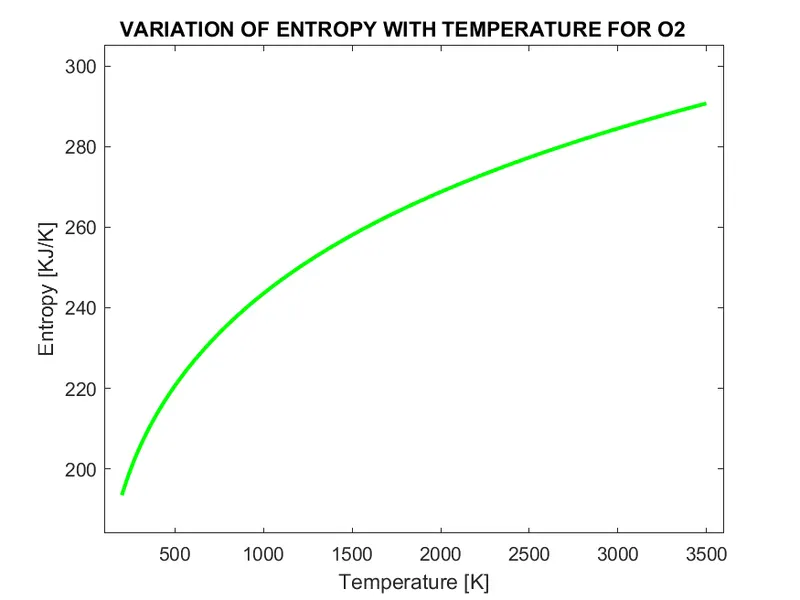
For Specific Species: O2
1. Command window
2. Specific heat, Enthalpy and Entropy plots for the local temperature range
For Specific Species: N2
1. Command window
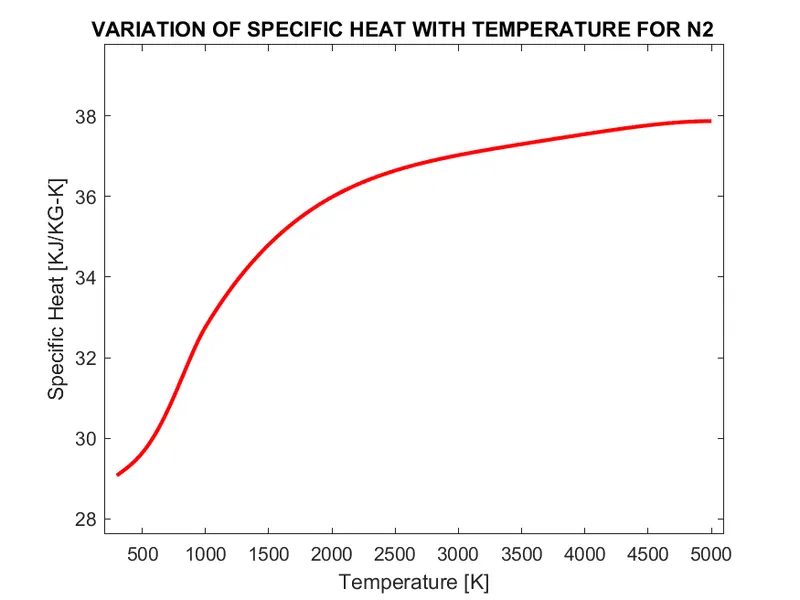
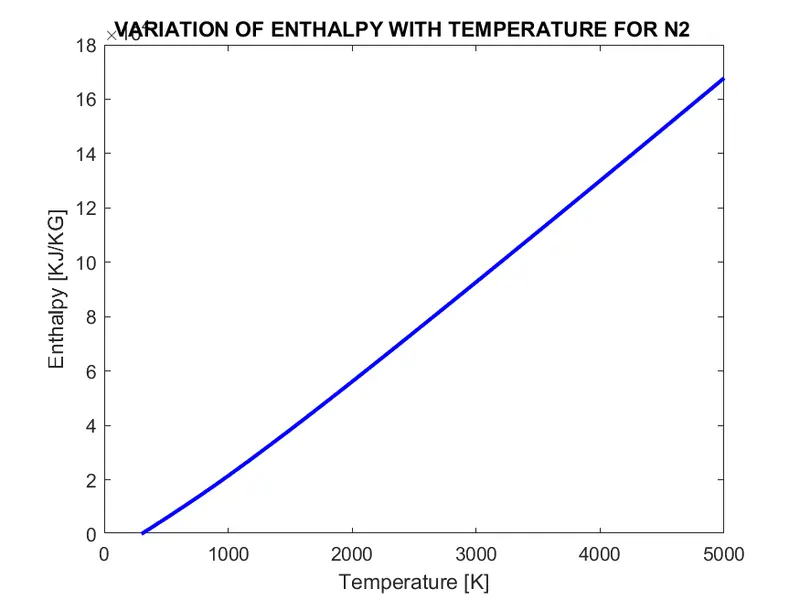
2. Specific heat, Enthalpy and Entropy plots for the local temperature range
For Specific Species: CO2
1. Command window
2. Specific heat, Enthalpy and Entropy plots for the local temperature range