PARSING NASA THERMODYNAMIC DATA
AIM
NASA came up with polynomials that can be used to evaluate thermodynamic properties such as Cp, H, and S. They have also documented the coefficients that are required to evaluate these polynomials for 1000+ species. In this project, we are going to Parsing this data file for 53 species. Our aim is to extract necessary information from this file and evaluate them to plot the properties of these species. The process of extracting information from any file is known as File Parsing.
GOVERNING EQUATION:
we are going to calculate Specific Heat( Cp ), Enthalpy( H), Entropy(S ) of the 53 species recorded on the file.
SPECIFIC HEAT(Cp)
`Cp/R=a1+a2×T+a3 × T^(2 )+ a4×T^3+ a5×T^4`
ENTHALPY(H)
`H/(R×T)=a1+ (a2×T)/2+(a3 × T^(2 ))/3+ (a4×T^3)/4+ (a5×T^4)/5+ a6/T`
ENTROPY(S)
`S/R=a1× lnT + a2×T + (a3 × T^(2 ))/2+ (a4×T^3)/3+ (a5×T^4)/4+ a7`
UNIVERSAL GAS CONSTANT(R)
R = 8.314
OBJECTIVE
- Write a function that extracts the 14 co-efficient and calculates the enthalpy, entropy and specific heats for all the species in the data file.
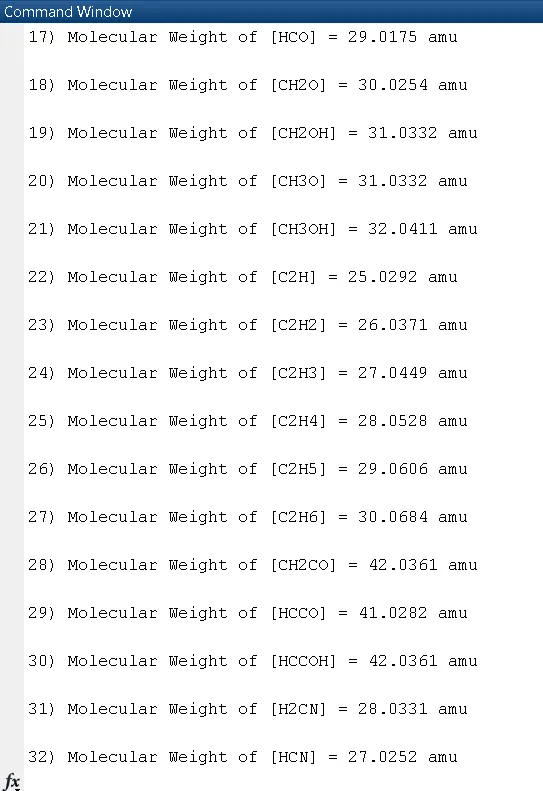
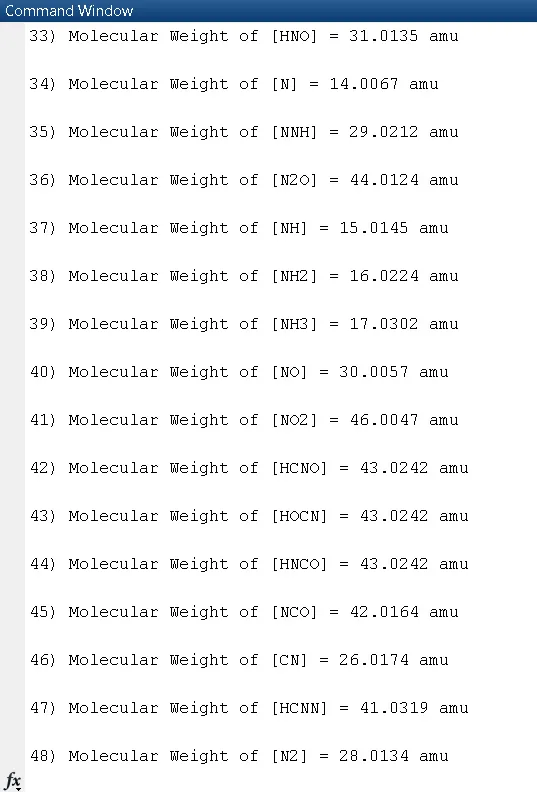
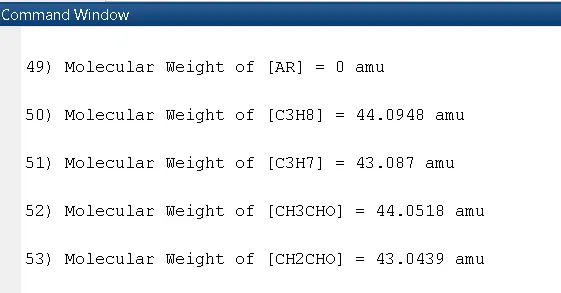
- Calculate the molecular weight of each species and display it in the command window.
- Plot the Cp, Enthalpy and Entropy for the local temperature range (low temperature : high temperature) specific for each species.
- Save the plots as images with appropriate names and dump them in separate folders for each species with suitable name. All these should be generated automatically.
THEORY ABOUT FILE PARSING
The File Parser process enables you to convert data from an external file into PeopleSoft data and place it into tables in your Campus Solutions database. The external file can be a delimited file or a flat file. It can be a simple file with one row type or a complex file with several row types. If your institution routinely receives an external file from which you need to move data into your database, consider using the File Parser process to expedite the entry of that data. Whether the file is a small one that your institution receives daily or a large one that is received annually, the one-time setup of the File Parser process for that file can save significant data entry time.
Parsing in computer languages refers to syntactic analysis of the input code into its components parts in order to facilitate the writing of compilers and interpreters. It can be used to describe split or separation. Parsing a file means reading in a data stream of some sort and building an in memory model of the semantic content of that data. This aims at facilitating performing some kind of transformation on the data.
A parser is a software component that takes input data (frequently text) and builds a data structure – often some kind of parse tree, abstract syntax tree or other hierarchical structure, giving a structural representation of the input while checking for correct syntax. The parsing may be preceded or followed by other steps, or these may be combined into a single step. The parser is often preceded by a separate lexical analyzer, which creates tokens from the sequence of input characters; alternatively, these can be combined in scanner less parsing. Parsers may be programmed by hand or may be automatically or semi-automatically generated by a parser generator. Parsing is complementary to templating, which produces formatted output. These may be applied to different domains, but often appear together, such as the scanf/printf pair, or the input (front end parsing) and output (back end code generation) stages of a compiler.
The input to a parser is often text in some computer language, but may also be text in a natural language or less structured textual data, in which case generally only certain parts of the text are extracted, rather than a parse tree being constructed. Parsers range from very simple functions such as scanf, to complex programs such as the frontend of a C++ compiler or the HTML parser of a web browser. An important class of simple parsing is done using regular expressions, in which a group of regular expressions defines a regular language and a regular expression engine automatically generating a parser for that language, allowing pattern matching and extraction of text. In other contexts regular expressions are instead used prior to parsing, as the lexing step whose output is then used by the parser.
The use of parsers varies by input. In the case of data languages, a parser is often found as the file reading facility of a program, such as reading in HTML or XML text; these examples are markup languages. In the case of programming languages, a parser is a component of a compiler or interpreter, which parses the source code of a computer programming language to create some form of internal representation; the parser is a key step in the compiler frontend. Programming languages tend to be specified in terms of a deterministic context-free grammar because fast and efficient parsers can be written for them. For compilers, the parsing itself can be done in one pass or multiple passes – see one-pass compiler and multi-pass compiler.
The implied disadvantages of a one-pass compiler can largely be overcome by adding fix-ups, where provision is made for code relocation during the forward pass, and the fix-ups are applied backwards when the current program segment has been recognized as having been completed. An example where such a fix-up mechanism would be useful would be a forward GOTO statement, where the target of the GOTO is unknown until the program segment is completed. In this case, the application of the fix-up would be delayed until the target of the GOTO was recognized. Conversely, a backward GOTO does not require a fix-up, as the location will already be known.
Context-free grammars are limited in the extent to which they can express all of the requirements of a language. Informally, the reason is that the memory of such a language is limited. The grammar cannot remember the presence of a construct over an arbitrarily long input; this is necessary for a language in which, for example, a name must be declared before it may be referenced. More powerful grammars that can express this constraint, however, cannot be parsed efficiently. Thus, it is a common strategy to create a relaxed parser for a context-free grammar which accepts a superset of the desired language constructs (that is, it accepts some invalid constructs); later, the unwanted constructs can be filtered out at the semantic analysis (contextual analysis) step.
SIMPLE PROCEDURE AND PLAN FOR PROGRAM
- Initially we open the THERMO file and then extract the values of different lines.
- Then we extract the values of coefficients of different species.
- After that we make the directory.
- Then we write the code for function to find Specific heat, enthalpy and entropy of different species and call this function in our main program.
- Then we plot the curve for different species and save them in 'jpg' format.
- At last we find the molecular weight of all the species and display it in command window.
SUPPLYMENTARY PROGRAM -1(FUNCTION PROPERTY)
FUNCTION PROGRAM FOR CALCULATING Cp, H AND S with code explanation
% Function of calculating Specific heat, Enthalpy and Entropy
% for local Temperature Range of each species.

function [Cp, H, S] = Function_property(a1,a2,a3,a4,a5,a6,a7,a8,a9,a10,a11,a12,a13,a14,T,L_Mid_T)
 %Cp = Specific Heat of species
 %H = Enthalpy of species
 %S = Entropy of species
 %a = co-efficients of species
 %a1:a7 = co-efficients of species for high temperature
 %a8:a14 = co-efficients of species for low temperature
 %L_Mid_T = Local Mid Temperature
 R = 8.314; % R = Universal Gas Constant
 for q = 1: length(T)
     if T(q)>= L_Mid_T

 % Formula of Specific Heat for high temperature
 Cp = (a1+ (a2.*T) + (a3.*T.^2) + (a4.*T.^3) + (a5.*T.^4)) *R;
 % Formula of Enthalpy for high temperature
 H = (a1+ (a2.*(T./2)) + (a3.*((T.^2)./3)) + (a4.*((T.^3)./4)) + (a5.*((T.^4)./5)) + (a6./T)).*(T.*R);
 % Formula of Entropy for high temperature
 S = ((a1.*log(T)) + (a2.*T) + (a3.*((T.^2)./2)) + (a4.*((T.^3)./3)) + (a5.*((T.^4)./4)) + a7) .*R;
     else
 % Formula of Specific Heat for low temperature
 Cp = (a8+ (a9.*T) + (a10.*T.^2) + (a11.*T.^3) + (a12.*T.^4)) *R;
 % Formula of Enthalpy for low temperature
 H = (a8+ (a9.*(T./2)) + (a10.*((T.^2)./3)) + (a11.*((T.^3)./4)) + (a12.*((T.^4)./5)) + (a13./T)).*(T.*R);
 % Formula of Entropy for low temperature
 S = ((a8.*log(T)) + (a9.*T) + (a10.*((T.^2)./2)) + (a11.*((T.^3)./3)) + (a12.*((T.^4)./4)) + a14) .*R;
     end
 end
end
EXPLANATION FOR FUNCTION PROGRAM-1
- Function command is determined for Cp, H and S with inputs of low & high temperature coefficient Universal gas constant (R) , Temperature (T) and local mid temperature.
- It takes 3 output arguments as Cp, H and S and 17 input arguments as all 14 coefficients, universal gas constant (R in J/mol), local temperature values from the linspace command in the main program and local middle temperature value (1000 K).
- if and else condition is used to divide the 14 temperature coefficients.
- Then if else command is used to check the condition weather Higher temp is less than or equal to (<=) local mid temp
- Cp is then calculated by writing the formula as code for both low and high temperature coefficients.
SUPPLYMENTARY PROGRAM-2(MOLECULAR WEIGHT)
FUNCTION PROGRAM FOR CALCULATE SPECIES MOLECULAR WEIGHT with code explanation
% Function program for calculate the molecular Weight for every using every Individual atomic mass of element.
function  MW = Molecular_weight(species) % function for finding MW for species

% Assigning needed chemical elements in string array
element = {'H', 'C', 'O', 'N', 'Ar','S'};

% Assigning the element mass in Atomic mass array
atomic_mass = [1.00784 12.0107 15.999 14.0067 39.948 22.989769];

MW=0;
% for loop code to calculate every species Molecular weight
for x = 1:length(species);% To separate the species atoms and To know number of atoms and set of atom in species
   for y = 1:length(atomic_mass);% To separate the atomic mass of atom(elements) for selection

    if strcmp(species(x),element(y)); % comparing the string of particular species and element.
        MW = MW + atomic_mass(y);% calculating molecular of selected atom(element)
        placed = y;% Placed is placing of atom at species, y is selected atom.
    end
end

num = str2double(species(x)); % covert the selected character from string to number.
if num>1 % selected character is greater than 1,
    set_of_atom = num-1; % selected number is set of atom. reduce one set because of we already add in previous loop.
    MW = MW + atomic_mass(placed)*(set_of_atom);% calculating MW of species with all set of atom.
end
end
MW = num2str(MW); % convert the Molecular weight as number to string.
end % end the program
EXPLANATION OF PROGRAM - 2
- The above program is the coded molecular weight along with the comments, which calculates the molecular weight of each species.
- It takes 1 output argument as molecular weight and 1 input argument as species name.
- Elements like H, C, N, O, N, AR and S are stored in an array named elements.
- The atomic mass of these elements are stored in an array named atomic mass.
- The molecular weight of these elements will be equal to their atomic mass as they consist of a single atom.
- The molecular weights of other species like O2, N2, CO2, CH3CHO etc. are calculated using the formulae given in the if and else if conditions with their respective names.
- Lastly, the molecular weight of each species is displayed using fprintf code.
MAIN PROGRAM OF PARSING NASA THERMODYNAMATIC DATA with code explanation
% Program for Parsing NASA thermodynamic data

% Basic command for program
clear all% clearing the workspace
close all% closing the plots
clc% clearing the command window

% Read data file
file = fopen('THERMO.dat','r'); % code for open the file and read mode.
header = fgetl(file); % read the header of the file
% Read the Global Temperature
global_temp = fgetl(file); % read the line to get global temperature range
A = strsplit(global_temp,' '); %Split the global temperature line
global_low_temp = str2double(A{2});% Split the global low temp from global temp line and convert the temp value from string to number
global_mid_temp = str2double(A{3});% Split the global mid temp from global temp line and convert the temp value from string to number
global_high_temp = str2double(A{4});% Split the global high temp from global temp line and convert the temp value from string to number

% Getting the command line from thermo data and skip the next same three line
% Basically a line starts with exclamatory(!) is command, commands are generally skipped.
command1 = fgetl(file); % reading the command line
command2 = fgetl(file);
command3 = fgetl(file);

for i = 1:53; % loop code for all 53 species to determine Cp,H,S
    % start the loop code for first species of thermo data
    line_1 = fgetl(file); % Read the first line of the species information
    L1 = strsplit(line_1,' '); % Spilt the first line information using the space
    species = (L1{1}); % finding species at the data line
    G = strfind(line_1,'G '); % find the particular string WITH space at line_1 to use as start point
    % find the local temperature values of species use line_1 data
    L_Low_T = str2double(line_1(G+3:G+10)); % Find the Local Low Temperature and Split and convert string to number from line_1
    L_High_T = str2double(line_1(G+12:G+20)); % Find the Local High Temperature
    L_Mid_T = str2double(line_1(G+22:G+30)); % Find the Local Mid Temperature
    T = linspace(L_Low_T,L_High_T,500); % Create the Range of Local Temperature

    % Read the second line of the first species thermo data
    line_2 = fgetl(file);
    L2 = strfind(line_2,'E'); % fine the particular string character of line_2.
    % Read the co-efficients and convert from string to number for High Temperature of species
    a1 = str2double(line_2(1:L2(1)+3));% Shown the 1st co-efficient for High Temperature.
    a2 = str2double(line_2(L2(1)+4:L2(2)+3));% Shown the 2nd co-efficient for High Temperature.
    a3 = str2double(line_2(L2(2)+4:L2(3)+3));% Shown the 3rd co-efficient for High Temperature.
    a4 = str2double(line_2(L2(3)+4:L2(4)+3));% Shown the 4th co-efficient for High Temperature.
    a5 = str2double(line_2(L2(4)+4:L2(5)+3));% Shown the 5th co-efficient for High Temperature.
    % Read the third line of the first species thermo data
    line_3 = fgetl(file);
    L3 = strfind(line_3,'E');% fine the particular string character of line_3
    a6 = str2double(line_3(1:L3(1)+3));% Shown the 6th co-efficient for High Temperature.
    a7 = str2double(line_3(L3(1)+4:L3(2)+3));% Shown the 7th co-efficient for High Temperature.
    % Read the co-efficients and convert from string to number for Low Temperature of species
    a8 = str2double(line_3(L3(2)+4:L3(3)+3));% Shown the 8th co-efficient for Low Temperature.
    a9 = str2double(line_3(L3(3)+4:L3(4)+3));% Shown the 9th co-efficient for Low Temperature.
    a10= str2double(line_3(L3(4)+4:L3(5)+3));% Shown the 10th co-efficient for Low Temperature.
    % Read the Fourth line of the first species thermo data
    line_4 = fgetl(file);
    L4 = strfind(line_4,'E');% fine the particular string character of line_4
    a11= str2double(line_4(1:L4(1)+3));% Shown the 11th co-efficient for Low Temperature.
    a12= str2double(line_4(L4(1)+4:L4(2)+3));% Shown the 12th co-efficient for Low Temperature.
    a13= str2double(line_4(L4(2)+4:L4(3)+3));% Shown the 13th co-efficient for Low Temperature.
    a14= str2double(line_4(L4(3)+4:L4(4)+3));% Shown the 14th co-efficient for Low Temperature.

    % Calling the function to calculate the Cp,H and S.
   [Cp, H, S] = Function_property(a1,a2,a3,a4,a5,a6,a7,a8,a9,a10,a11,a12,a13,a14,T,L_Mid_T);

    % Create separate folders for all species to store plots and information's of individual species data at specific folder
    Folder_name = sprintf('%d)  %s',i ,species);% Create title for individual folder
    current_dir  = pwd;% specify the current directory or checking the path where we are.
    mkdir(Folder_name);% Make new folder at current directory with folder name, and also check the folder is already exist or not.
    cd(Folder_name); %Change current folder(Change Directory) to new folder for load the date and plots inside the Maken folder

    %Making plot for Specific heat(Cp) v/s Local Temperature(T) for every individual species
    figure(1); % first figure for first plot
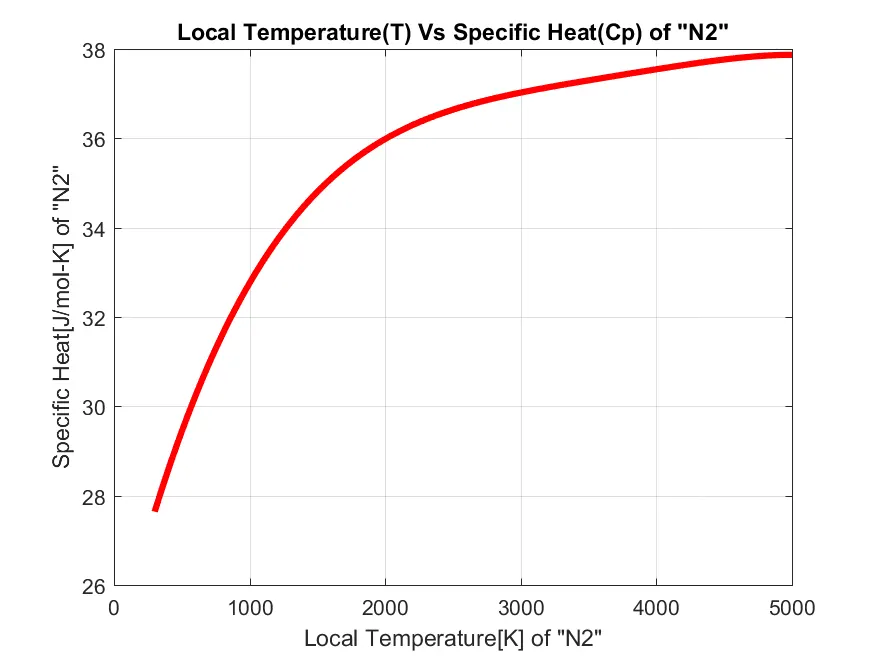
    plot(T,Cp,'linewidth',3,'color','r');% plot for Local Temperature Range v/s Specific heat.
    grid on % show the grid line on the Plot
    xlabel(sprintf('Local Temperature[K] of "%s"',species));% Name for X-axis
    ylabel(sprintf('Specific Heat[J/mol-K] of "%s"',species)); % Name for Y- axis
    title(sprintf('Local Temperature(T) Vs Specific Heat(Cp) of "%s"',species)); % Name for this plot

    %Making plot for Enthalpy(H) v/s Local Temperature(T) for every individual species
    figure(2); % Second figure for second plot
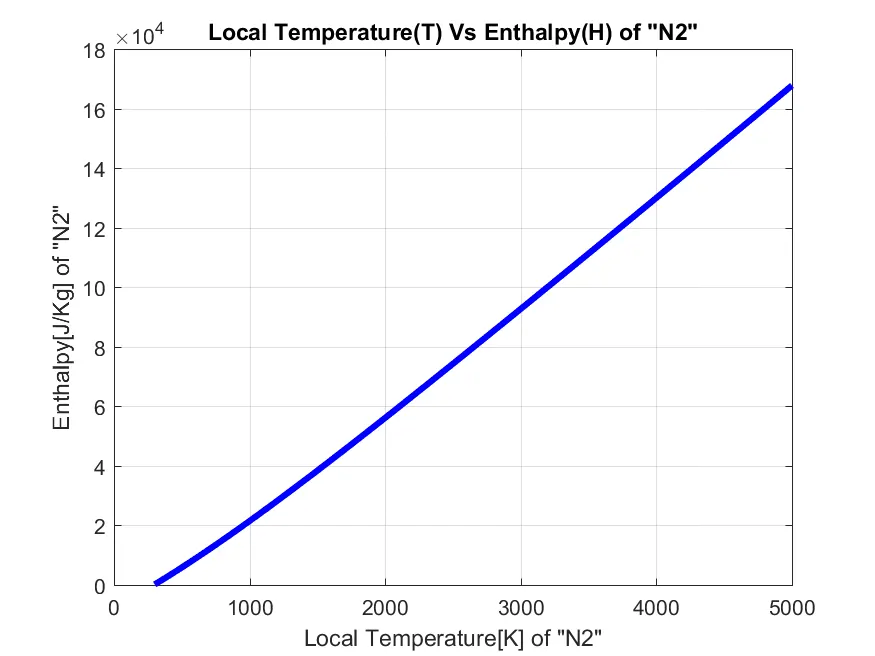
    plot(T,H,'linewidth',3,'color','b');% plot for Local Temperature Range v/s Enthalpy.
    grid on % show the grid line on the Plot
    xlabel(sprintf('Local Temperature[K] of "%s"',species));% Name for X-axis
    ylabel(sprintf('Enthalpy[J/Kg] of "%s"',species)); % Name for Y- axis
    title(sprintf('Local Temperature(T) Vs Enthalpy(H) of "%s"',species)); % Name for this plot

     %Making plot for Entropy(S) v/s Local Temperature(T) for every individual species
    figure(3); % Third figure for third plot
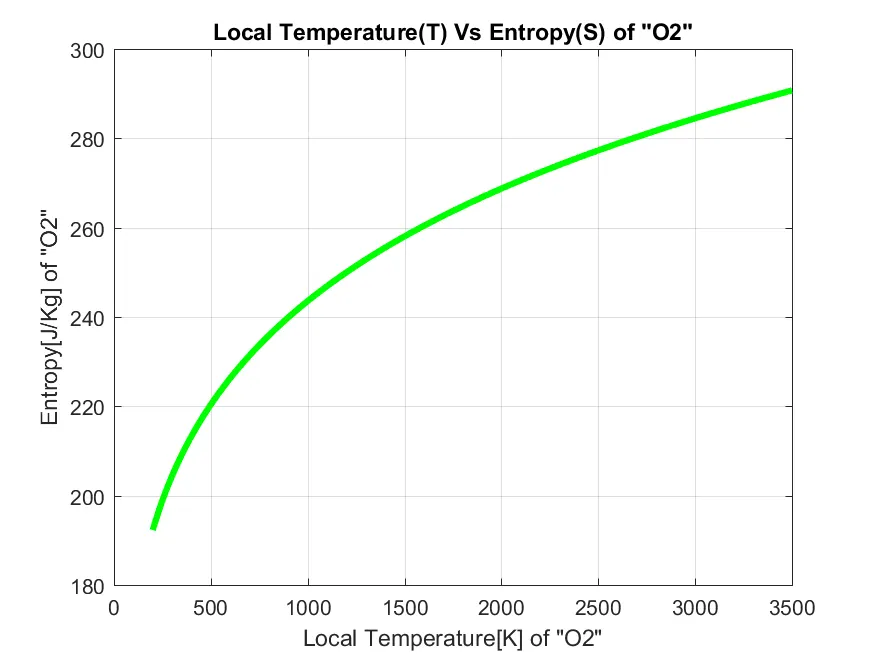
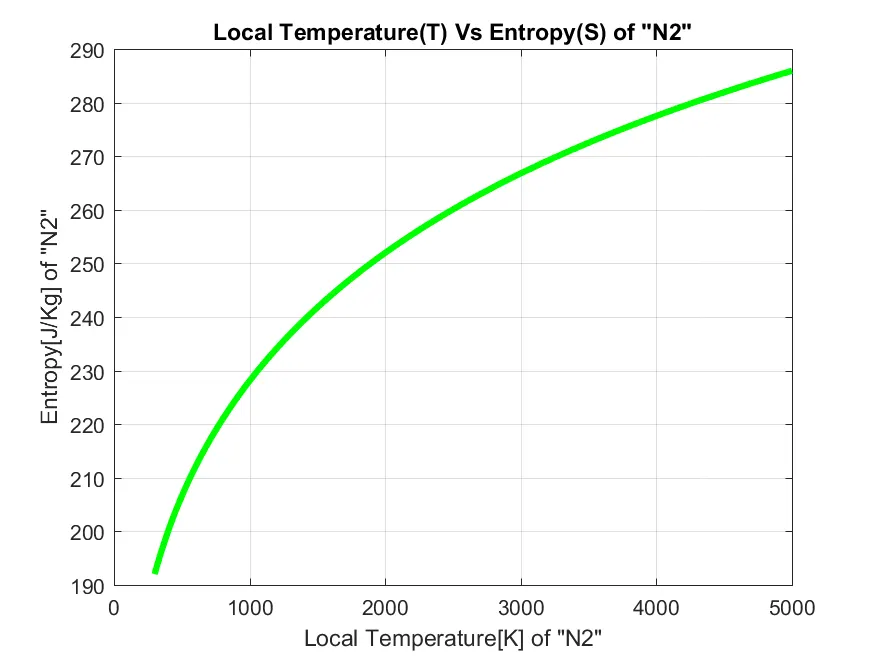
    plot(T,S,'linewidth',3,'color','g');% plot for Local Temperature Range v/s Entropy.
    grid on % show the grid line on the Plot
    xlabel(sprintf('Local Temperature[K] of "%s"',species));% Name for X-axis
    ylabel(sprintf('Entropy[J/Kg] of "%s"',species)); % Name for Y- axis
    title(sprintf('Local Temperature(T) Vs Entropy(S) of "%s"',species)); % Name for this plot

    % Saving Plots of every species at separate species folders
    saveas(figure(1),sprintf('Plot for T Vs Cp of ''%s''.png',species));% save the plot figure1 at species folder with file name
    saveas(figure(2),sprintf('Plot for T Vs H of ''%s''.png',species));% save the plot figure2 at species folder with file name
    saveas(figure(3),sprintf('Plot for T Vs S of ''%s''.png',species));% save the plot figure3 at species folder with file name
    cd(current_dir)% show the way to saving the plots at create folder

    % Calling function of calculating Molecular Weight
     MW = Molecular_weight(species);

    % Print and display the molecular weight with species name
    fprintf('%d) Molecular Weight of [%s] = %s amu n',i,species,MW)% print the molecular weight at command window,
    fprintf('n')%n is set net after print for next species, next n is one line interval gap for one species to another species.

end
COMMAND EXPLANATION
- fopen('file-name','mode') --- To open any file and to select a mode of operation for the file. Modes are read(r), write(w).
- fgetl(file-name) ---To Read characters from a file, stopping after a newline.
- strsplit(str,delimiter) --- splits str at the delimiters specified by delimiter.
- str2num(s) --- To convert a string (character) to number.
- str2double(str) --- converts the text in str to double precision values.
- pwd --- Return the current working directory.
- mkdir(folder-name) --- To create a folder(directory).
- cd(folder-name) --- To specify that files(plots, .png, etc) should be stored in the specified folder.
- saveas(figure,file-name) --- To save a figure(gca can be used) as file.
- strcmp(s1,s2) --- To determine if two strings(s1,s2) are identical. It compares complete strings.
- fprintf(' title %s %d ',string,number) --- fprintf means "File PRINT Formatted": use this for printing text to a file on the command window.
- sprintf(' title %s %d ',string,number) --- sprintf means "String PRINT Formatted": use this for creating a MATLAB string ( character vector ).
- num2str(s) --- To convert a number t string (character)
EXPLANATION OF MAIN CODE
- The program is started with commands clear all , close all, and clc to establish a fresh start without the manipulation of previous values.
- First we open the THERMO.dat file using the fopen command and then get the values of different lines by using fgetl command.
- After that we split the string values by using strsplit command and the convert that string to number by using str2double command and get the values of global temperature.
- Then started the for loop function for repeat calculation to get the result
- After that by using the same procedure of strspilt and str2double we obtain the species name
- And their local temperature readied by using findstr command.
- finding the position of "G" in the NASA Thermodynamic file, as the position of "G" can be used to extract the values of Local Temperatures from the file. During this operation, it gives the wrong result for the species [CH2OH], as there are two G's in this line. So, to be specific, we use "G " instead of "G", now we find the position of "G(space)" to eliminate this confusion.
- Also using the same procedure we obtain the species co-efficient.
- Then we extract the values of coefficient of the different species.
- Now we calling the first supplementary program to calculate array of Cp, H and S.
- Then we use mkdir command to make the new directory to save the plots .
- Then we write code for plot the curve for different species Cp, H and S and save the plot as png format in their respective folder.
- Now we calling the second supplementary function to calculate Molecular Weight of every species.
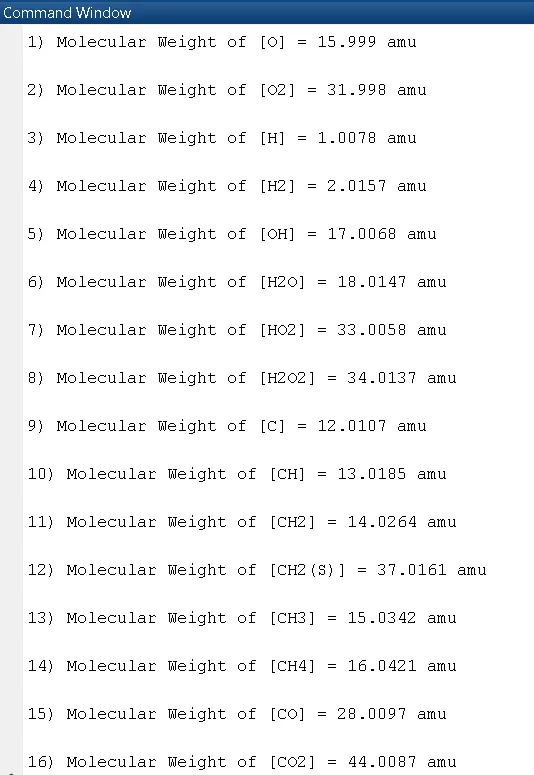
- At last we find the value of molecular weight of different species and print them in the command window.
OUTPUT SCREENSHOT FOR PARSING PROGRAM
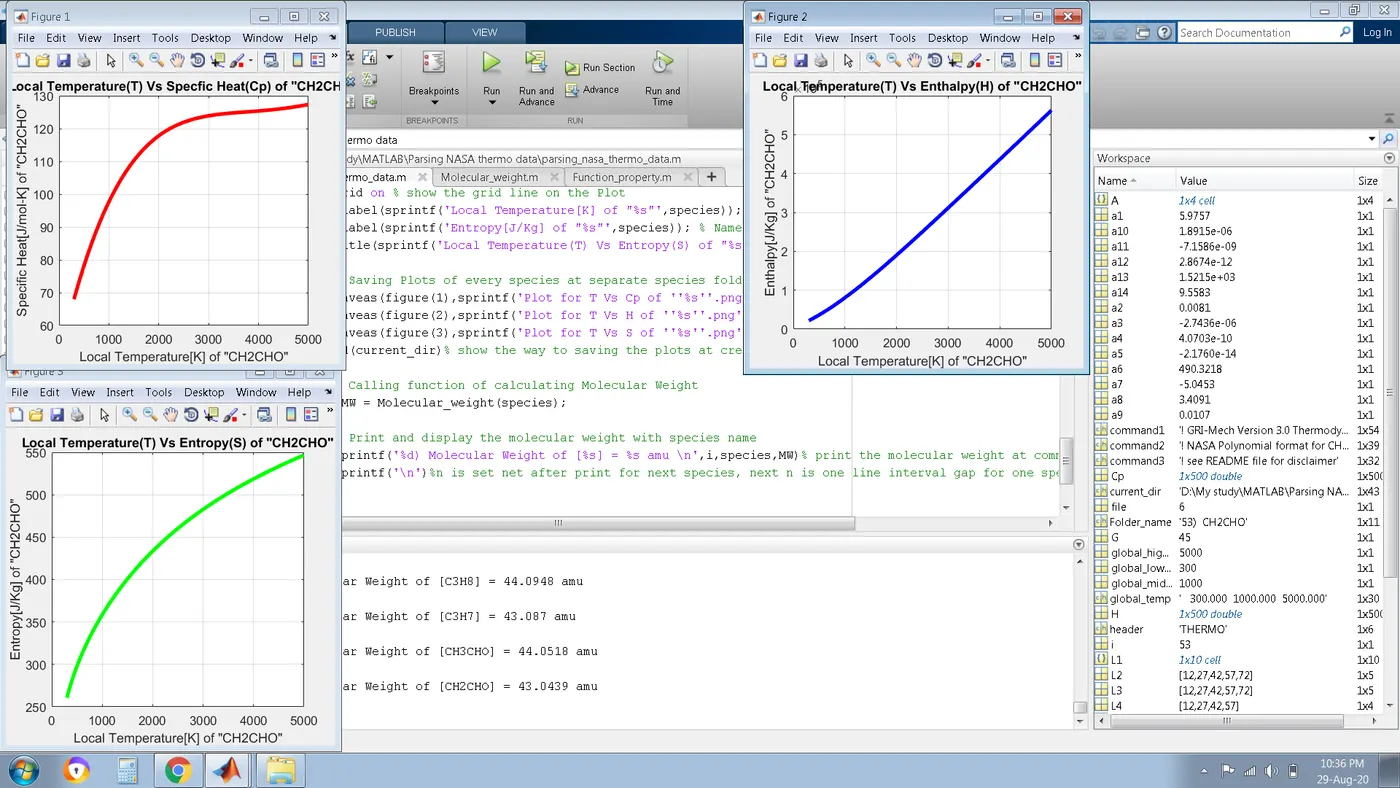
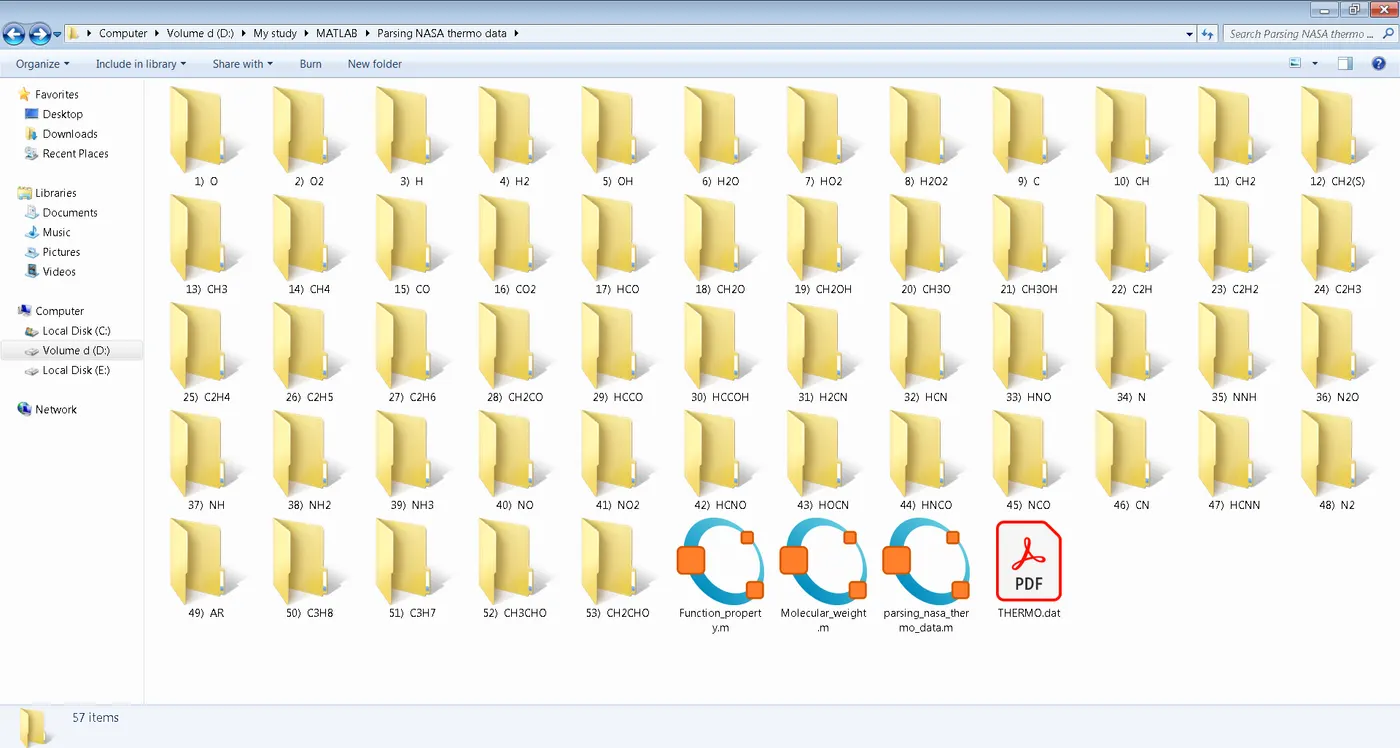
SCREENSHOT OF FOLDERS OF EVERY SPECIES
ERROR
At the program ends we run the program. No error occurred in command window, but I had seen two of CH2OH and HCN species plots not shown the curve. then we found there is two 'G' at the data line. o, to be specific, we use "G " instead of "G", now we find the position of "G(space)" to eliminate this confusion.
OUTPUTS PLOTS OF Cp, H AND S
SELECTED SPECIES FOR SHOWN IN REPORT --- O2, N2, CO2...
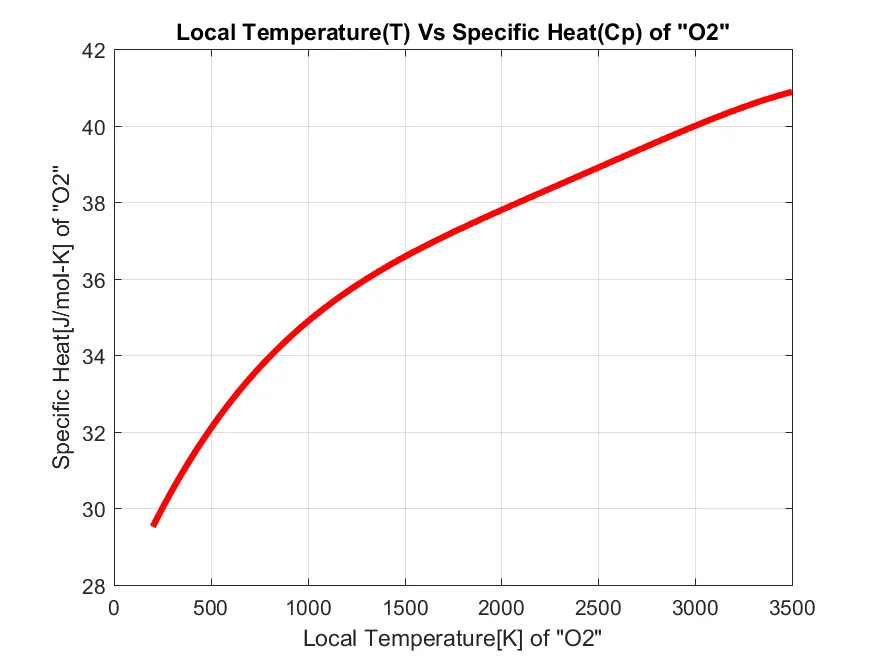
PLOT FOR TEMPERATURE(T) VS SPECIFIC HEAT(Cp) OF O2
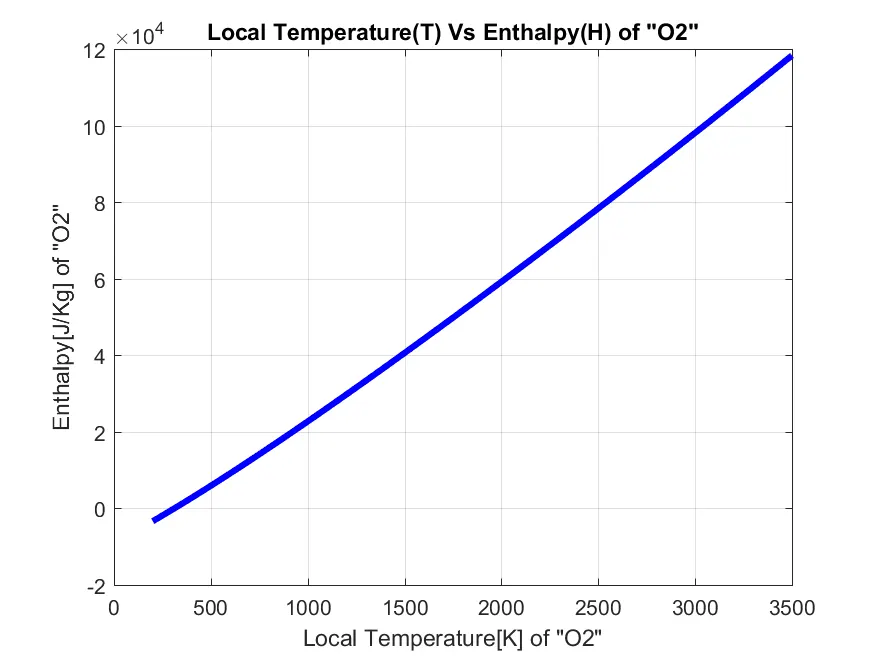
PLOT FOR TEMPERATURE(T) VS ENTHALPY(H) OF O2
PLOT FOR TEMPERATURE(T) VS ENTROPY(S) OF O2
PLOT FOR TEMPERATURE(T) VS SPECIFIC HEAT(Cp) OF N2
PLOT FOR TEMPERATURE(T) VS ENTHALPY(H) OF N2
PLOT FOR TEMPERATURE(T) VS ENTROPY(S) OF N2
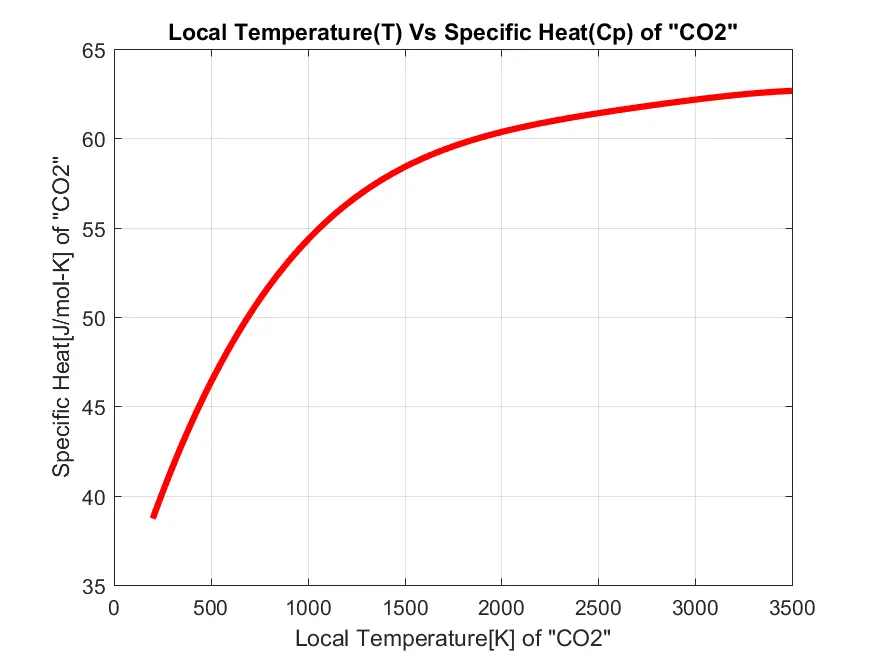
PLOT FOR TEMPERATURE(T) VS SPECIFIC HEAT(Cp) OF CO2
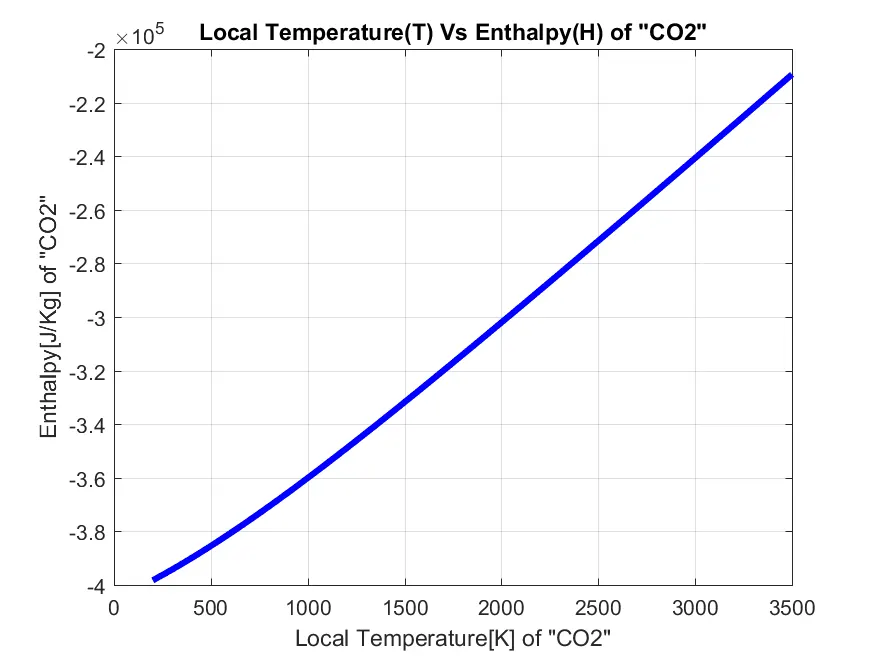
PLOT FOR TEMPERATURE(T) VS ENTHALPY(H) OF CO2
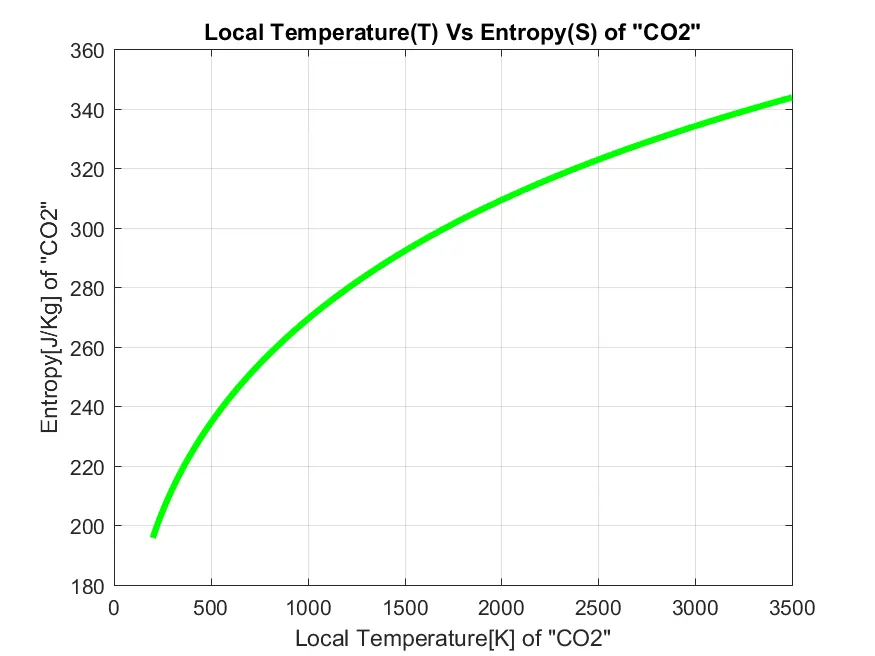
PLOT FOR TEMPERATURE(T) VS ENTROPY(S) OF CO2
OUTPUT OF SPECIES MOLECULAR WEIGHT
REFERENCES
- https://www.mathworks.com/matlabcentral/answers/16009-difference-between-sprintf-and-fprintf#:~:text=sprintf()%20returns%20the%20formatted,port)%20it%20is%20connected%20to.
- https://skill-lync.com/challenges/question/Um1wL1ZTVUhVWklqbnNuNzZhSjNZZz09Ojp5cmU1bDZWWXZxSnRWNWNI/dlpuVGlxNjlhZVd3MGlXTW1mVWI0UT09OjpBaGlkcDZoNnlnaTRGU3V6/SUtDT1BVRHdCZjYwL0pacUI2eExIQT09OjpLVUx4WFFUdlp6Z2tIS1Nh
- MATLAB Answers - https://www.mathworks.com/matlabcentral/answers/74938-mkdir-with-variable-name
- NASA Thermodynamic data - https://ntrs.nasa.gov/archive/nasa/casi.ntrs.nasa.gov/19940013151.pdf
- https://in.mathworks.com/help/matlab/referencelist.html?type=function
CONCULUTION
Thus the file parsing of the NASA Thermodynamic Data was done. Also the plot of Temperature v/s Specific Heat, Enthalpy and Entropy was obtained and the plots were also saved in different folders with their respective names. Also we have calculated the molecular weight of different species and shown them in the command window. After observing these plots, we understand that the Specific heat of any species is not a constant value, it depends on temperature. Generally, we use constant values for our calculation, but we conclude that the Specific Heat, Enthalpy, Entropy are temperature-dependent variables. NASA has determined these polynomial values to calculate these properties of each species.