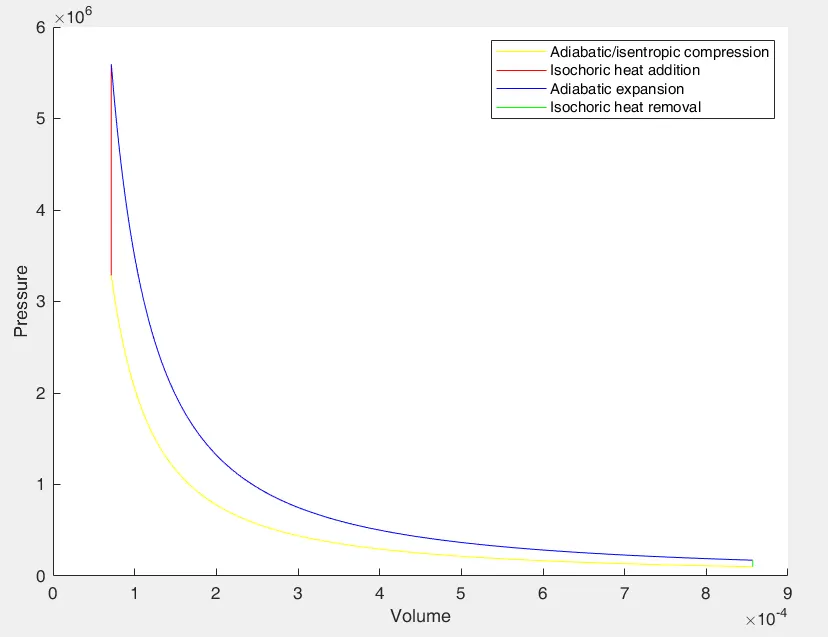
P-V diagram of an Otto Cycle
AIM: To Solve an Otto cycle and plot its P-V Diagram
Objective:
- To understand the working/theory of an IC engine and Otto cycle.
- Write a program to evaluate the Pressure and volume of an Otto cycle at different points and plot a P-V diagram for the same.
- To calculate the thermal efficiency of an IC engine.
Theory:
- IC Engine - An internal combustion engine is classified as a heat engine and is called internal because the combustion of the air-fuel mixture occurs inside the engine, in a combustion chamber. Most commonly a 4-stroke (Because it takes 4 strokes for piston to complete 1 combustion cycle) engines are used based upon Otto or Diesel Cycle.
- Otto Cycle - It is the most common / ideal thermodynamic cycle that describes the functioning of a typical spark ignition petrol engine. There are different stages in a 4-stroke IC engine which are based upon 4 different stages / processes of Otto cycle.
- Adiabatic compression (Compession stroke) 1 → 2
- Isochoric heat addition (Ignition) 2 → 3
- Adiabatic expansion (Power stroke) 3 → 4
- Isochoric heat removal 4 → 1.
- Thermal Efficiency - The conversion of fuel energy into usefull work energy through an IC engine Involves a number of losses. The major engine losses are thermal, frictional, pumping, mechanical, chemical etc
In otto cycle (generally known as spark ignition / petrol engines) the theoritical efficiency depends upon the compression ratio and specific heat ratio of gas in combustion chamber. It can be given by the below formula
ηth= (1 - 1crγ−1">1/cr(γ− 1)) * 100
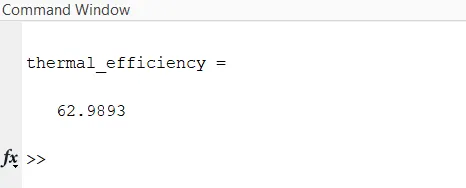
The ideal theoritical otto cycle effciency ranges around 56 - 62% but practically most of the comercial engines operated around 25 -30% efficiency with an exeption in motorsports category because the push the limits to their extents and even utilize the wasted energies to get more than 50% thermal efficiency
To calculate the pressure and volume during a combustion process a simple MATLAB code can be written to do the mathematical operations and help us plot a P-V diagram.
But since the P-V digram can not be just drawn from the state points as the volume is ever changing during a cycle and is function of engine variables, therefore an additional code was added to define the volume of the chamber at each and every stage and lated used as template (function) in the main code.
Main Code:
clear all
close all
clc

%engine geometric parameters
bore = 0.1;
stroke = 0.1;
con_rod = 0.15;
cr = 12;

% Input
gamma = 1.4;

% State variables
p1 = 101325; %pascals
t1 = 500; %kelvin
t3 = 2300; %kelvin

% Calculating sept and clearance volume
v_swept = (pi/4)* bore^2 * stroke;
v_clearance = v_swept/(cr - 1);

v1 = v_swept + v_clearance;
v2 = v_clearance;

% State variable at point 2

%p2v2^gamma = p1v1^gamma
%p2 = p1 * (v1/v2)^gamma  = p1 * cr^gamma
p2 = p1 * cr^gamma;

%p1v1/t1 = p2v2/t2
t2 = p2*v2*t1/(p1*v1);

constant_c = p1*v1^gamma;
V_compression = Engine_kinematics(bore,stroke,con_rod,cr,180,360);
P_compression = constant_c./V_compression.^gamma;

% State variable at point 3
v3 = v2;

%p3v3/t3 = p2v2/t2 | p3 = p2t3/t2 (ideal gas law)
p3 = p2*t3/t2;

constant_C = p3*v3^gamma;
V_expansion = Engine_kinematics(bore,stroke,con_rod,cr,360,540);
P_expansion = constant_C./V_expansion.^gamma;


% State variable at point 4
v4 = v1;

%p3v3^gamma = p4v4^gamma
%p4 = p3(v3/v4)^gamma
p4 = p3*(v3/v4)^gamma;

%thermal efficiency
thermal_efficiency = (1 - (1/cr^(gamma - 1)))*100

hold on
plot(V_compression,P_compression,'color','y')
plot([v2,v3],[p2,p3],'color','r')
plot(V_expansion,P_expansion,'color','b')
plot([v4,v1],[p4,p1],'color','g')
xlabel('Volume')
ylabel('Pressure')
legend('Adiabatic/isentropic compression','Isochoric heat addition','Adiabatic expansion','Isochoric heat removal')
Engine kinematics:
function [V] = Engine_kinematics(bore,stroke,con_rod,cr,stark_crank,end_crank)

%crank pin radius
a = stroke/2;
R = con_rod/a;

% Calculating sept and clearance volume
v_s = (pi/4)* bore^2 * stroke;
v_c = v_s/(cr - 1);

theta = linspace(stark_crank,end_crank,720);

term1 = 0.5*(cr-1);
term2 = R + 1 - cosd(theta);
term3 = (R^2 - sind(theta).^2).^0.5;

V = (1 + term1*(term2 - term3))* v_c;

end
Explaination:
- The code was written in the 'editor' window of the matlab so that it can be saved easily and shared with others.
- The clear/close all & clc commands are used to clear all the previously defined variables in the workspace so that it doesn't clash with current programs.
- To make the code easy to understand a lot of comments are added. (Anything written with '%' symbol is considered as a comment)
- Next some of the input parameters were defined to a set of variables which are required to define engine parameters geometrically.
- Next some initial state parameteres such as pressure and temperature were defined and also the combustion temperature (t3).
- Using the variables the swept and compression volume was calculated. Also, the state variables were calculated at other stages using the ideal gas law (PV = nRT) for different conditions (for all 2nd 3rd and 4th position in P-V diagram)
- Semicolon was added to all the input variables as well as output values to supress their values in the command window and not make the output confusing as plot/animation is what we require
- The 2nd code was used as a fucntion in the main code to define the constantly varying volume of the chamber.
- For this the value of theta was used as an array defining a set of piston position for one complete cycle (0 -720 deg.). 'linspace' command was used to define the array of theta.
- Finally, a function [V] was used to call the function in the main code.
- Finally the plot (x-axis, y-axis) command is used to plot multiple coordinates of pressure and volume at different states.
- The linewidth command is used to define the thicknesss of the line of plot.
- The hold on' commands allows us to plot all the coordinates in a single figure window one by one
- 'xlabel', 'ylabel' and 'legend' command was used to make the plot a little bit intearctive.
Errors:
- Minors errors were faced during coding of the programs.
- One of the error was that i defined some variable with capital letters and was using the with small letters, so indefined varable error was popping.
- Another error recievied was that I forgot to element wise operator and even once '*' while multiplying.
- once or twice i forgot to add '%' before a comment.
- While plottin i forgot to add the 'hold on' command and therefore i got all four points in different figure window.
- Instead of using plot(x,y) i used plot (y,x) syntax and was getting a rotated plot.
Results:
- The P-V diagram was generated and is attached below for reference. Also theoritical thermal efficiency for otto cycle was calculated.