P-V Diagram and Thermal Efficiency Calculation of Otto Cycle (Air Standard Cycle) using Python
Objective:
Write a program in Python to calculate the thermal efficiency of Otto cycle and plot the P-V diagram.
Otto Cycle:
Otto Cycle is the ideal thermodynamic combustion cycle which describes the working of a spark ignition engine, as follows: a compression at constant entropy; a constant-volume heat transfer to the system; an expansion at constant entropy; and a constant-volume heat transfer from the system. The thermal efficiency of the ideal Otto cycle increases with an increase in compression ratio. An actual version of this cycle is used in the most common type of engines used in automobiles.
The Otto cycle is the study of what happens to a mass of gas when it is subjected to changes in pressure, temperature, volume, adding heat and removing heat. The system is the term given to the mass of gas that is subjected to these changes. Otto Cycle also studies the effect of this system on the environment. The effect in question here is the net output or the work generated by the Otto Cycle to move the automobile in which the engine is installed.
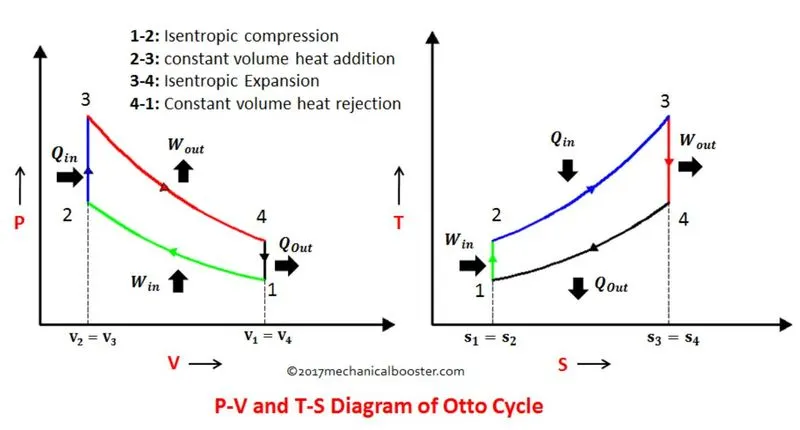
The isentropic process implies that during compression cycle there will be no loss of mechanical energy and considers that no heat will either enter the system or leave it.
In theory, heat flows through the left pressurizing process and some of it passes back through the right depressurizing process. The difference of heat here gives the net mechanical work generated.
Process:
The Otto cycle consists of isentropic compression, heat addition at constant volume, isentropic expansion, and rejection of heat at constant volume. In the case of a four-stroke Otto cycle, technically there are two additional processes: one for the exhaust of waste heat and combustion products at constant pressure (isobaric), and one for the intake of cool oxygen-rich air also at constant pressure; however, these are often omitted in a standard simplified analysis.
Thermal Efficiency:
Thermal Efficiency the ratio of the work output of a heat engine to the heat input expressed in the same units of energy. Thermal Efficiency of Otto Cycle(simplified) =  .
.
Governing Equations:
Total cylinder volume = `V_1 = V_4 = V_c + V_s`
where,
`V_c` → Clearance Volume
`V_s` → Stroke Volume
Clearance Volume: `V_c = V_2`
Stroke Volume: `V_s` = Total Cylinder Volume – Clearance Volume = `V_1 – V_2 = V_4 – V_3`
Compression ratio (r) is the ratio of total cylinder volume to the clearance volume = `V_1/V_2=V_4/V_3`
Process 1-2:
`T_2/T_1 = (V_1/V_2)^(gamma-1)=r^(gamma-1`
`T_2 = T_1*r^(gamma-1`
Process 3-4:
`T_3/T_4 = (V_4/V_3)^(gamma-1)=r^(gamma-1`
`T_3 = T_4*r^(gamma-1`
The relationship between crank angle and volume inside the chamber:
Python Code:
"""
Air Standard Cycle parameters calculation by Giridhar
"""

import math
import matplotlib.pyplot as plt

def Engine_Kinematics(bore, stroke, con_rod, cr, start_crank, end_crank):
	# Geometry parameters
	# Crank pin radius
	a = stroke/2
	R = con_rod/a

	# Volume computation
	# Swept volume
	V_s = (math.pi/4)*pow(bore,2)*stroke
	# Clearance volume
	V_c = V_s/(cr-1)

	sc = math.radians(start_crank)
	ec = math.radians(end_crank)

	n = 50

	dtheta = (ec-sc)/(n-1)

	V = []

	for i in range (0, n):
		theta = sc + i*dtheta
		# v/v_c = 1+1/2(cr-1)[R+1-cos(theta)-(R square- sin(theta) square) to the power of 1/2]
		term1 = 0.5*(cr-1)
		term2 = R + 1 - math.cos(theta)
		term3 = pow(R,2) - pow(math.sin(theta), 2)
		term3 = pow(term3,0.5)
		V.append((1 +term1*(term2-term3))*V_c)

	return V


# inputs
p1 = 101325
t1 = 500
gamma = 1.4
t3 = 2300

# geometry parameters
bore = 0.1
stroke = 0.1
con_rod = 0.15
cr = 8

# Thermal Efficiency = 1-(1/(cr to the power of (gamma - 1))
E1 = pow(cr,(gamma-1))
Efficiency = (1 - (1/E1))
print(Efficiency)


# volume computation
# swept volume
V_s = (math.pi/4)*pow(bore,2)*stroke
#clearance volume
V_c = V_s/(cr-1)
#state volume 1
v1 = V_c + V_s
#state volume 2
v2 = V_c
# p2v2*gamma = p1v1*gamma
p2 = p1*pow(v1,gamma)/pow(v2,gamma)
#p2v2/t2 = p1v1/t1 (ideal gas equation) | rhs = p1v1/t1 | p2v2/t2 = rhs | t2 = p2v2/rhs
rhs = p1*v1/t1
t2 = p2*v2/rhs
V_compression = Engine_Kinematics(bore, stroke, con_rod, cr, 180, 0)

constant = p1*pow(v1,gamma)
P_compression = []

for v in V_compression:
	P_compression.append(constant/pow(v,gamma))


# state point 3
v3 = v2
# p3v3/t3 = p2v2/t2 (ideal gas equation) | rhs = p2v2/t2 | p3v3/t3 = rhs | p3 = rhs*t3/v3
rhs = p2*v2/t2
p3 = rhs*t3/v3

V_expansion = Engine_Kinematics(bore, stroke, con_rod, cr, 0, 180)

constant = p3*pow(v3,gamma)
P_expansion = []

for v in V_expansion:
	P_expansion.append(constant/pow(v,gamma))


# state point 3
v4 = v1
# p4v4*gamma = p3v3*gamma
p4 = p3*pow(v3,gamma)/pow(v4,gamma)
# p4v4/t4 = rhs
t4 = p4*v4/rhs


plt.plot([v2,v3], [p2,p3])
plt.plot(V_compression,P_compression)
plt.plot(V_expansion,P_expansion)
plt.plot([v4,v1], [p4,p1])
plt.title('P-V Diagram of Otto Cycle')
plt.xlabel('Volume (m^3)')
plt.ylabel('Pressure (Pa)')
plt.savefig('P-V Diagram_otto cycle')
plt.show()
Output:
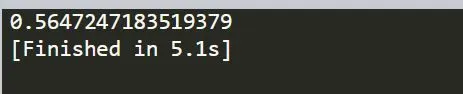
Thermal Efficiency of the engine is obtained in the output = 56.4%
P-V Diagram:
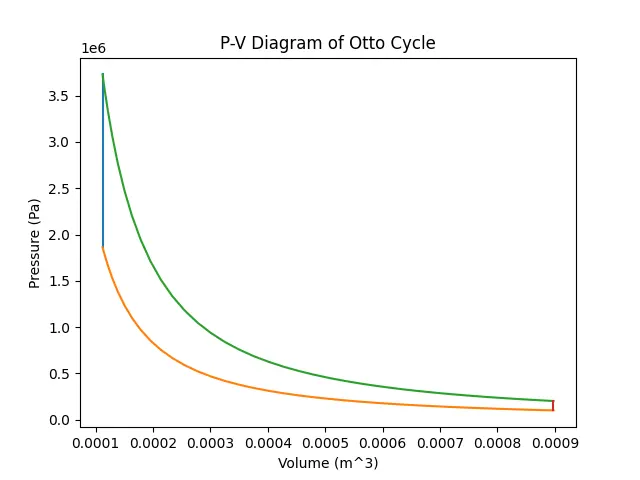
Code Explanation:
- Math module is imported as the code contains mathematical calculations.
- matplotlib.pyplot as plt is imported as we need plots from the calculations performed.
- A function is defined with undefined variables and will be defined outside of the function.
- Inputs are given:
crank pin radius (a = stroke/2)
constant (R = con_rod/a)
- Swept volume and clearance volume formulae are given.
- crank start angle and end angle are assigned.
- Number of values of input angle will be 50.
- Volume is defined using a empty array for output.
- A for loop is created and append is used for calculating volume for all values of angles and the volume's value is returned.
- Inputs are given:
p1= 101325 Pa
t1= 500 K
gamma=1.4
t3= 2300 K
Bore = 0.1m
Stroke length (stroke) = 0.1m
Connecting rod length (con_rod) = 0.15m
Compression ratio (cr) = 8
- Thermal Efficiency is defined.
- Unknown variables are calculated using function by defining crank angle.
- plt.plot is used to give inputs of pressure and volume values.
- x label and y label is defined using plt._label.
- plt.title is used to give title to the graph.
- The plot is saved using plt.savefigure and the same is shown using plt.show command.
Conclusion:
A program in Python is created and succesfully executed to calculate the thermal efficiency of Otto cycle and plotted the P-V diagram.
Reference:
1. https://www.grc.nasa.gov/www/k-12/airplane/ottoa.html
2. Wikipedia: https://en.wikipedia.org/
3. https://engineeringinsider.org/