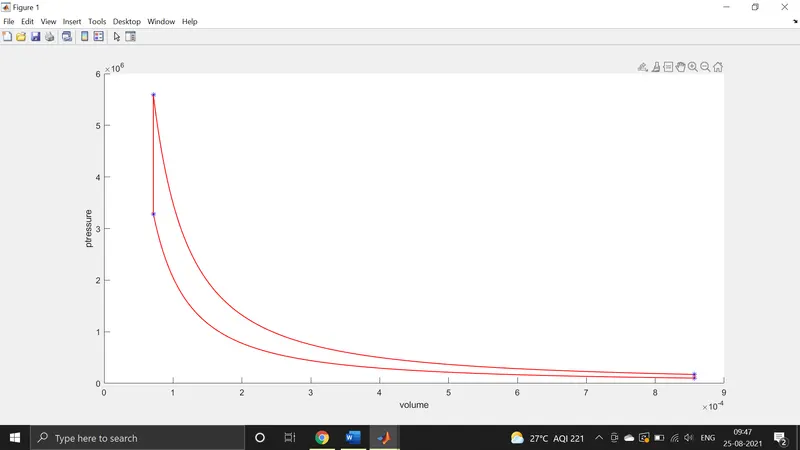
Otto Cycle with PV Diagram
% To solve otto cycle and plot the graph volume vs pressure

clear all
close all
clc

% Inputes parameter
 gamma = 1.4
 t3 = 2300
 p1 = 101325
 t1 = 500

 % Engine parameter
 bore = 0.1
 stroke =0.1
 con_rod =0.15
 cr = 12


 v_swept  = pi/4*bore^2*stroke
 v_clear = v_swept/(cr-1)

 % the state variable at state point 1
 v1 = v_swept + v_clear
 v2 = v_clear

 c_constant = p1*v1^gamma
 v_compression = engine_kinematics(bore,stroke,con_rod,cr,0,180)
 p_compression = c_constant./v_compression.^gamma

 % The state variable at state point2
 % p1v1^gamma = p2v2^gamma| p2 = p1 (v1/v2)^gamma

 p2 = p1*cr^gamma

 %p2v2/t2 = p1v1/t1 | t2 = p2v2t1/p1v1

 t2 = p2*v2*t1/(p1*v1)


 %state variable at state point 3
 v3 = v2

 %p2v2^gamma = p3v3^gamma

 p3 = p2*t3/t2

 %calculate the pressure at the expanstion
 c_constant = p3*v3^gamma
 v_expanstion = engine_kinematics(bore,stroke,con_rod,cr,0,180)
 p_expanstion = c_constant./v_expanstion.^gamma

 % The state variable at state point2
 % p1v1^gamma = p2v2^gamma| p2 = p1 (v1/v2)^gamma

 p2 = p1*cr^gamma

 %p2v2/t2 = p1v1/t1 | t2 = p2v2t1/p1v1

 t2 = p2*v2*t1/(p1*v1)


 %state variable at state point 3
 v3 = v2

 %p2v2^gamma = p3v3^gamma

 p3 = p2*t3/t2

 % state variable at point 4

 v4 = v1

 %p3v3^gamma = p4v4^gamma | p4 = p3*(v3/v4)^gamma
p4 = p3*(v3/v4)^gamma
 % To plot pv graph using the above data

 figure (1)
 hold on

 plot (v1,p1,'*','color','b')
 plot(v_compression,p_compression,'linewidth',1,'color','r')

 plot (v2,p2,'*','color','b')
 plot([v2 v3],[p2 p3],'linewidth',1,'color','r')

 plot (v3,p3,'*','color','b')
 plot(v_expanstion,p_expanstion,'linewidth',1,'color','r')

 plot (v4,p4,'*','color','b')
 plot([v4 v1],[p4 p1],'linewidth',1,'color','r')

  xlabel('volume')
  ylabel('ptressure')
To solve the otto cycle and the plot the graph PV(pressure volume)
Step wise solution of otto cycle
- Give the inputs parameter that is the [pi,p1,t1,t3]
- Give the engine piston specification [bore, stroke, connecting rod, compression ratio, crank angle ]
- Calculate the pressure, volume, temperature, at the four state point in which that we have to give the all value of the PVT
- Then the we have to plot the graph of PV diagram [ but this graph does not show the proper format of graph in which that compression and expansion are does not straight ]
- For the more accuracy of graph we have the use the function
- Calculate the volume at the compression for using formula [V = 1+0.5(cr-1)[R+1-cos(theta)-(R^2-(sin(theta)^2))^0.5] this volume is more accurate
- After that that volume can used for the to calculate pressure at the compression after that we got the value of P_ compression and v_ compression
- Then plot the graph P _compression and v_ compression this graph is more accurate and smooth this is show the proper why of graph
- Same use the expansion process in that we give the graph of compression and expansion we got the two line of cycle
- Then using plot command to joint the 2-3 and 4-1 point [here is volume is constant that why line is straight in the graph ]
- We got the proper graph of otto cycle
Errors when the run the programing
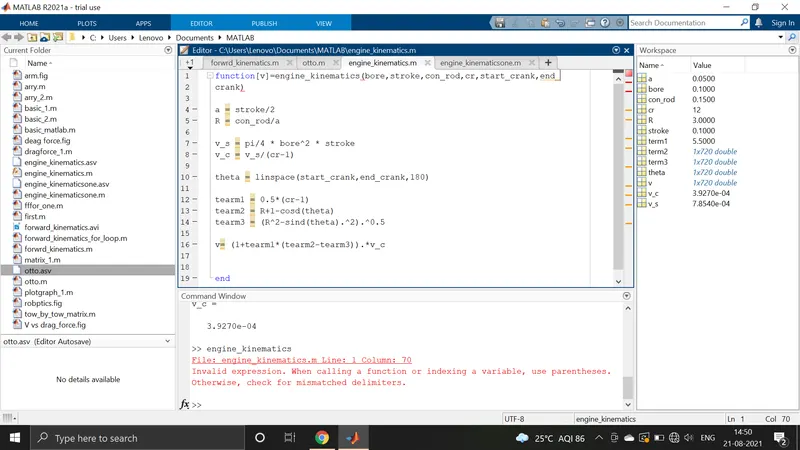
- Missing the alphabet d in sin it will write in [sind] format
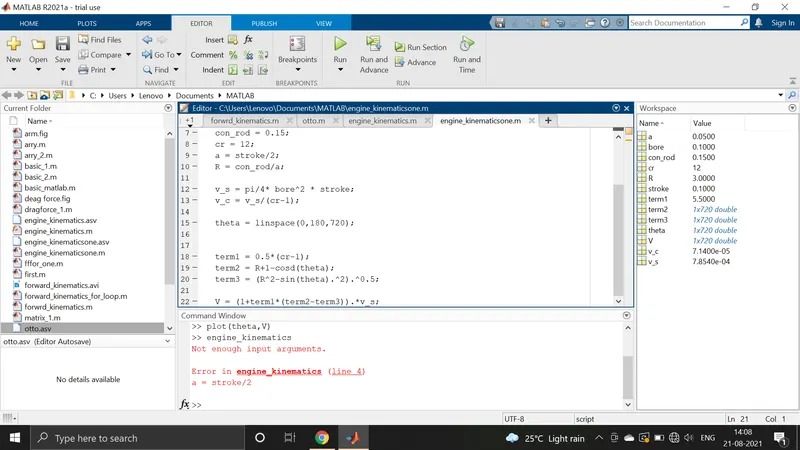
- when you call the function then write the calling value in proper format