Modelling and simulation of flow through a flowbench
Modelling and simulation of flow through a flow bench
Aim
The purpose of this analysis is to create a 3D model of a bench flow and find out the pressure loss and mass flow rate in intake port of cylinder head of IC engine for different valve lift using solidworks flow simulation.
What is SOLIDWORKS Flow Simulation?
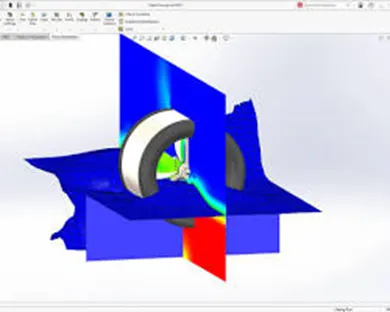
SOLIDWORKS Flow Simulation
SOLIDWORKS Flow Simulation is a computational fluid dynamics (CFD) software program that is embedded within the SOLIDWORKS 3D CAD modeling environment. It allows engineers and designers to simulate the behavior of fluids (liquids and gases) flowing through and around their designs. This can be used to optimize product performance, reduce costs, and improve product quality.
What can SOLIDWORKS Flow Simulation be used for?
SOLIDWORKS Flow Simulation can be used for a wide variety of applications, including:
- Fluid flow analysis: This can be used to calculate the pressure, velocity, and temperature of fluids flowing through and around a design. This information can be used to identify areas of high pressure or flow, which can help to improve product performance and reduce the risk of failure.
- Heat transfer analysis: This can be used to calculate the temperature distribution within a design. This information can be used to optimize thermal management, which can help to improve product performance and reliability.
- Mixing analysis: This can be used to simulate the mixing of two or more fluids. This information can be used to optimize the design of mixers and other mixing devices.
- External flow analysis: This can be used to simulate the flow of fluids around a design, such as the flow of air around a car or the flow of water around a boat. This information can be used to improve aerodynamic performance and fuel efficiency.
Introduction:
An air flow bench is a device used for testing the internal aerodynamic qualities of an engine component and is related to the more familiar wind tunnel.
It is used primarily for testing the intake and exhaust ports of cylinder heads of IC engines. It is also used to test the flow capabilities of any component such as air filters, carburetors, manifolds or any other part that is required to flow gas. A flow bench is one of the primary tools of high performance engine builders, and porting cylinder heads would be strictly hit or miss without it.
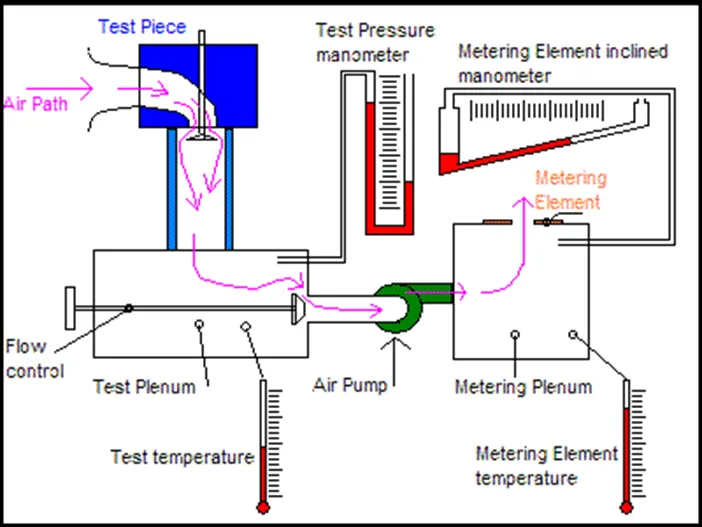
The air flow bench can give a wealth of data about the characteristics of a cylinder head or whatever part is tested. The result of main interest is bulk flow. It is the volume of air that flows through the port in a given time.
Valve lift can be expressed as an actual dimension in decimal inches or mm. It can also be specified as a ratio between a characteristic diameter and the lift L/D. Most often used is the valve head diameter.
Mass air flow (or) Mass flow rate is the weight of air that flows through the port in a given time. Expressed in pounds per minute/hour or kilograms per second/minute.
With the information gathered on the flow bench, engine power curve and system dynamics can be roughly estimated by applying various formulae. With the advent of accurate engine simulation software, however, it is much more useful to use flow data to create an engine model for a simulator.
Determining air velocity is a useful part of flow testing. Once velocity has been calculated, the volume can be calculated by multiplying the velocity by the orifice area times its flow coefficient.
Theory
What is an Flowbench? An air flow bench is a device used for testing the internal aerodynamic qualities of an engine component. It is used primarily for testing the intake and exhaust ports of cylinder heads of internal combustion engines. It is also used to test the flow capabilities of any component such as air filters, carburetors, manifolds or any other part that is required to flow gas. A flow bench is one of the primary tools of high performance engine builders.
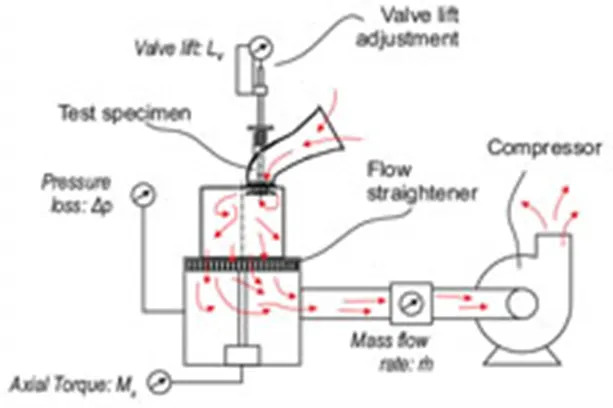
A flow bench consists of an air pump, a metering element, pressure and temperature measuring instruments such as manometers, and various controls. The test bench is attached in series with the pump and measuring element and air is pumped through the whole system. Therefore, all the air passing through the metering element also passes through the test bench. Because the volume flow rate through the metering element is mesured and the flow through the test bench also measured. The mass flow rate can be calculated using the pressure and temperature data to calculate air densities, and multiplying by the volume flow rate.
Simulation Setup :
Parameters
Analysis Type : Internal
Fluid : Air
Pressure : 101325 Pa
Temperature :293.2 K
FLOW SIMULATION SETUP:
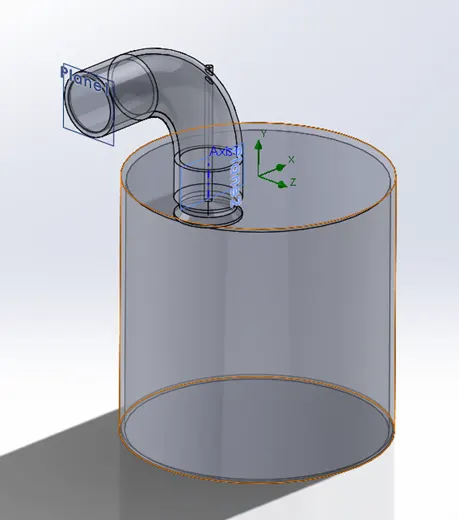
Open the solidworks part file, and then start the 3D design of a bench flow for intake port of a cylinder head. Finally save your design and using lids close both the flow inlet and outlet. After that follow the following condition to run the simulation process properly.
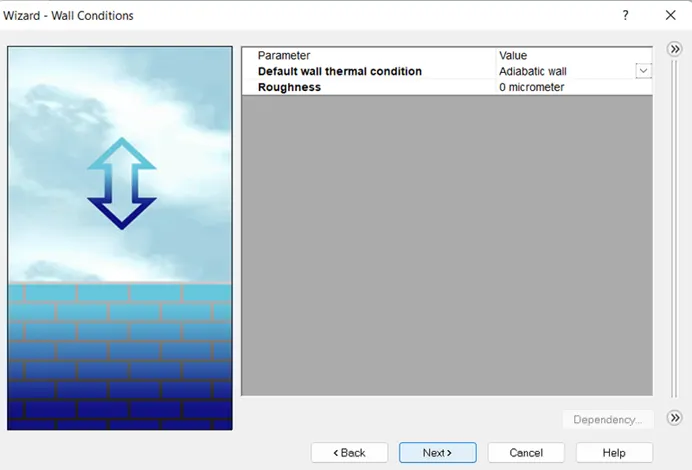
i) Initial Conditions: Create the new flow simulation using the wizard comment. Here had given project name, analysis type, fluid, wall conditions and initial conditions. This mentioned parameters are the input value to start the simulation process, because our result is based on that.
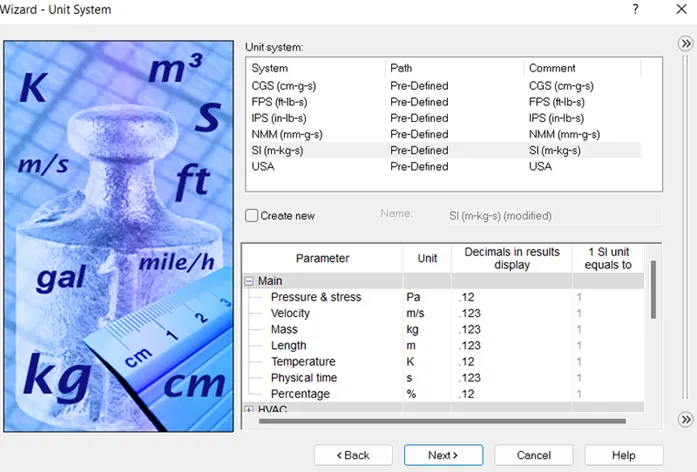
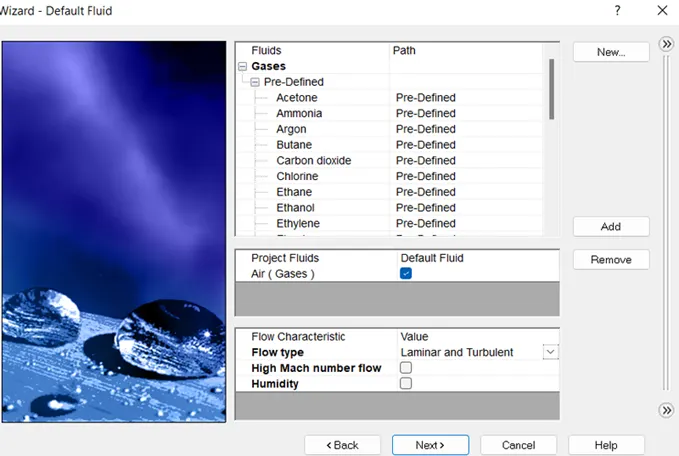
Flow type : Laminar & turbulence
Modal
Procedure
- Design a Flowbench as shown above with suitable dimension
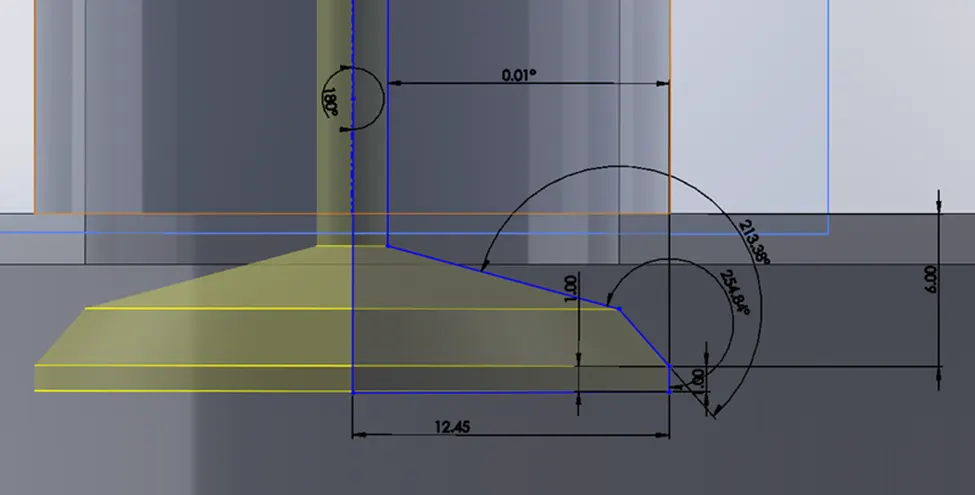
- Fully define the sketch of the valve as shown above
- Run a grid dependence test for three different level of initial mesh (3, 5, 7)
- Choose a suitable level of initial mesh and setup a parametric studies
- Insert the boundaries, goals, cut plot, and flow trajectories
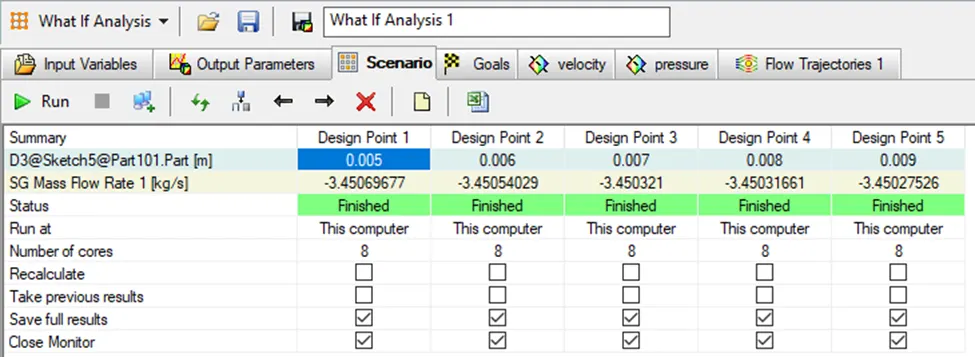
- Run the parametric studies with the valve lift as an input
- Obtain effect of valve lift on mass flow rate graph
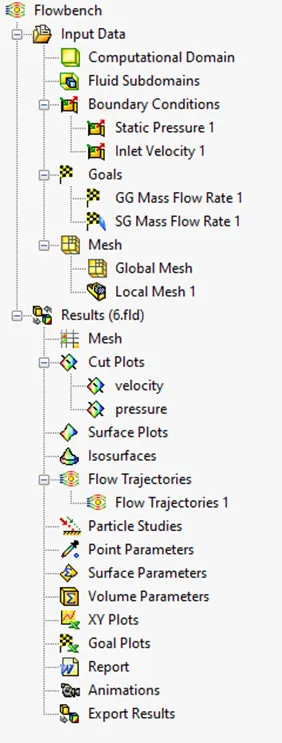
Result
Grid dependence test
(mesh level = 3)
Plots: velocity pressure trajectory
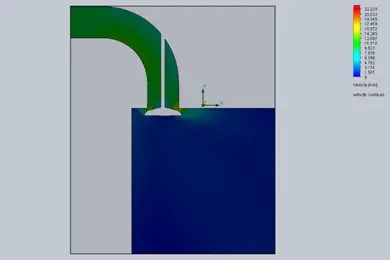
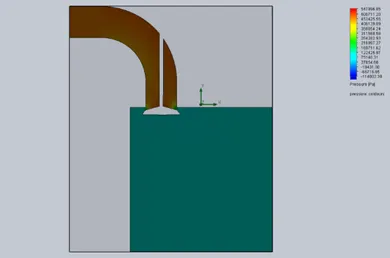
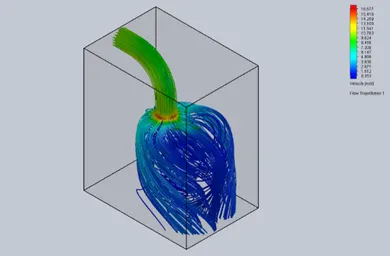
(mesh level = 5)
Plots: velocity pressure trajectory
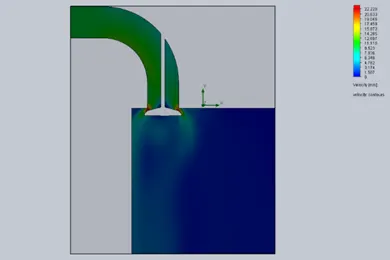
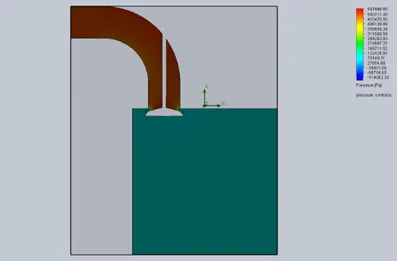
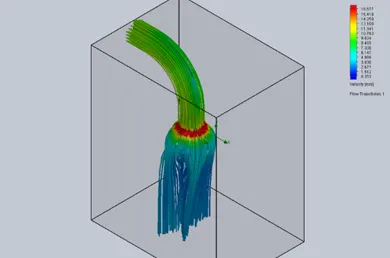
(mesh level = 7)
Plots: velocity pressure trajectory
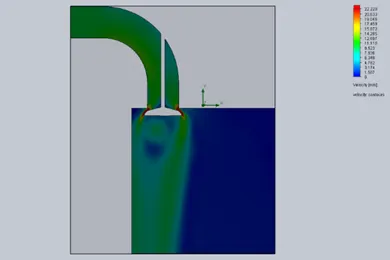
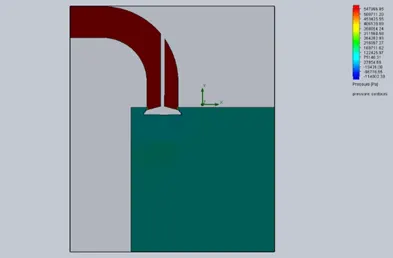
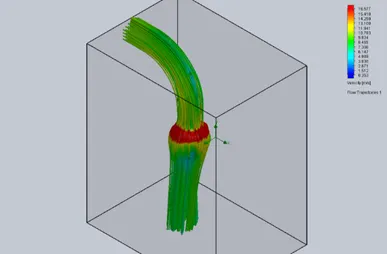
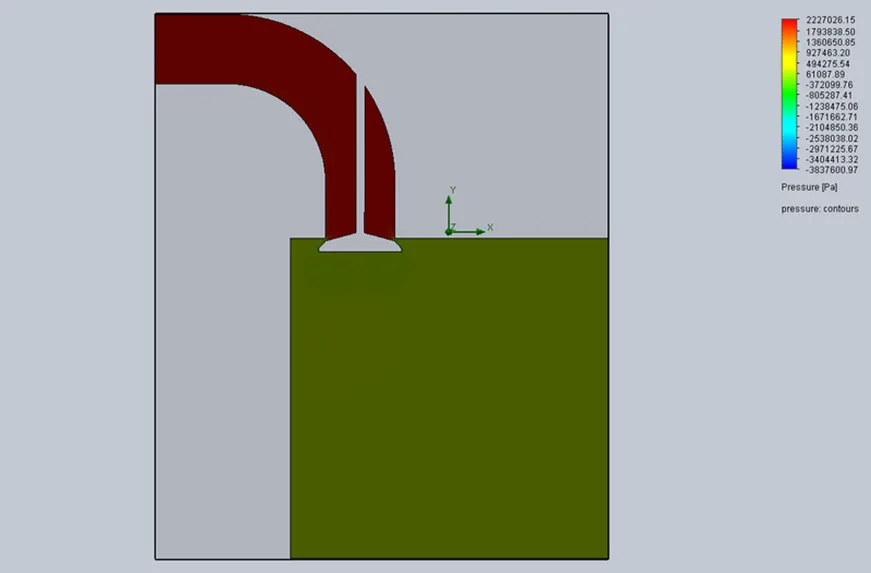
Case Study 1 (Valve Lift = 0.005 m)
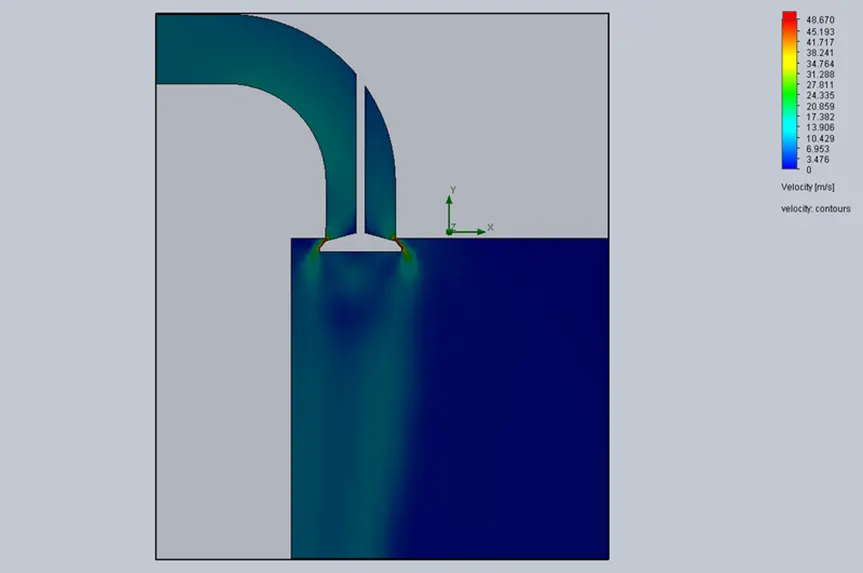
Velocity plot
pressure plot
Trajectory plot
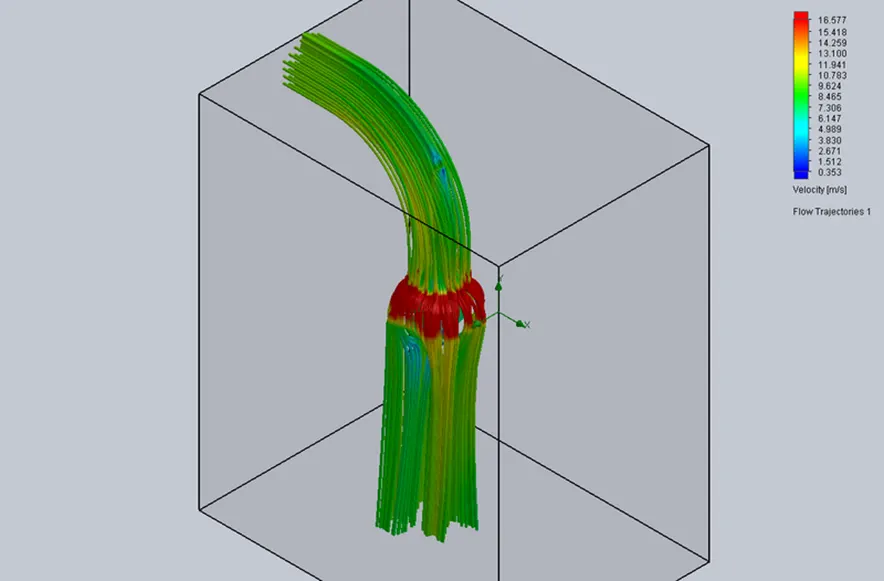
Observation The maximum velocity = 48.670 m/s , the maximum pressure = 2227026 Pa ,
the mass flow rate = -3.4507 kg/s
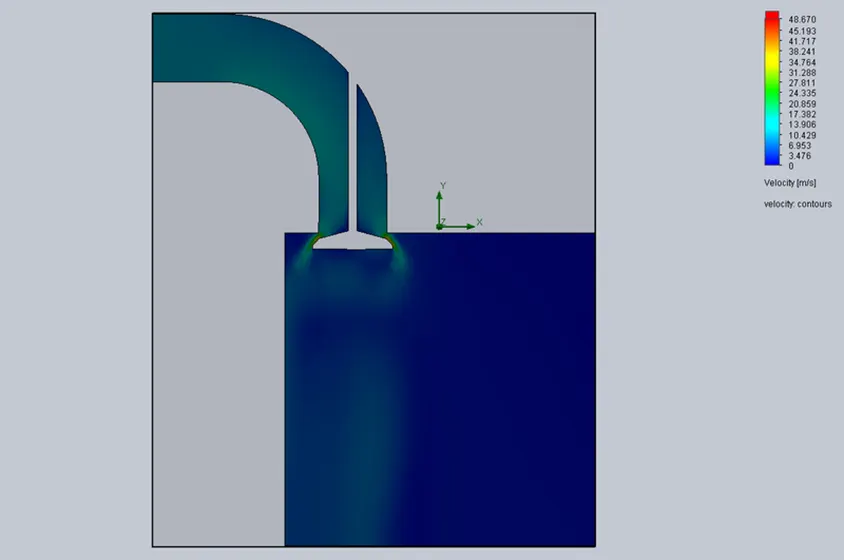
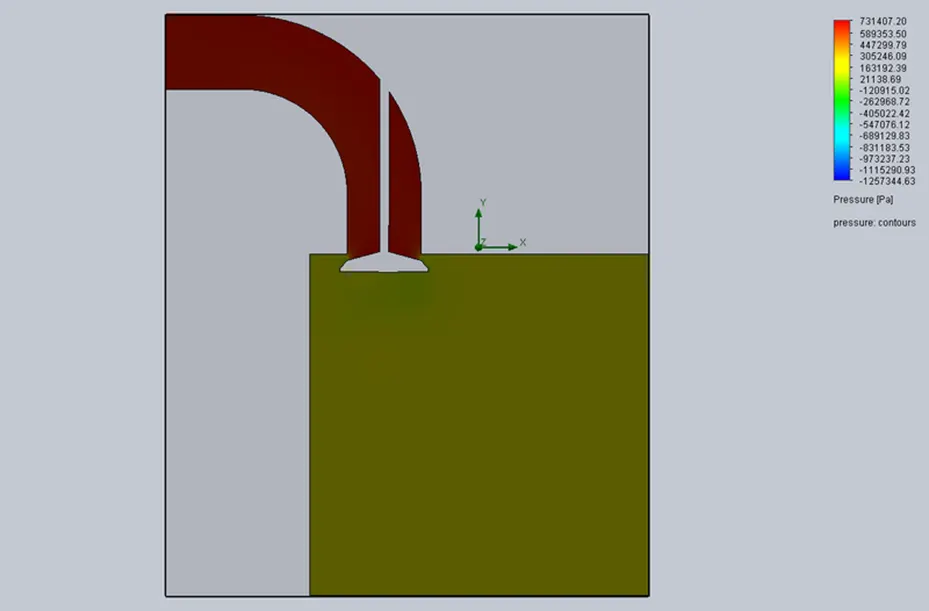
Case Study 1 (Valve Lift = 0.006 m)
Velocity plot
pressure plot
Trajectory plot
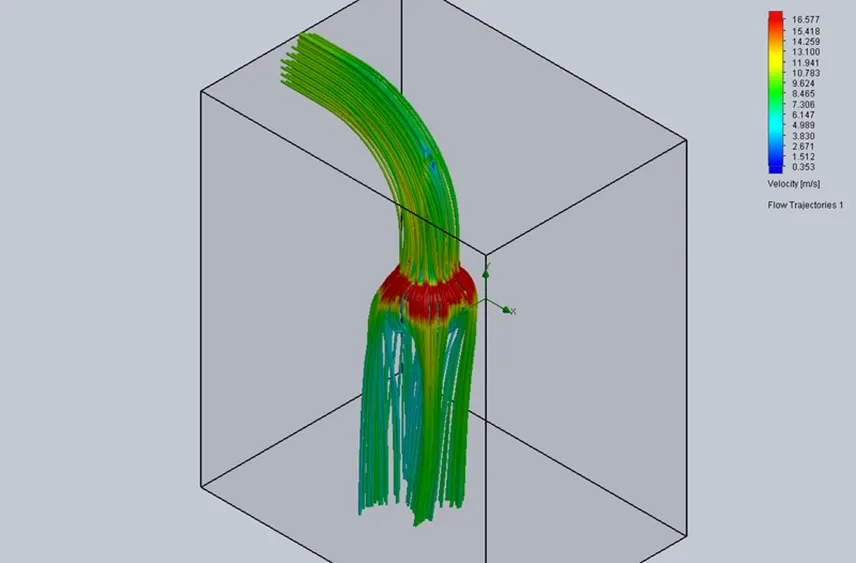
Observation The maximum velocity = 48.670 m/s, the maximum pressure = 731407 Pa,
the mass flow rate = -3.4505 kg/s
Case Study 1 (Valve Lift = 0.007 m)
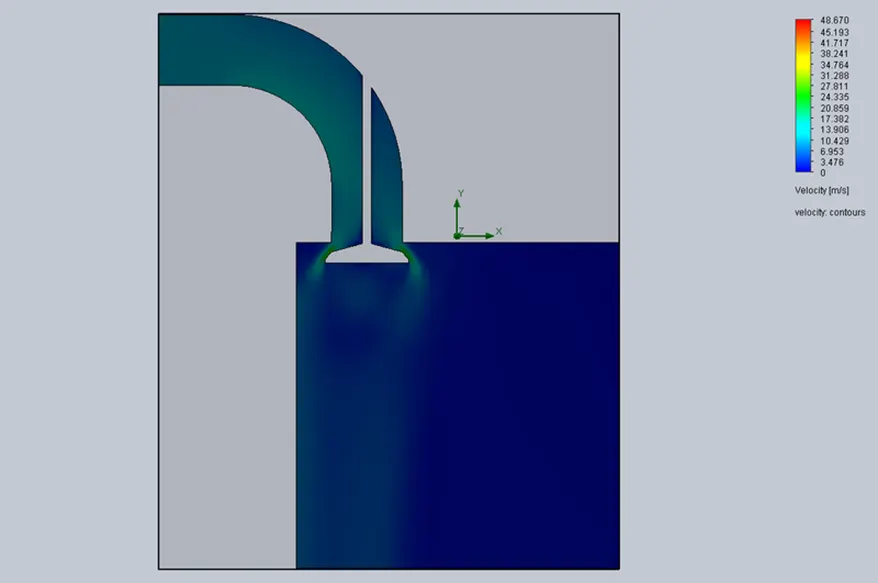
Velocity plot
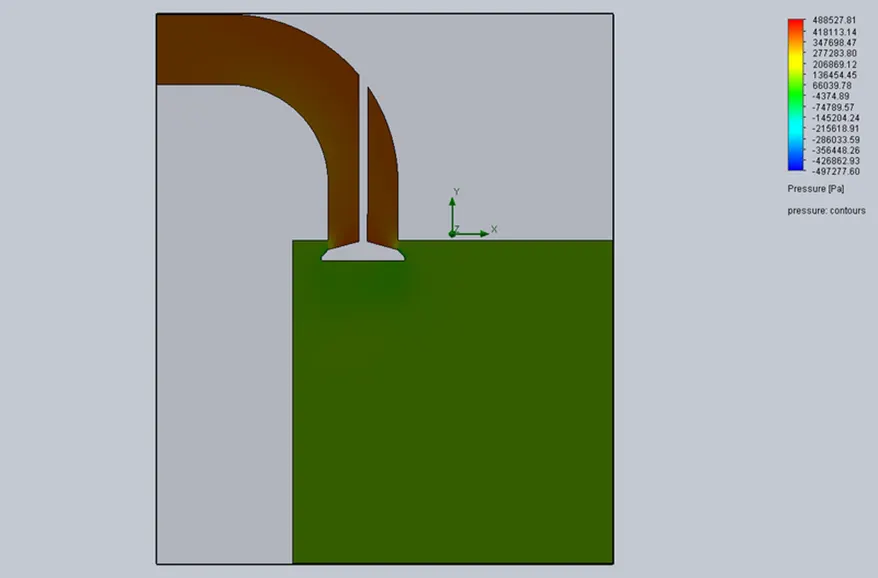
pressure plot
Trajectory plot
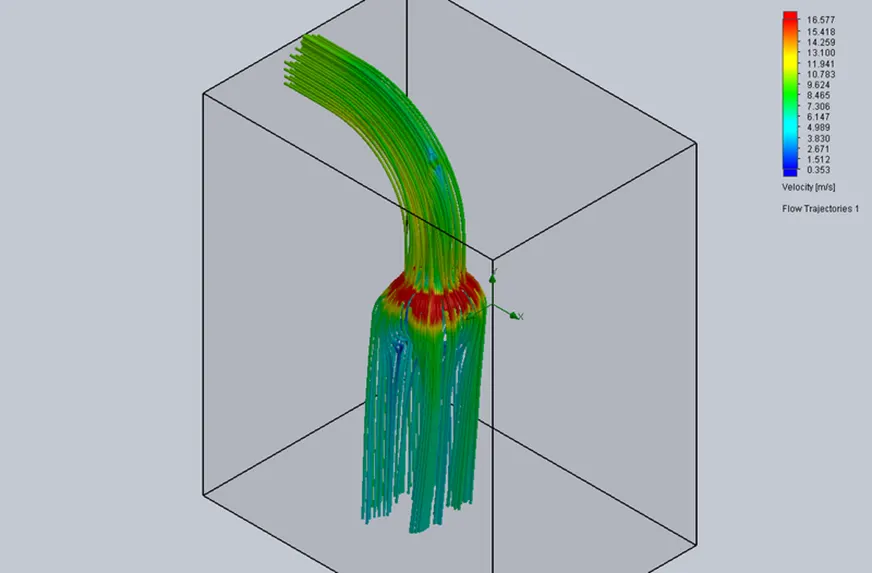
Observation The maximum velocity = 48.670 m/s, the maximum pressure = 480527 Pa,
the mass flow rate = -3.4503 kg/s
Case Study 1 (Valve Lift = 0.008 m)
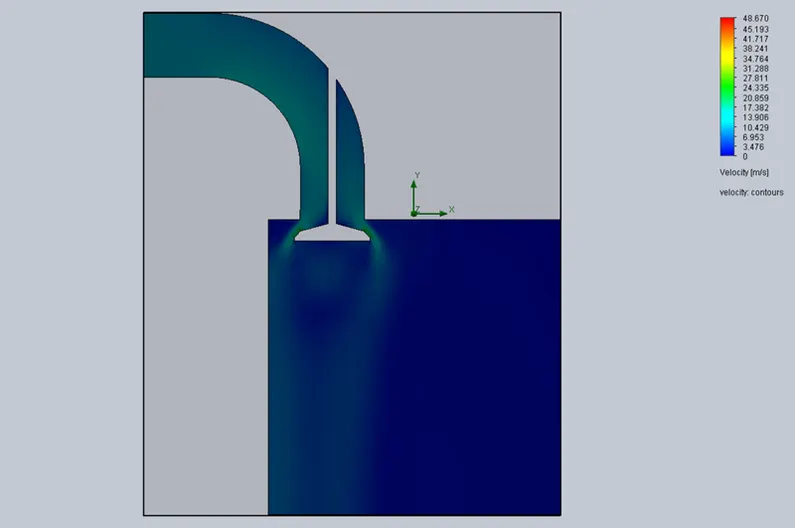
Velocity plot
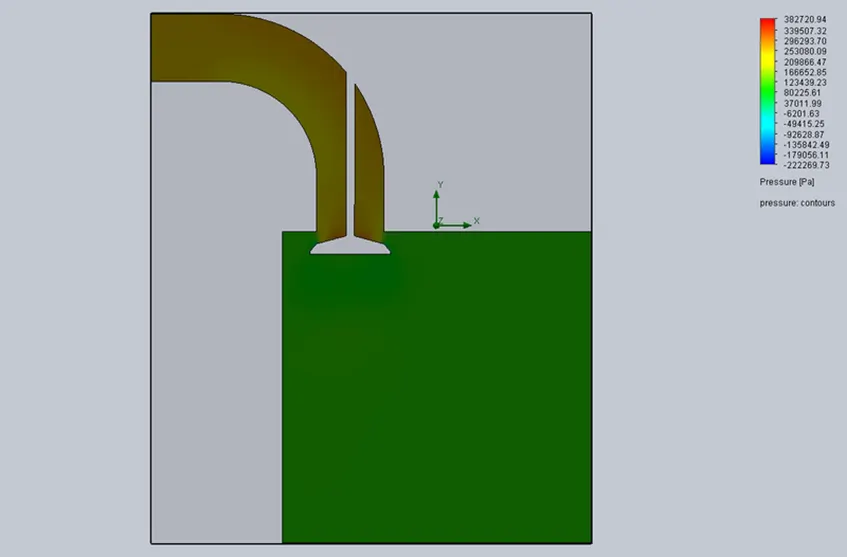
pressure plot
Trajectory plot
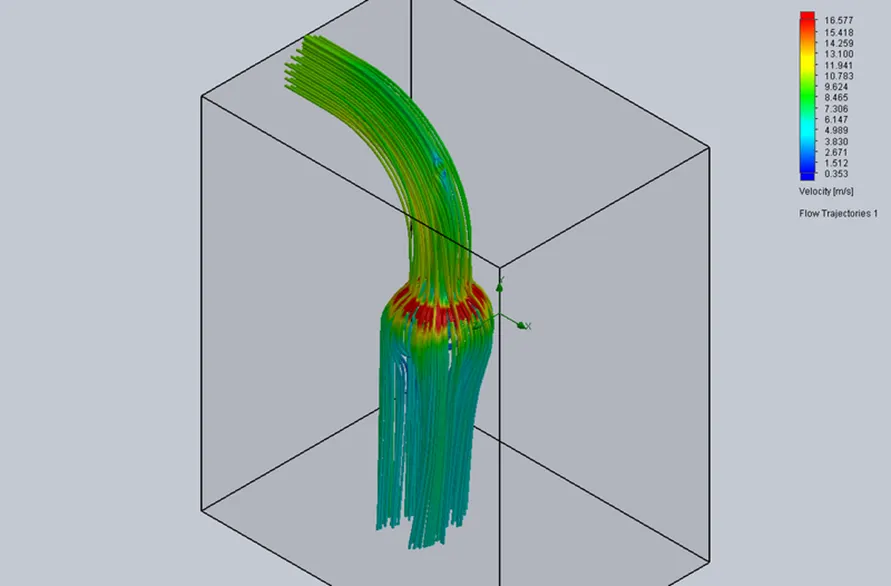
Observation The maximum velocity = 48.670 m/s, the maximum pressure = 382720 Pa,
the mass flow rate = -3.4503 kg/s
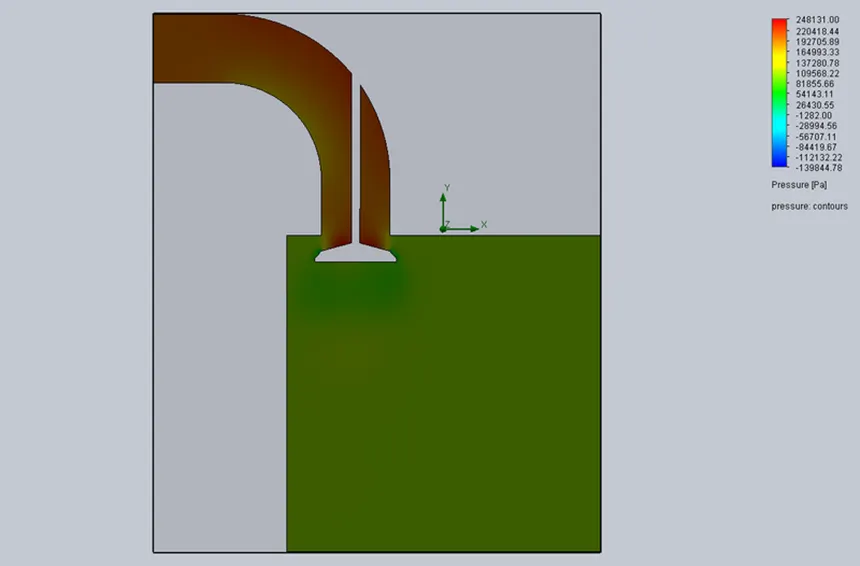
Case Study 1 (Valve Lift = 0.009 m)
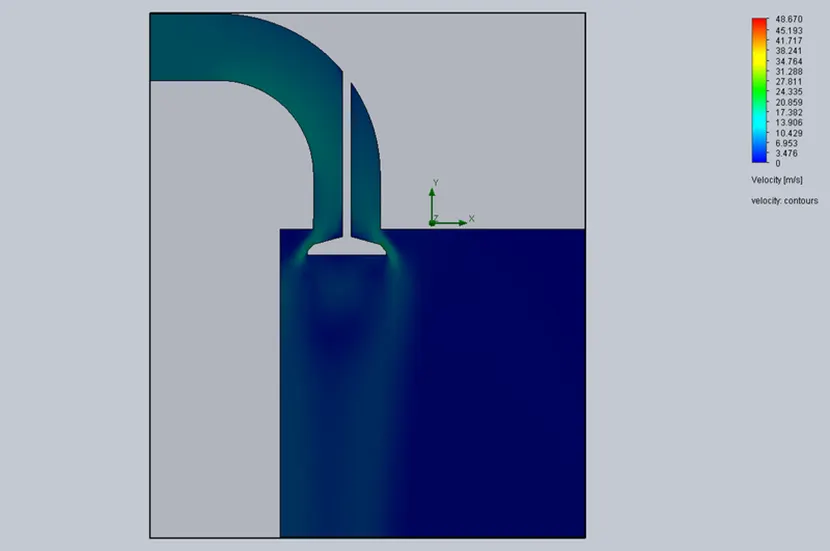
Velocity plot
pressure plot
Trajectory plot
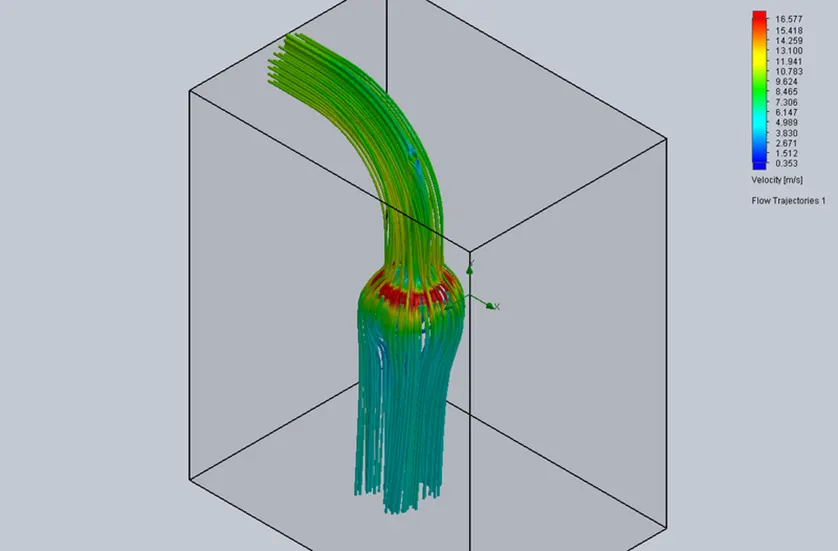
Observation The maximum velocity = 48.670 m/s, the maximum pressure = 248131 Pa,
the mass flow rate = -3.4503 kg/s
Plot for mass flow rate for different valve lift
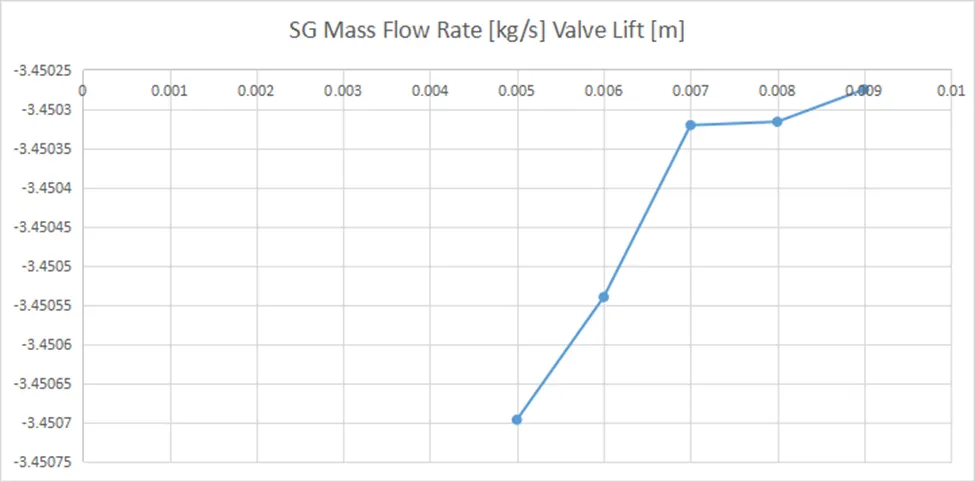
Parametric study result

Conclusion/Observation
- From the graph, we can say that when the valve lift increases the velocity increases
- When the valve is closed the pressure in the pipe is maximum and when the valve lift increses the the pressure decreases.
- From the parametric result, we can say that when the valve lift increses the mass flow rate increases.