Modelling and simulation of flow through a flowbench
Aim: In this study, I did the flow simulation study on 3D model flow bench in solidworks software. In this study, I find the best mesh size by grid test for particular value of lift and after getting the best mesh, I find the mass flow rate effect by changing the different value of lift of valve.
Introduction: An air flow bench is a device used for testing the internal aerodynamic qualities of an engine component. It is used primarily for testing the intake and exhaust ports of IC engine cylinder. It has some components:
- Air pump
- Pressure and Temperature measuring instrument
- Metering element
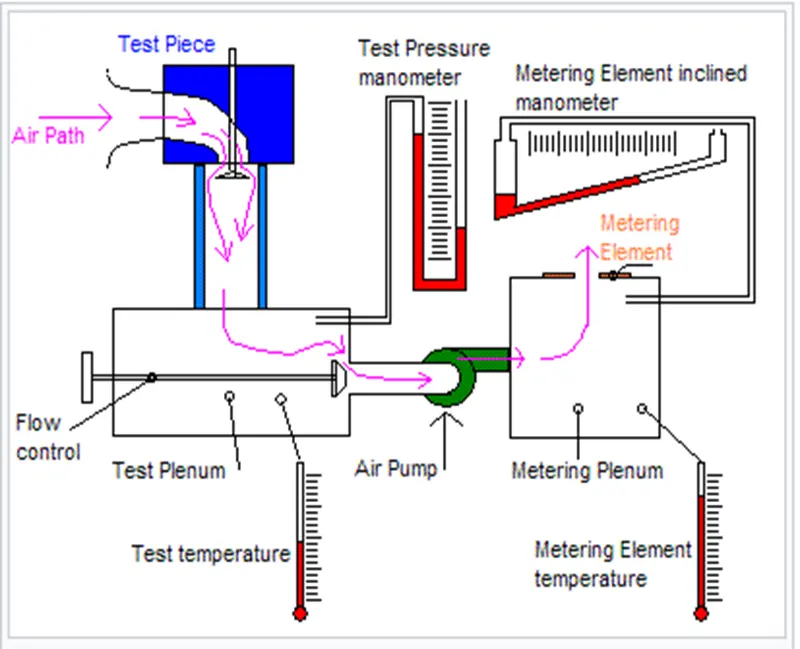
Air flow through test piece by pump and goes to the metering element manometer where we can calculate the volume of air which will be equal to volume of air coming through the test piece.
Air density can also be calculate by pressure and temperature condition (PV= mRT: -
P=Density x universal gas constant x Temperature)
And by calculating the density we can calculate the mass flow rate by:-
Mass flow rate= Volume x Density
Methodology:-
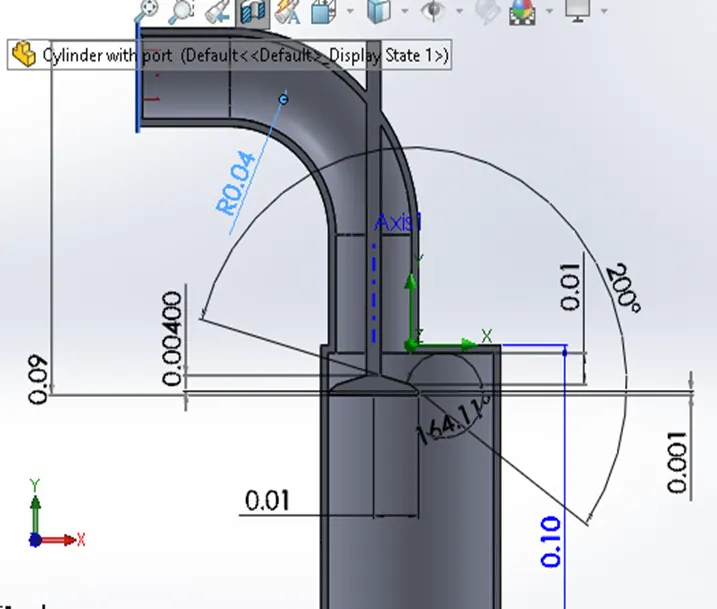
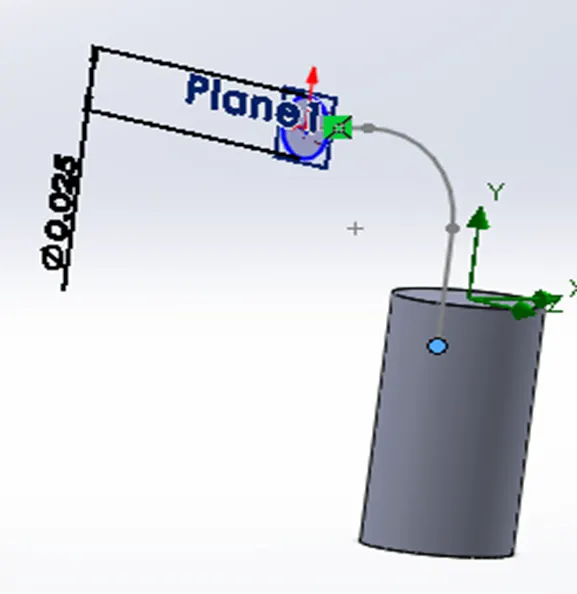
- Firstly, I create the model in solidworks. (All dimension in meter)
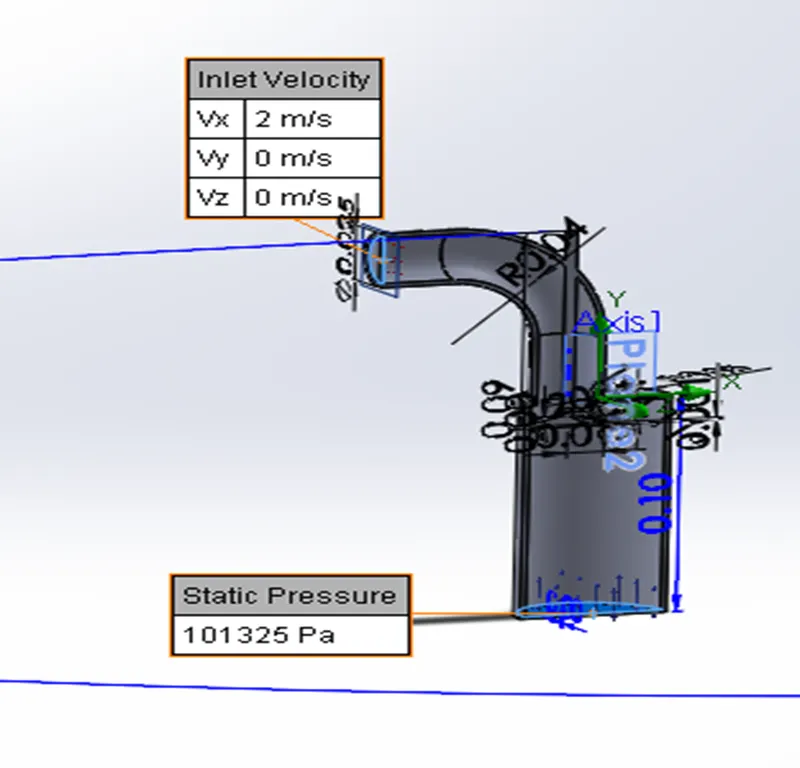
- Select the flow simulation module and insert boundary condition:-
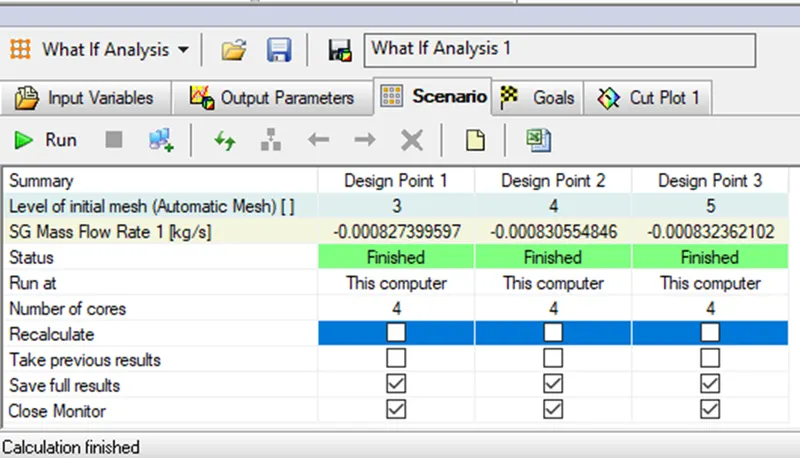
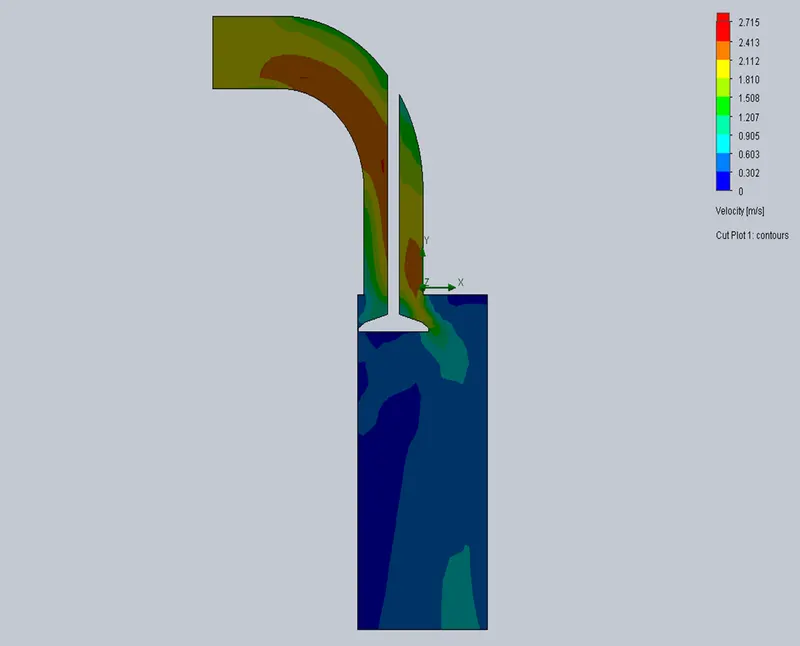
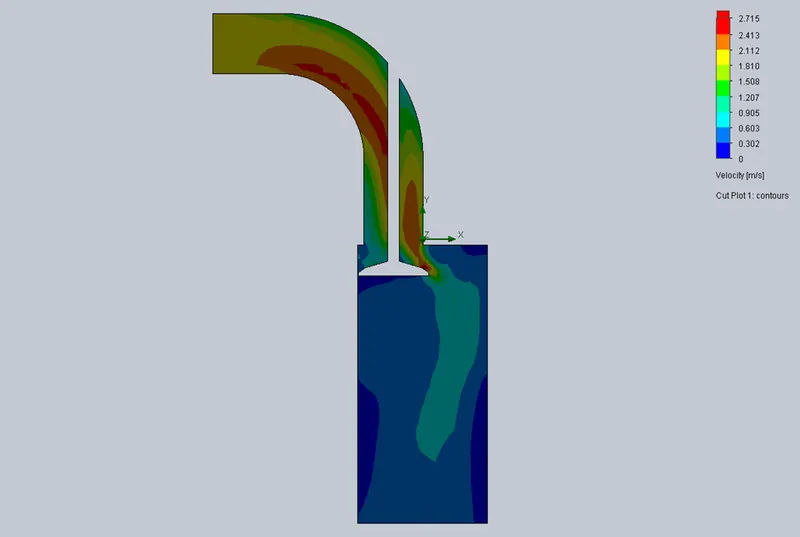
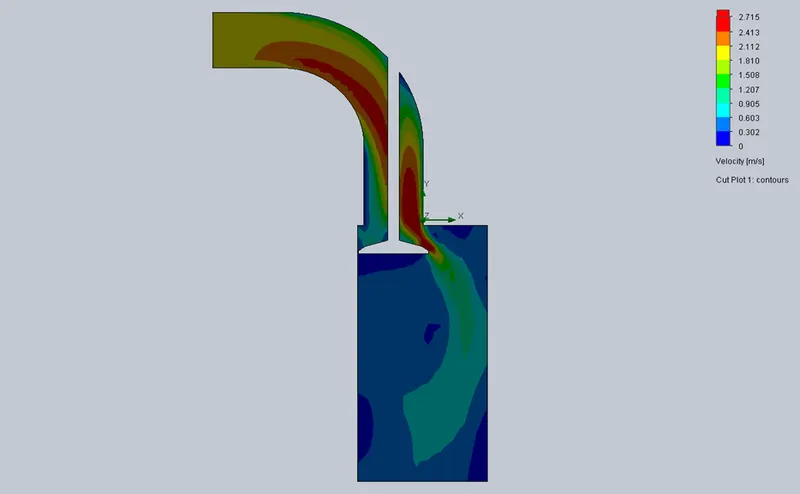
- Now I did the grid test for selecting appropriate mesh. As in below table, we can see that at mesh level of 5 mass flow rate is more equal to at mesh level of 4 and also by seeing the velocity cut plots At mesh level 5,more accurate information can get.So now can select mesh level of 5 for further simulation.
At mesh level 3
At mesh level 4
At mesh level 5
- Now I did the variation in mass flow rate with changing lift value of valve at mesh level of 5
Result and discussion:
Here,I test the mass flow rate variation with lift value at 7 design point from 0.001m to 0.008m
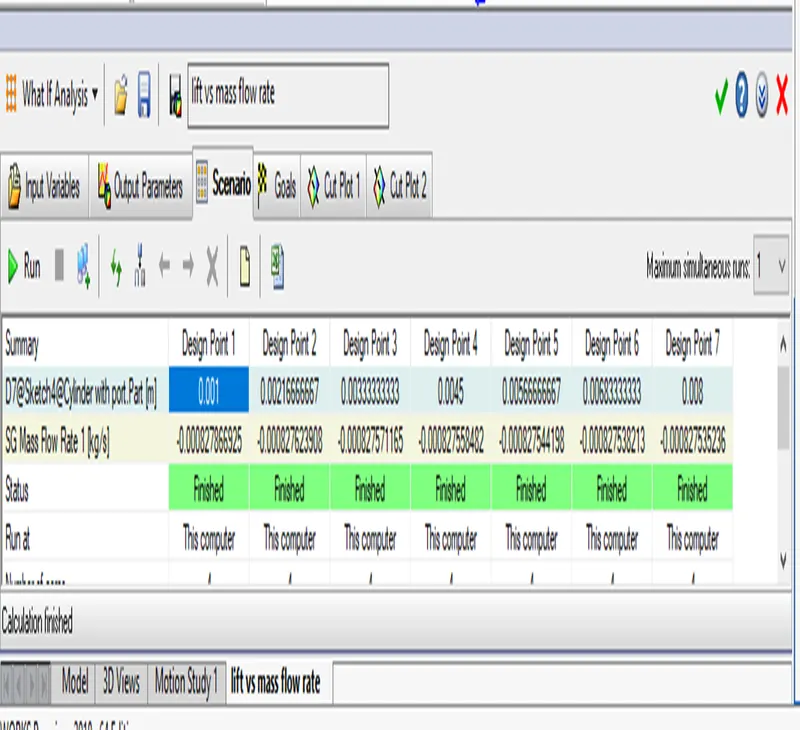
I remove the negative sighn because negative sighn shows only exit or going to the outside of cylinder
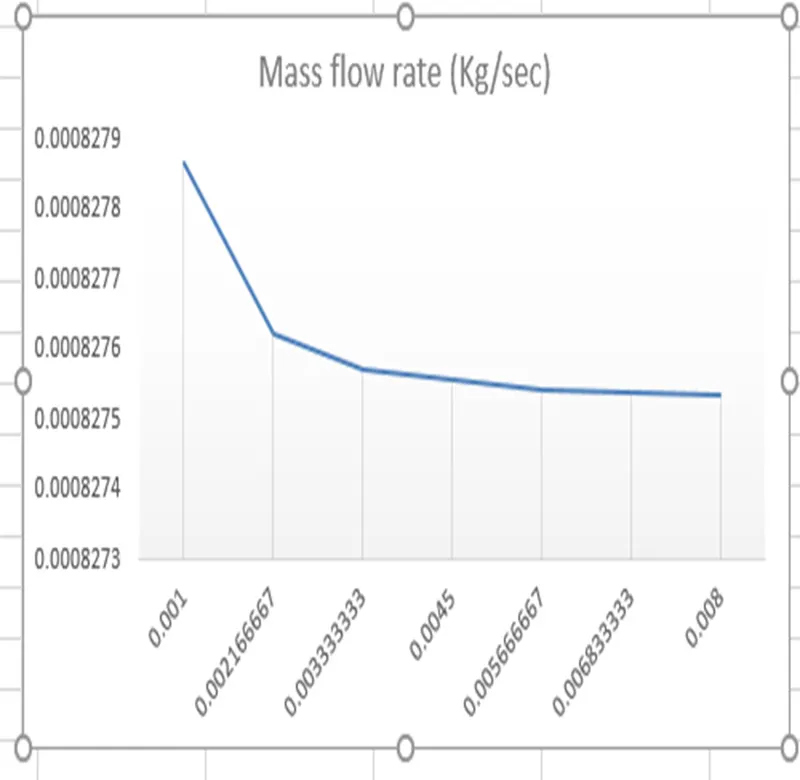
It is the graph of mass flow rate vs lift of valve
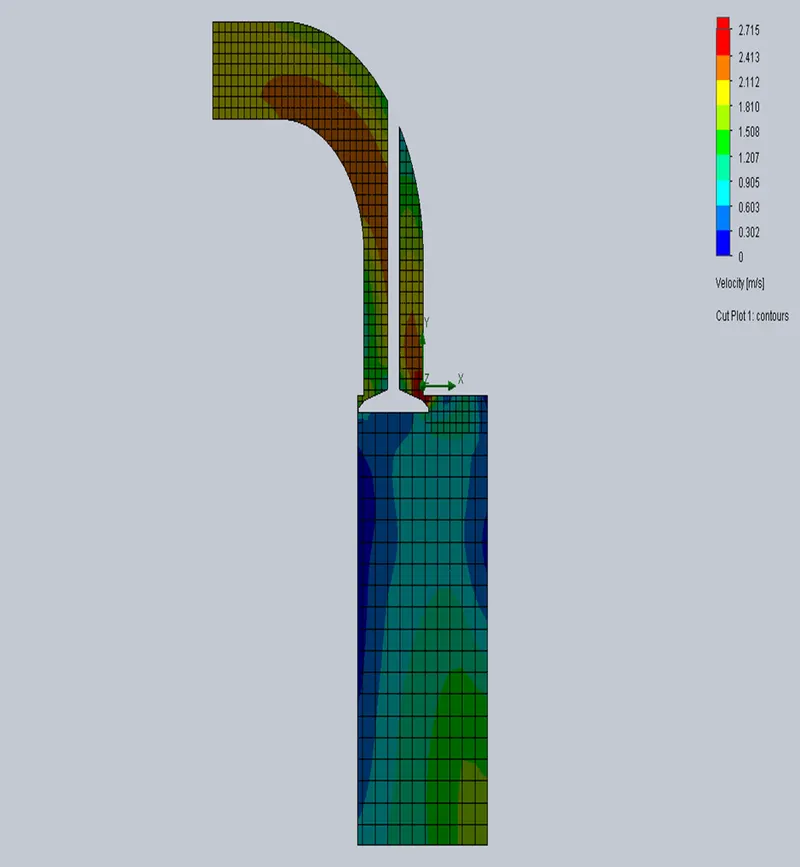
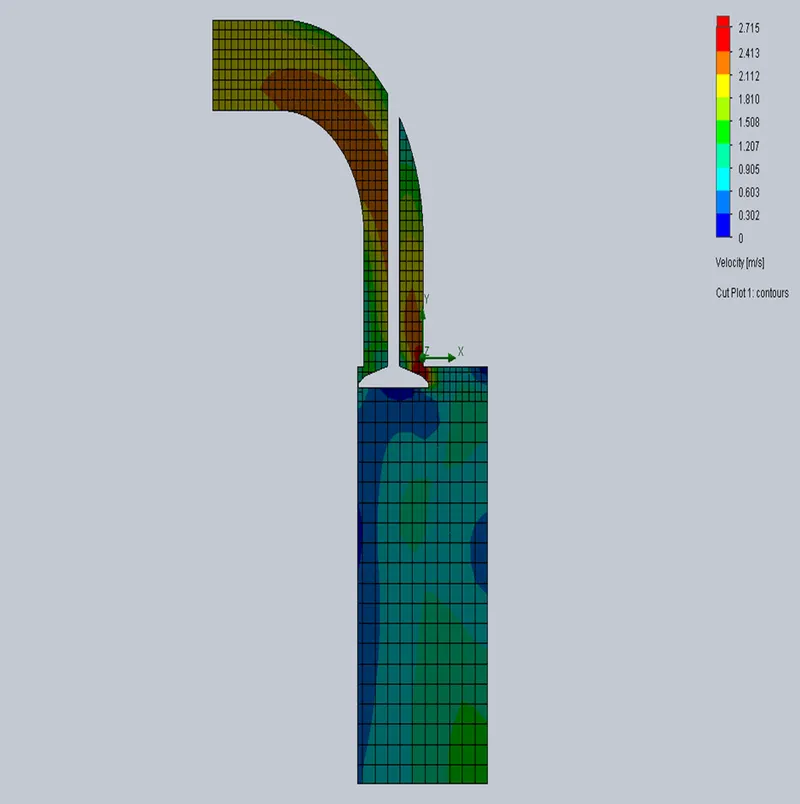
Now below figures are velocity cut plotes at 0.001 to 0.008 lift respectively
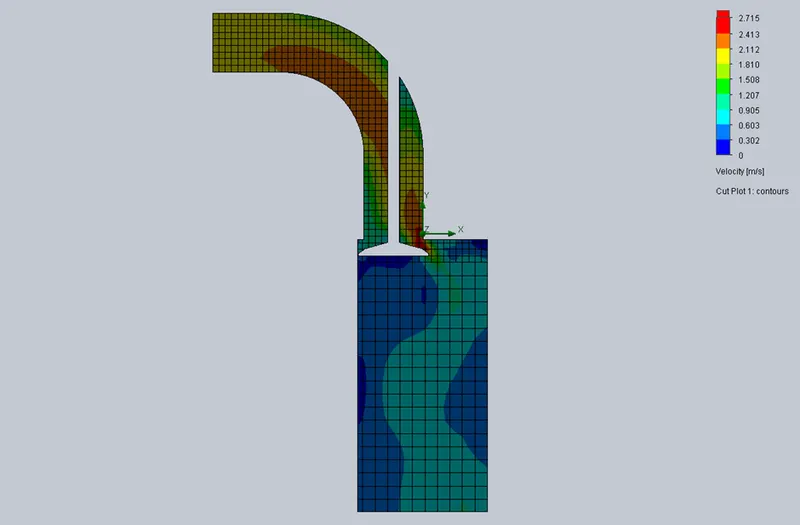
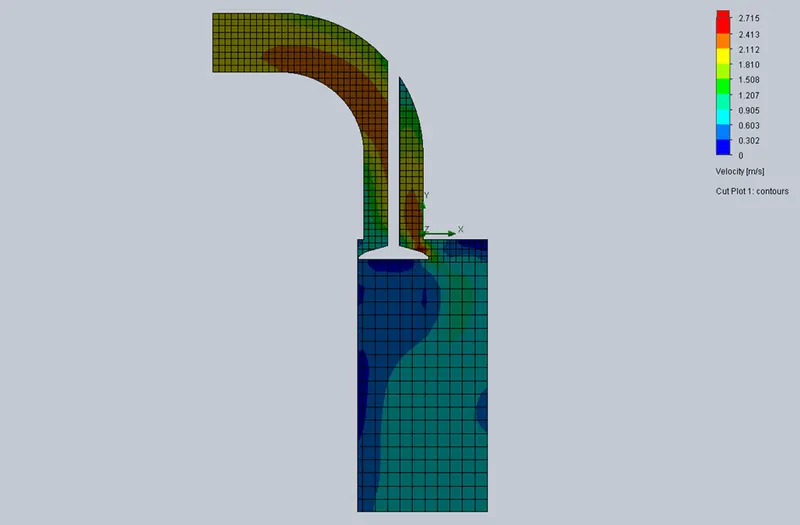
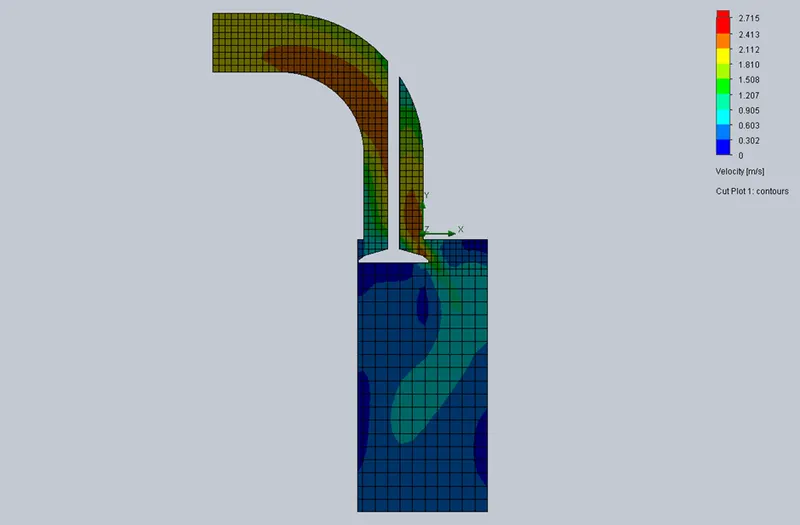
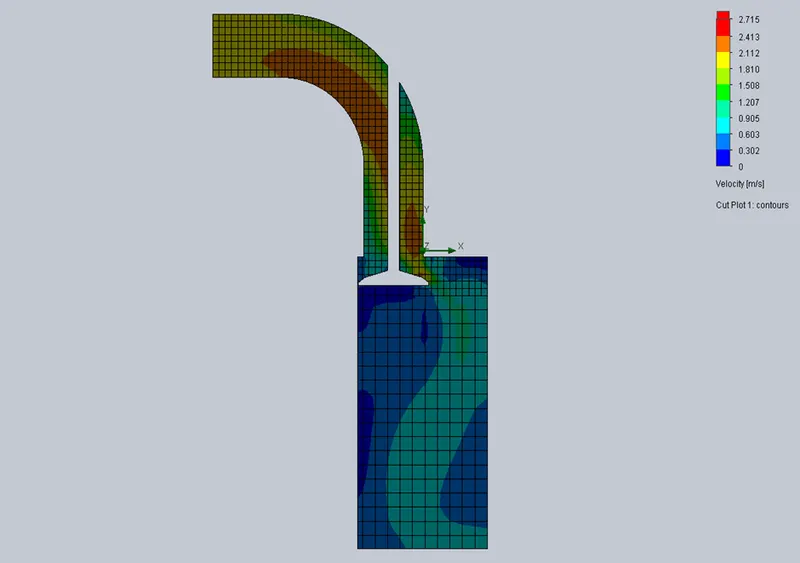
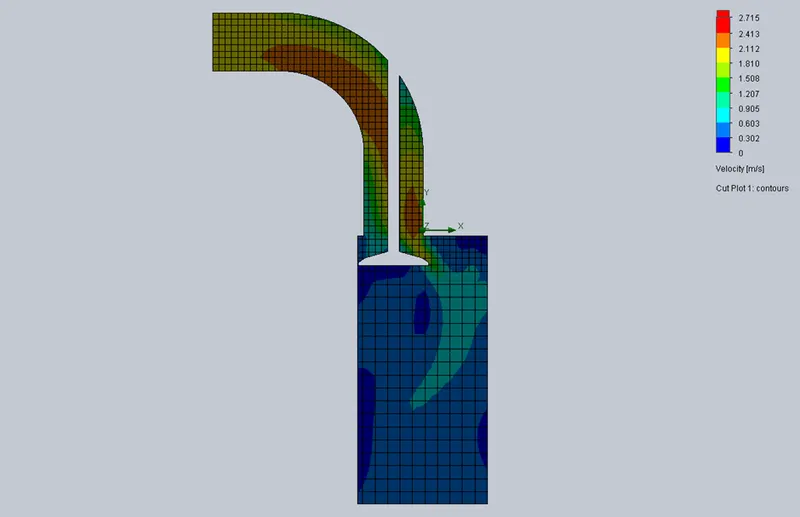
Trajectory flow
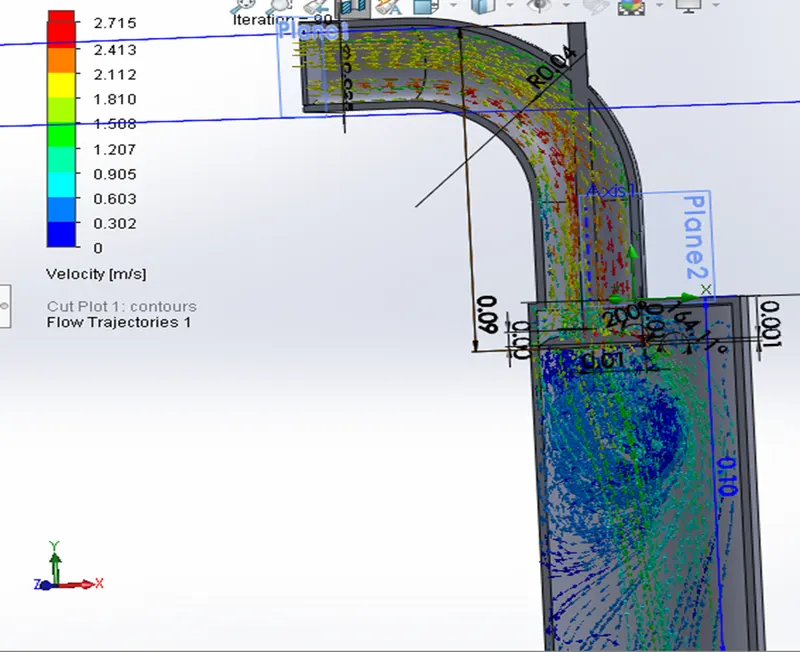
Mass flow rate decrease as lift increase as shown in our study .The reason can be behind may be giving input boundary condition of 2m/sec velocity at input.becuase by increasing lift the velocity is decrease at base of cylinder as can be seen by colour code of blue (Inside pressure can be more as compare to outside so flow can be reverse, may be it can be from inside to outside.