Modelling and simulation of flow through a flowbench
AIM :
To create a 3D model of a flow bench and run flow analysis.
To conduct grid dependence test for three grids and to run your simulation at a particular valve lift.
To run a parametric sweep to show the effect of valve lift on mass flow rate for the best grid.
To discuss the results and observations.
INTRODUCTION :
AIR FLOW BENCH : An air flow bench is a device used for testing the internal aerodynamic qualities of an engine component and is related to the more familiar wind tunnel
It is used primarily for testing the intake and exhaust ports of cylinder haeds of IC Engines. It is also used to test the flow capabilities of any component such as air filters, carburetors, manifolds or any other part that is required to flow gas. A flow bench is one of the primary tools of high performance engine builders, and porting cylinder heads would be strictly hit or miss without it.
METHODOLOGY :
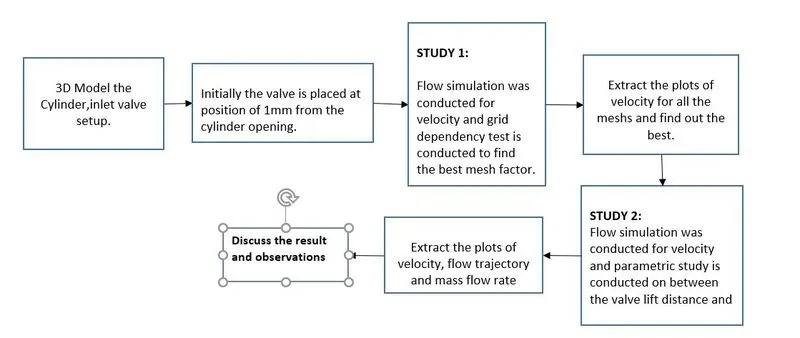
MODELLING :
Cylinder : Diameter : 100 mm , Length = 100mm
Thickness of the walls throughout the assembly : 1mm
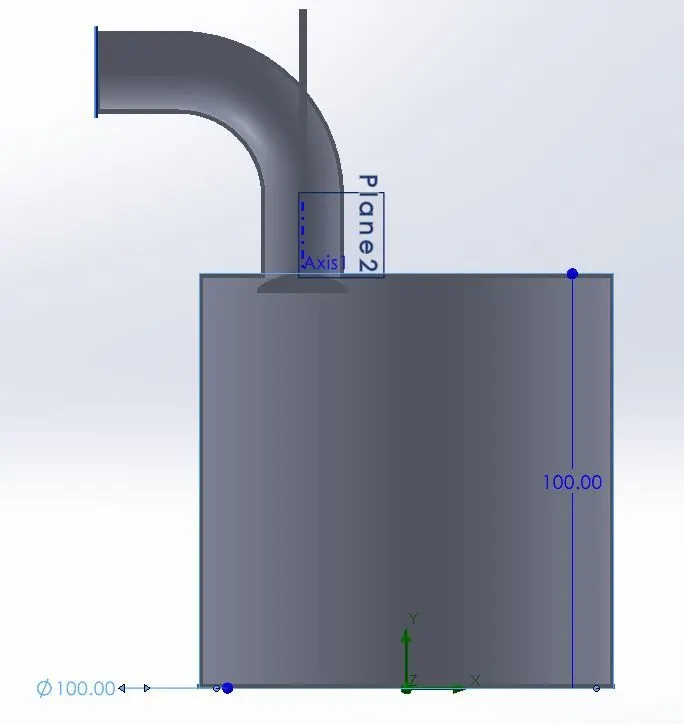
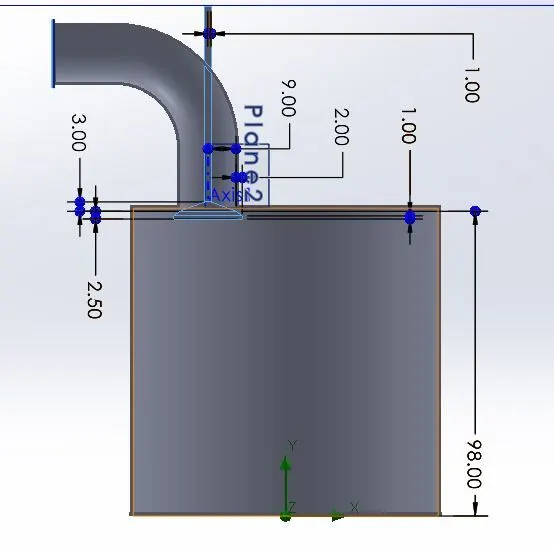
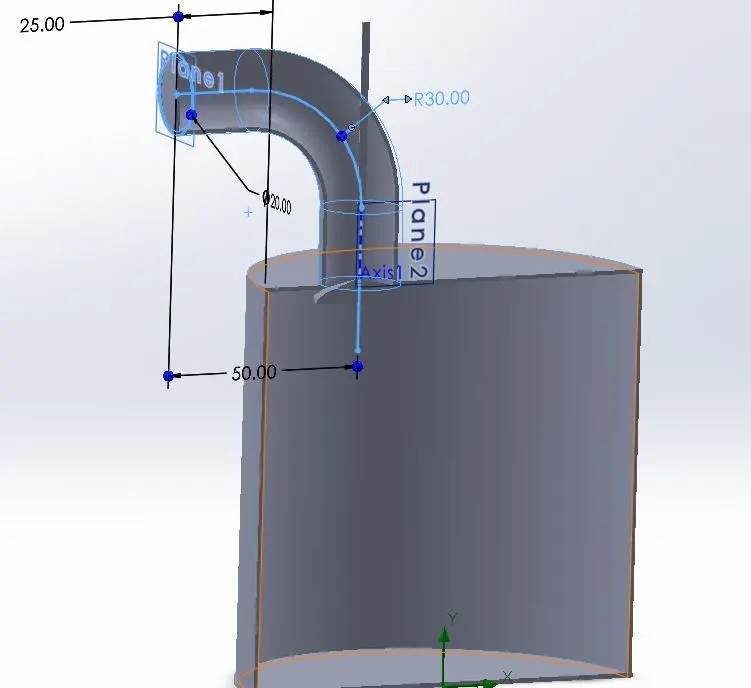
FLOW SIMULATION :
Type : Internal
Fluid : Air
Study 1 : Grid dependence test for three grids
Type : Internal
Fluid : Air
Lids are created at Inlet and outlet
Boundary conditions : Inlet : Total Pressure(401325); Outlet : Static Pressure(101325); Real wall
Initial Grid size : 3
Valve Lift : 1mm
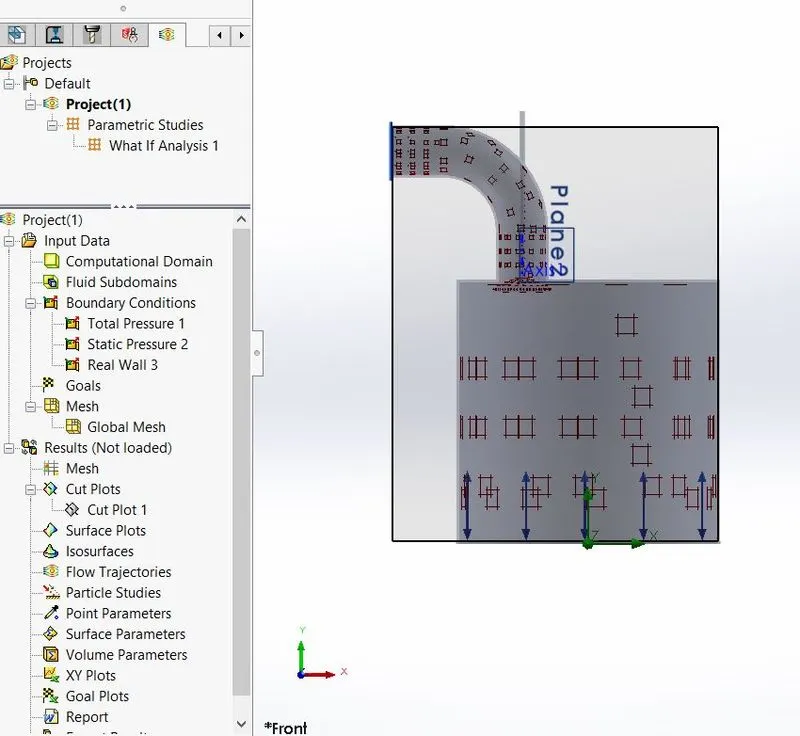
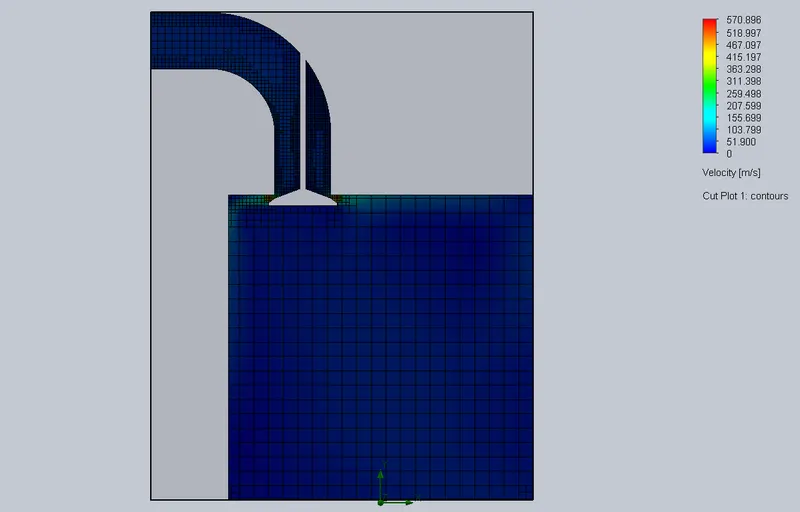
Baseline velocity cut plot :
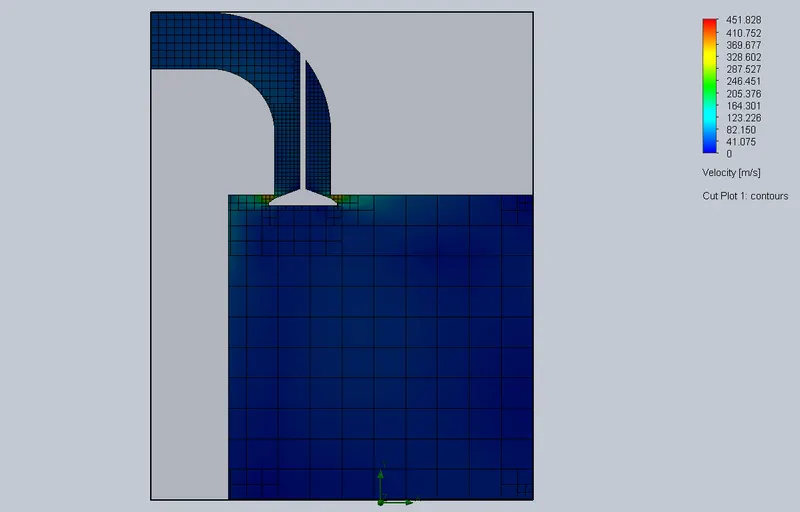
Baseline velocity cut plot
Parametric study between grid size and velocity :
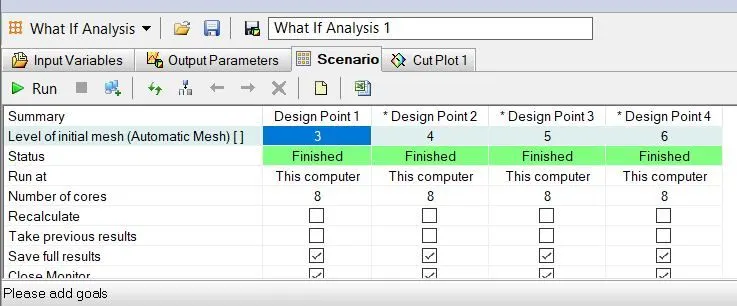
Comparision between the velocity plots :
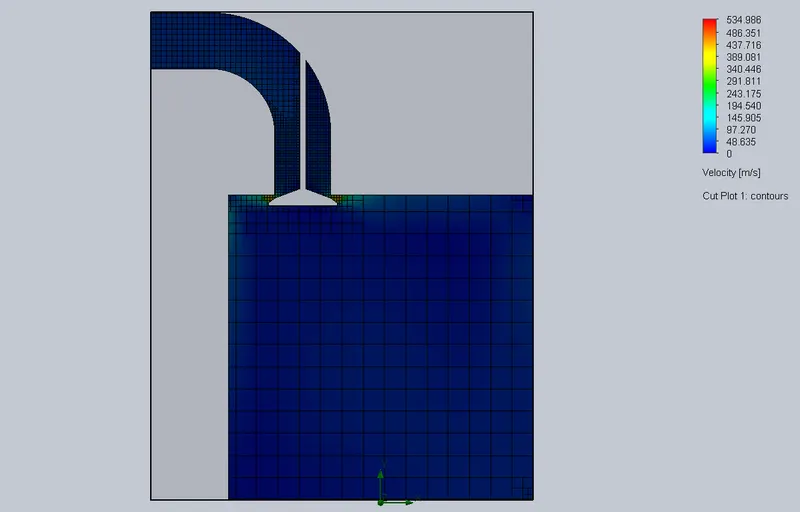 Design point 1 : Grid : 3 Design point 1 : Grid : 4
Design point 1 : Grid : 5
By this comparison, it is found that as grid size increases the velocity increases and it is clearly evident that grid 5 provides a detailed result than the others. However the grid size can further be increased to get a detailed result but it increases the simulation time proportionally.
For Study 2 lets use the grid size : 5
STUDY 2 : Parametric study between valve lift and mass flow rate
Type : Internal
Fluid : Air
Lids are created at Inlet and outlet
Boundary conditions : Inlet : Total Pressure(401325); Outlet : Static Pressure(101325); Real wall
Mesh : Local mesh : 5, Local mesh : 5
Initial valve Lift : 1mm
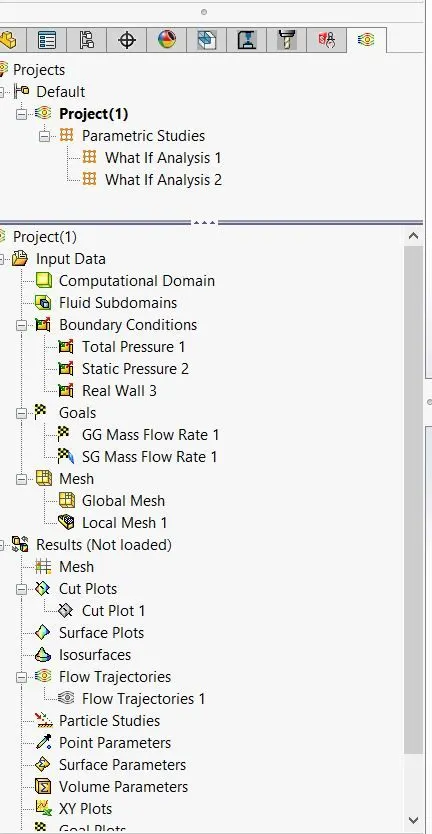
Goal : Global goal : mass flow rate, Surface goal : mass flow rate
Result : Velocity plot
Flow trajectories : Number : 200
Results of baseline simulation(Valve Lift : 1mm) :
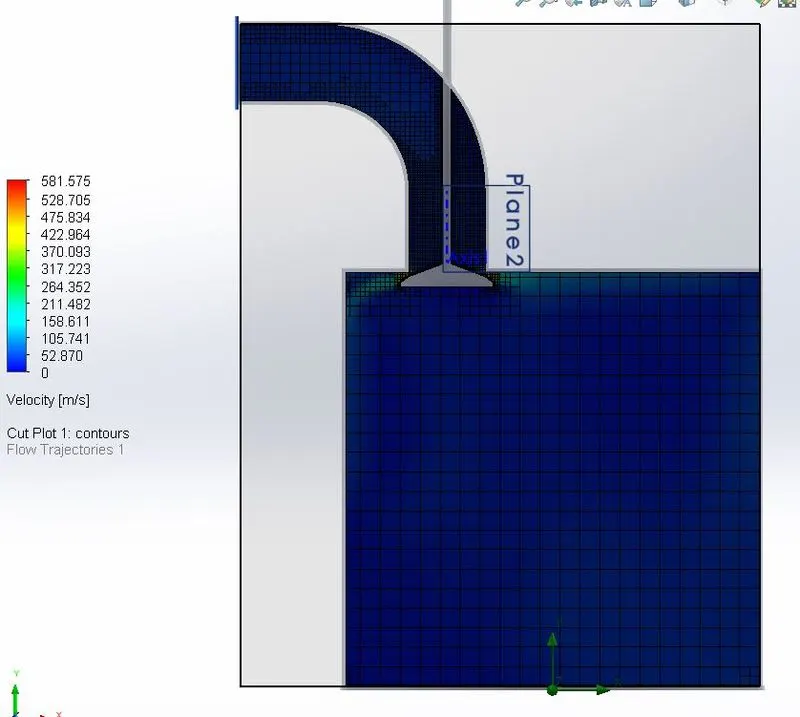
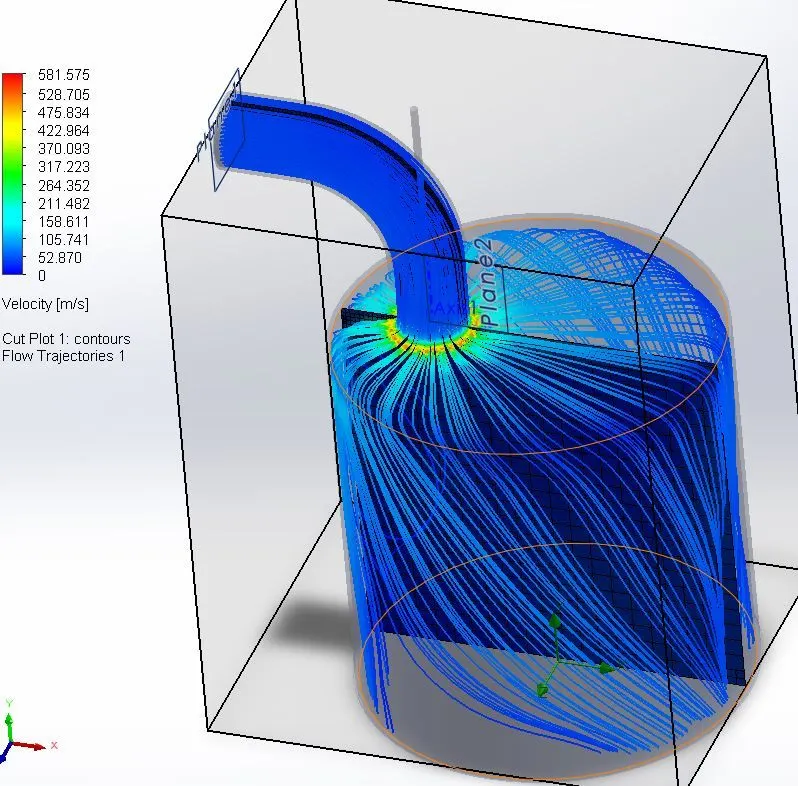
Baseline Velocity plot Baseline Flow Trajectories

Valve lift 2 mm:
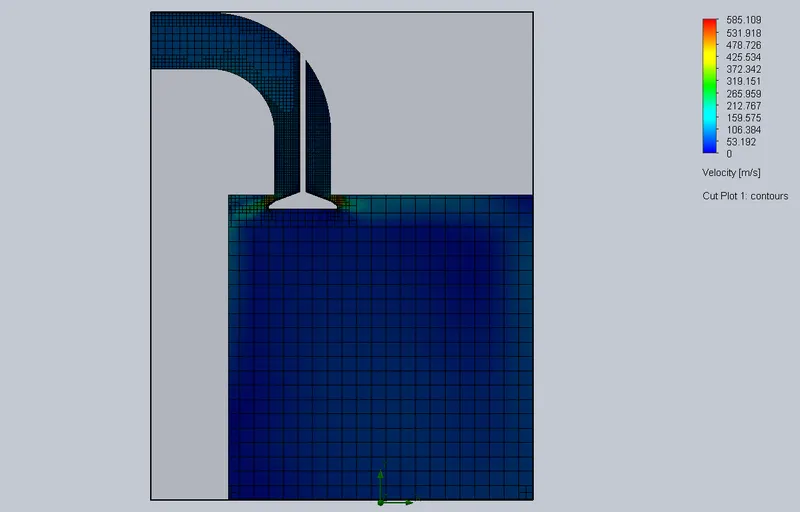
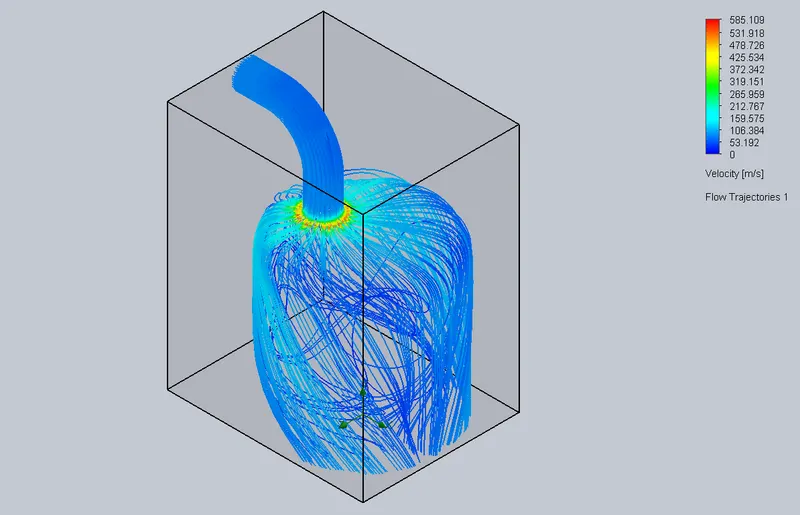
Velocity plot Flow Trajectories
Valve lift 3 mm:
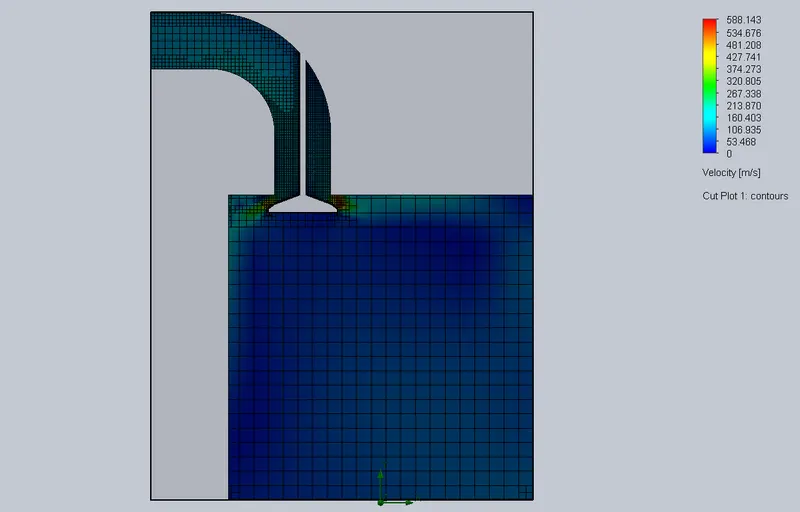
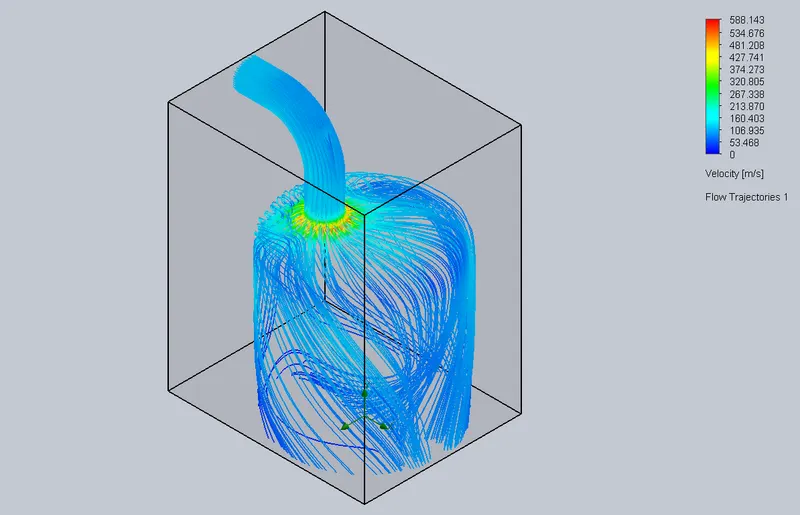
Velocity plot Flow Trajectories
Valve lift 4 mm:
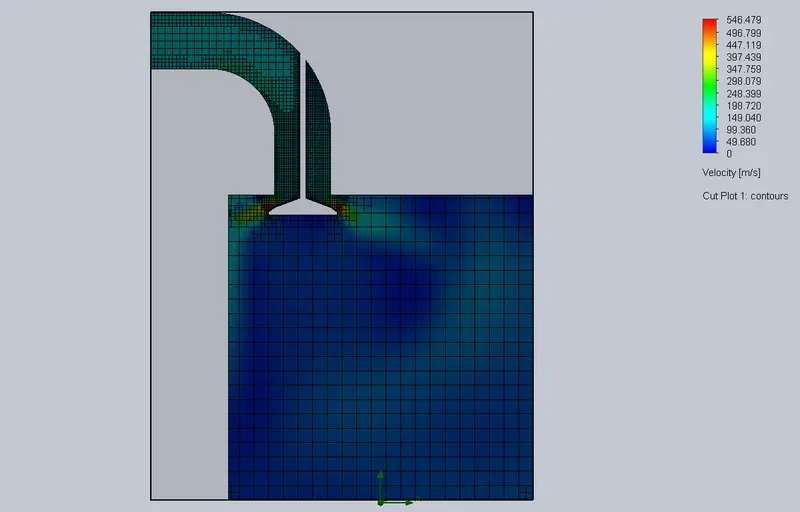
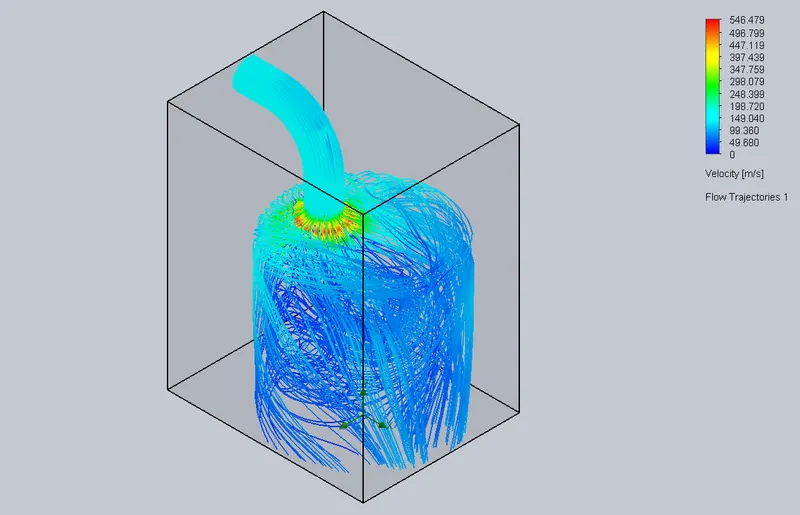
Velocity plot Flow Trajectories
Valve lift 5 mm:
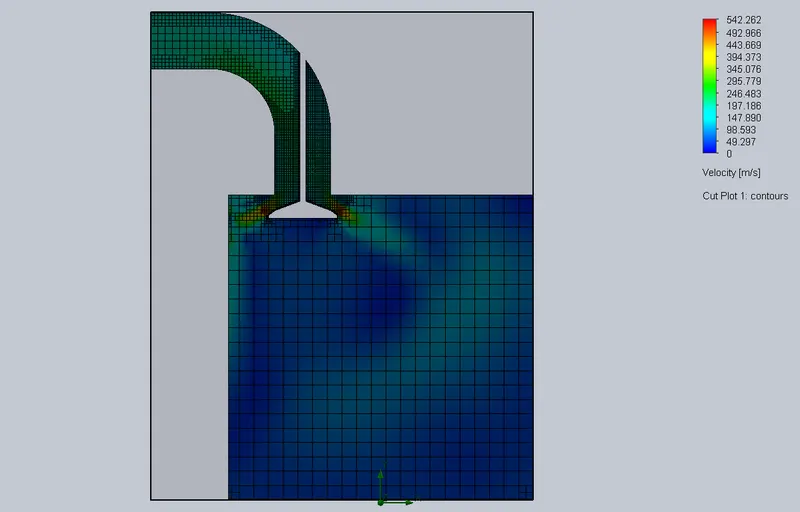
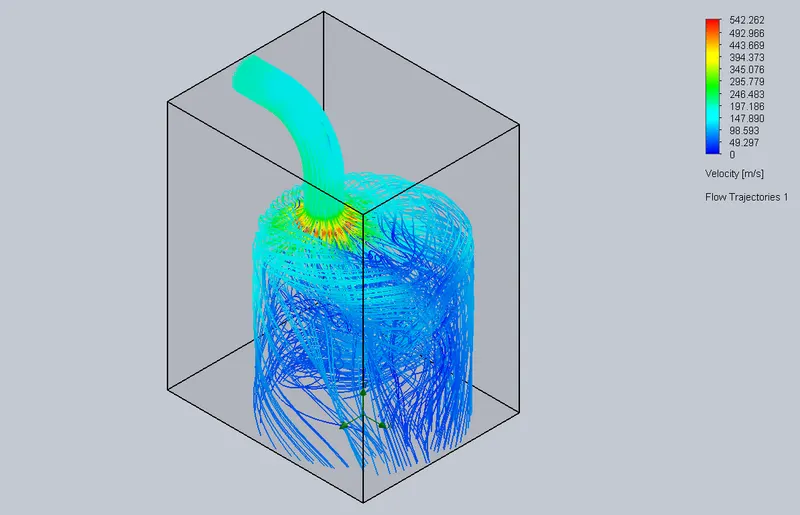
Velocity plot Flow Trajectories
Mass flow rate for the Valve lifts :
| Valve Lift (mm) | Mass flow rate (Kg/s) |
| 1 | -0.0498748773124828 |
| 2 | -0.0934050708089746 |
| 3 | -0.131825833922257 |
| 4 | -0.163341360822558 |
| 5 | -0.186536907906133 |
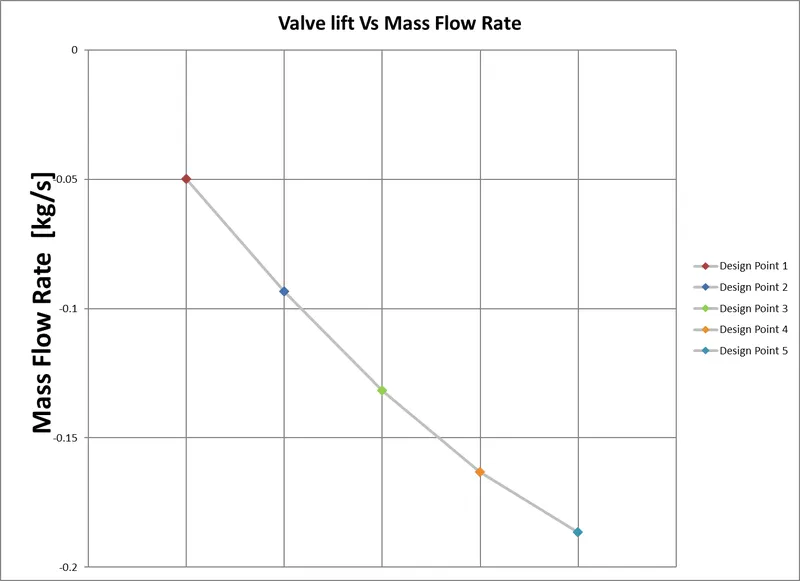
RESULTS AND OBSERVATIONS :
From the comparison of the velocity plots obtained from the study at varoius valve lift, it is found that the velocity increases with the increase in valve lift. And the mass flow rate reduces because the increase in lift causes an increase in inlet which in turn reduces the mass flow rate.