Modelling and simulation of flow through a flowbench
Aim: To create a 3D model of a flow bench and run flow analysis.
Objective :
- To perform Grid dependence test
- To study the effect of valve lift on mass flow rate
Introduction :
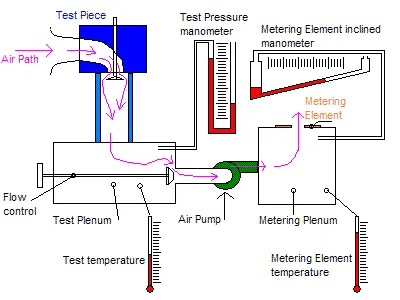
An airflow bench is a device used for testing the internal aerodynamic qualities of an engine component and is related to the more familiar wind tunnel.
It is used primarily for testing the intake and exhaust ports of cylinder heads of internal combustion engines. It is also used to test the flow capabilities of any component such as air filters, carburetors, manifolds, or any other part that is required to flow gas. A flow bench is one of the primary tools of high-performance engine builders, and porting cylinder heads would be strictly hit or miss without it.
A flow bench consists of an air pump of some sort, a metering element, pressure and temperature measuring instruments such as manometers, and various controls. The test piece is attached in series with the pump and measuring element and air is pumped through the whole system. Therefore, all the air passing through the metering element also passes through the test piece. Because the volume flow rate through the metering element is known and the flow through the test piece is the same, it is also known. The mass flow rate can be calculated using the known pressure and temperature data to calculate air densities and multiplying by the volume flow rate.
Procedure :
- First, create the cad model of the required pipe dimension and save the file
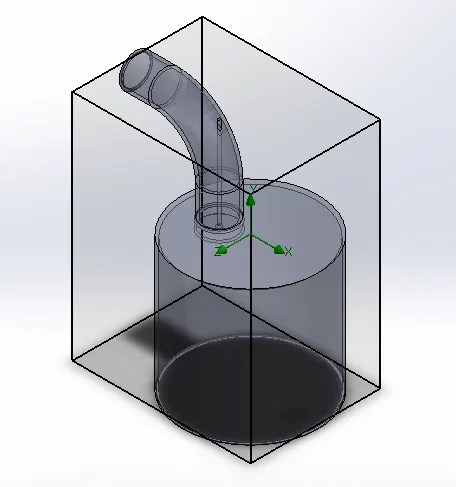
- Provide lids to the ends of the pipe using the ‘Create lids’ command in flow simulation.
- Once lids have been provided, provide the type of unit system, Analysis type- Internal in this case, Select the fluid – air in this case, Select flow type – Laminar and Turbulent in this case.
- Then provide appropriate mesh manually,
- Provide Boundary Conditions such as static pressure, real wall and inlet velocity. Here total Pressure at inlet – 2 bars and static pressure at cylinder lid – 1 bar is considered
- Similarly required create cut plots and XY plots for various locations to get the magnitude of velocity along the selected section.
- Now click on the Run button in the Flow simulation tab to perform the calculations.
- After this the results are obtained for a single study. In order to obtain the results for various cases parametric study should be performed. In this by giving necessary inputs and conditions, the results for various cases are obtained.
Grid dependency test : Performed at 0.05m valve lift
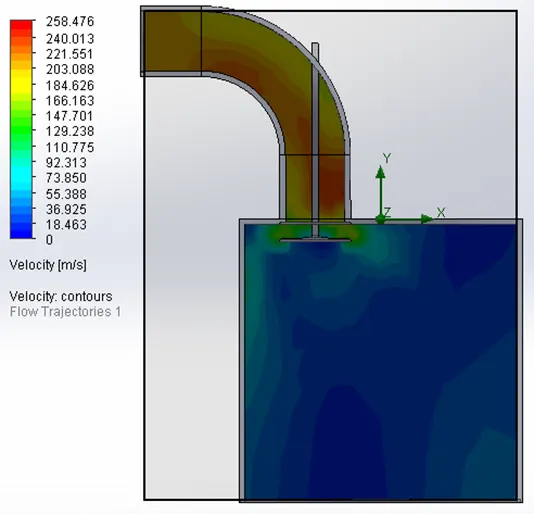
Grid level – 1:
Total cells: 1276
Fluid cells: 1276
Velocity – 45.6908 m/s
Mass flow rate : 6.61028e-07 kg/s
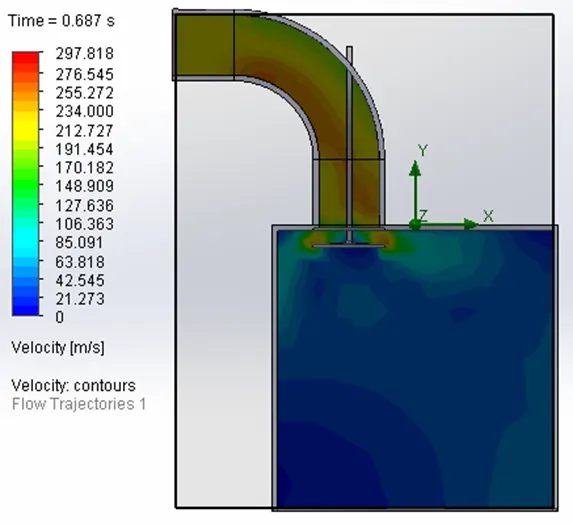
Grid level – 2:
Total cells : 2397
Fluid cells : 2397
Velocity – 54.7441 m/s
Mass flow rate : 6.19899e-05 kg/s
Grid level – 3:
Total cells : 4973
Fluid cells : 4973
Velocity – 54.8812 m/s
Mass flow rate : 2.92044e-07 kg/s
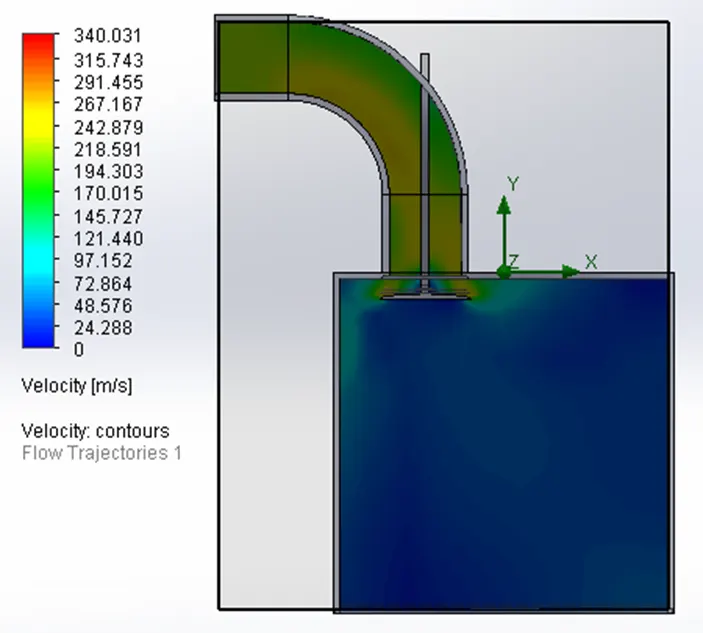
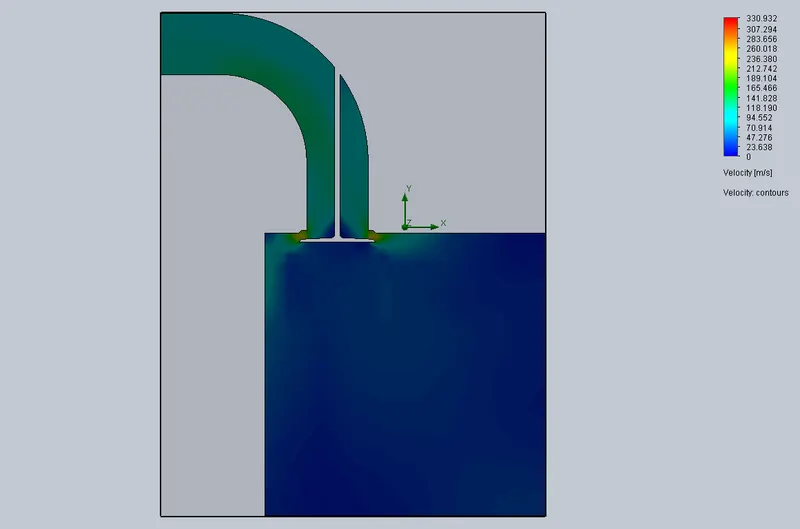
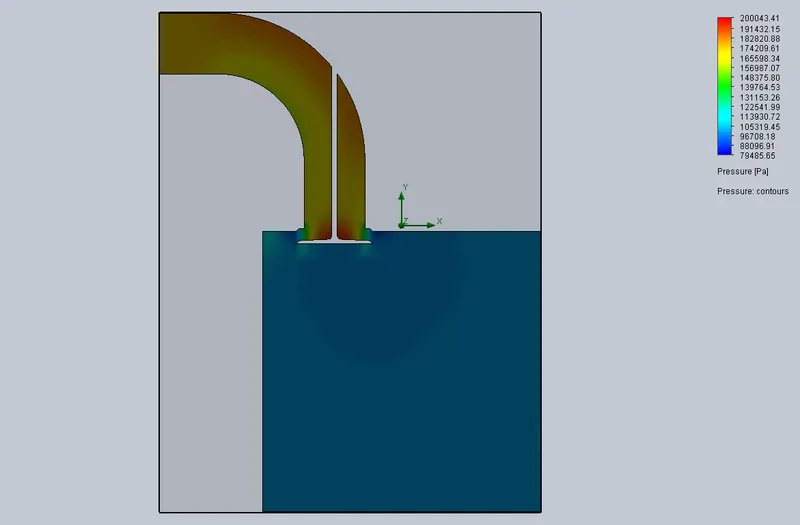
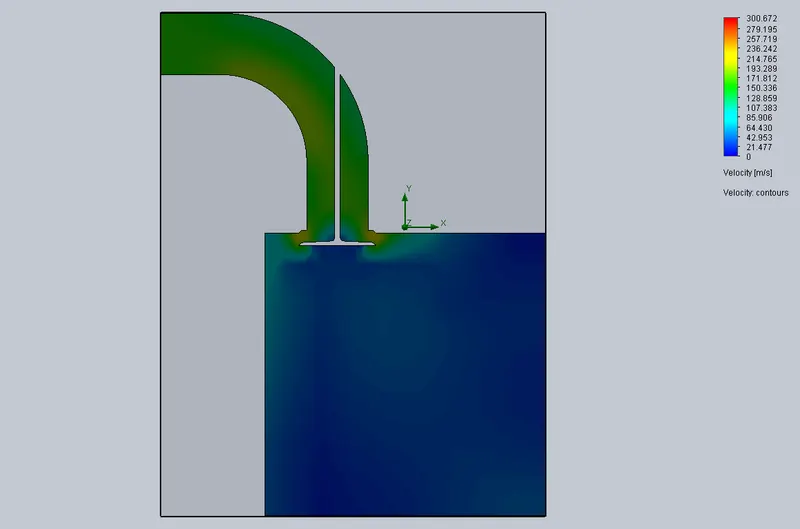
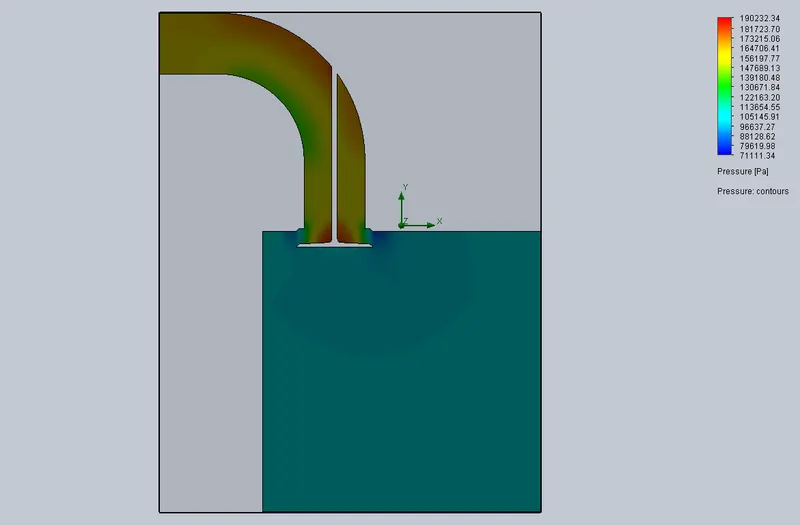
As we can see the value of velocity increases with an increase in the level of mesh. As seen in the cut plot for level 1, it is not able to capture the high velocities just above the valve due to its more coarse grains but, on the other hand, due to increased refinement in level 2 and level 3, total cells and fluid cells contacting solid increases and hence red color emerge which represents high velocity near the valve.
Parametric Study :
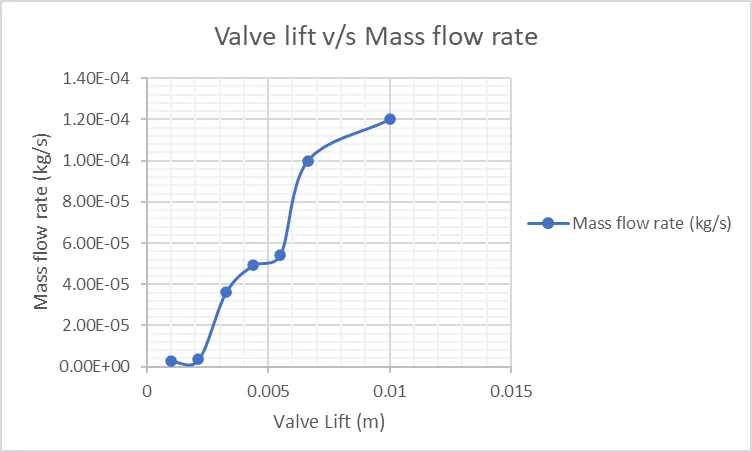
The analysis is done on the basis of the valve lift. In this project the considered valve lift values are : 0.001 m, 0.002125 m, 0.00325 m, 0.004375 m, 0.0055 m, 0.006625 m and 0.01 m.
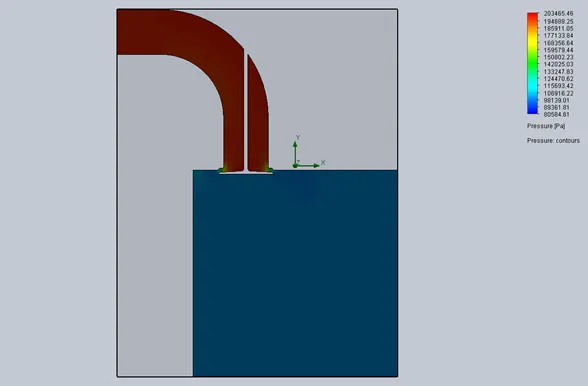
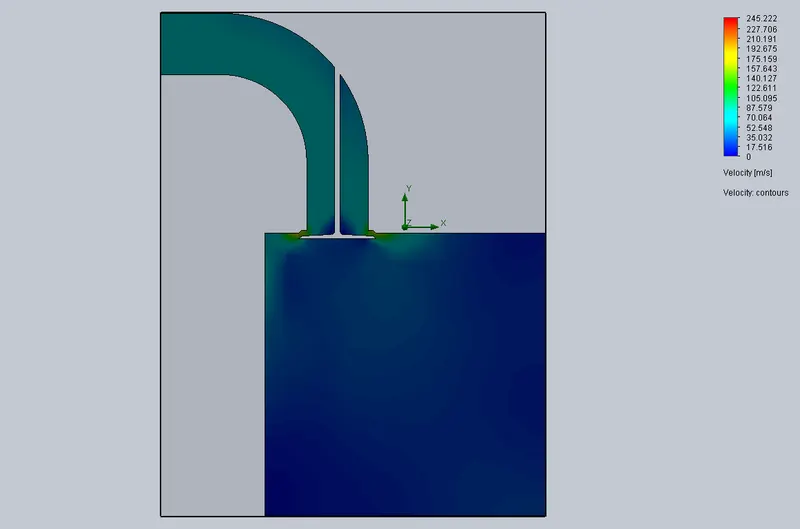
- Design point 1 – 0.001 m:
Pressure Cut-plot
Velocity Cut-plot :
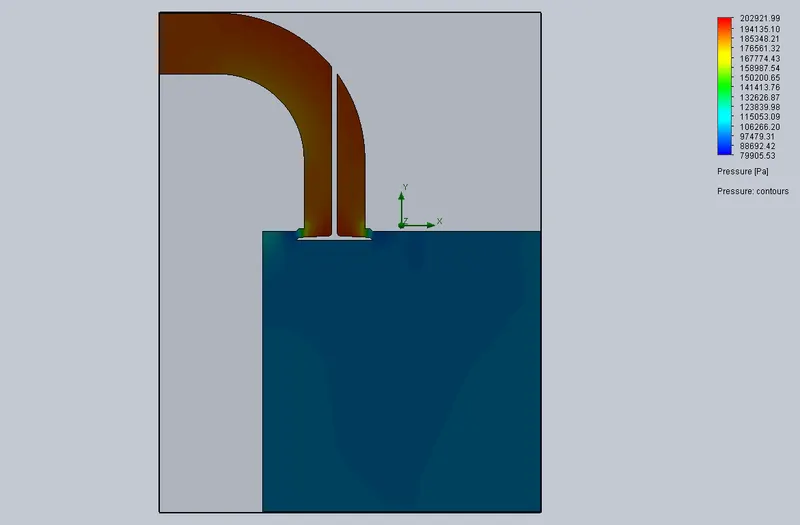
- Design point 2 – 0.002125 m:
Pressure Cut-plot :
Velocity Cut-plot :
- Design point 3 – 0.00325 m:
Pressure Cut-plot :
Velocity Cut-plot :
- Design point 4 – 0.004375 m:
Pressure Cut-plot :
Velocity Cut-plot :
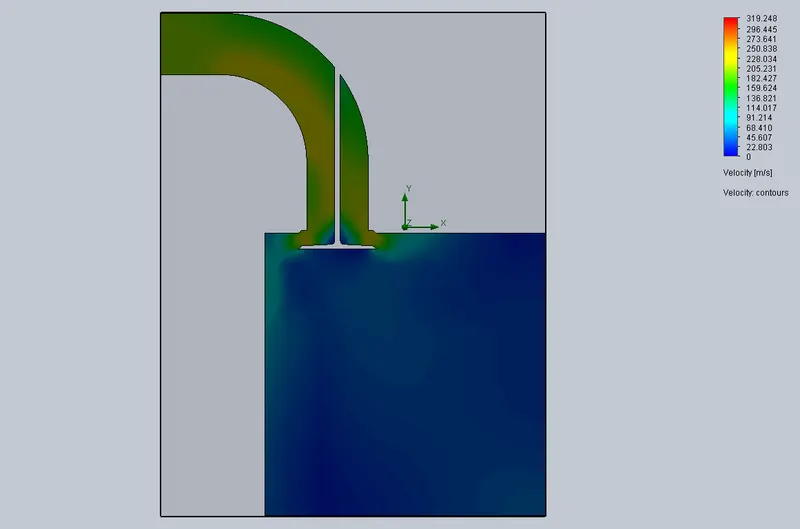
- Design point 5 – 0.0055 m:
Pressure Cut-plot :
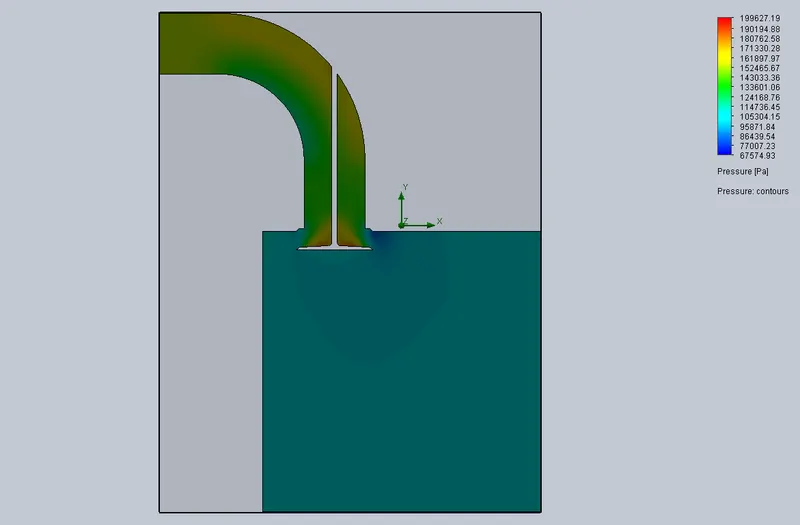
Velocity Cut-plot :
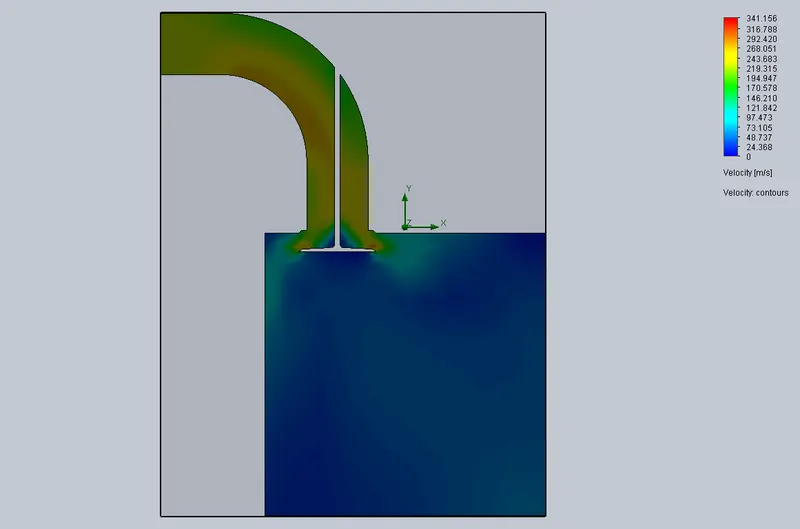
- Design point 6 – 0.006625 m:
Pressure Cut-plot :
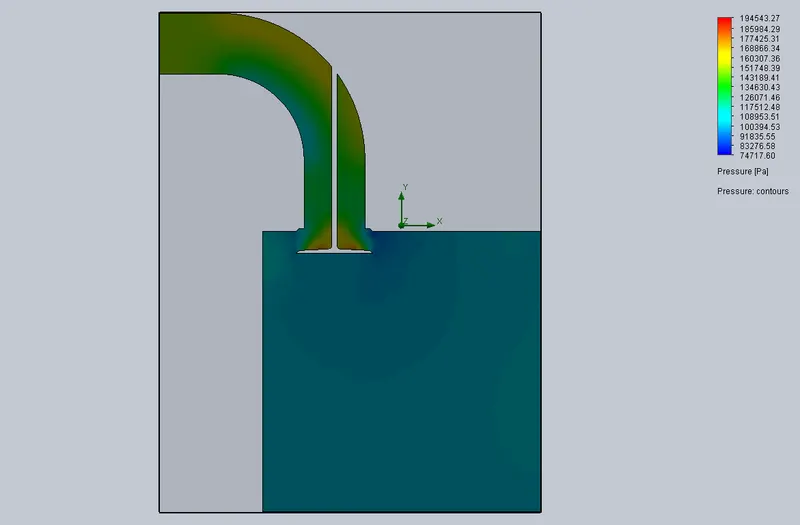
Velocity Cut-plot :
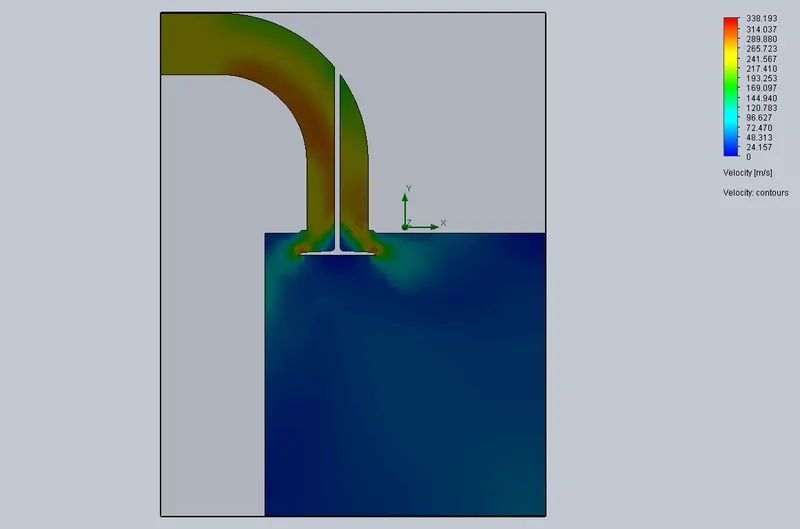
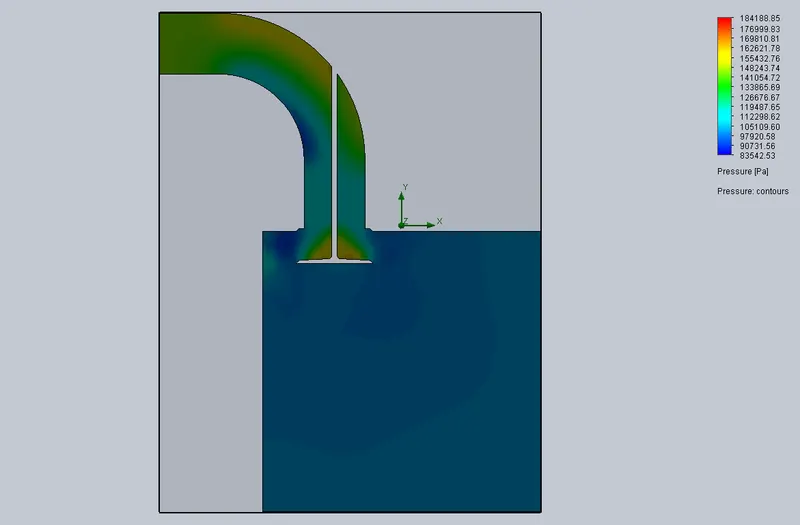
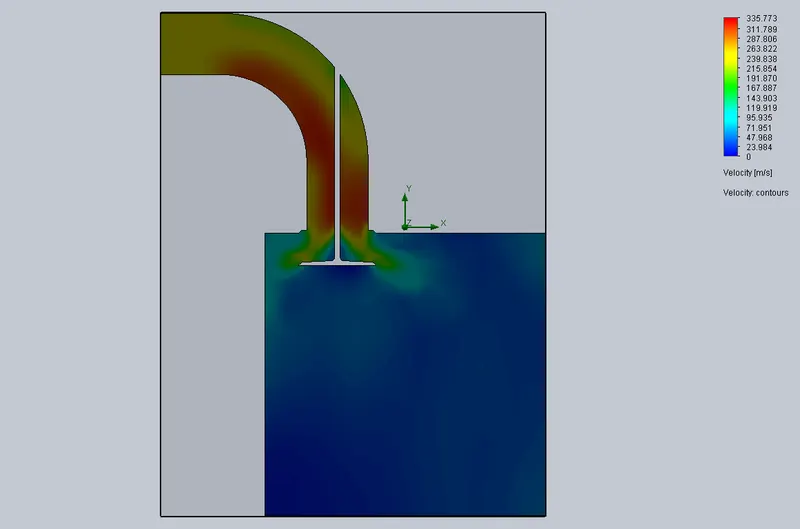
- Design point 7 – 0.01 m:
Pressure Cut-plot :
Velocity Cut-plot :
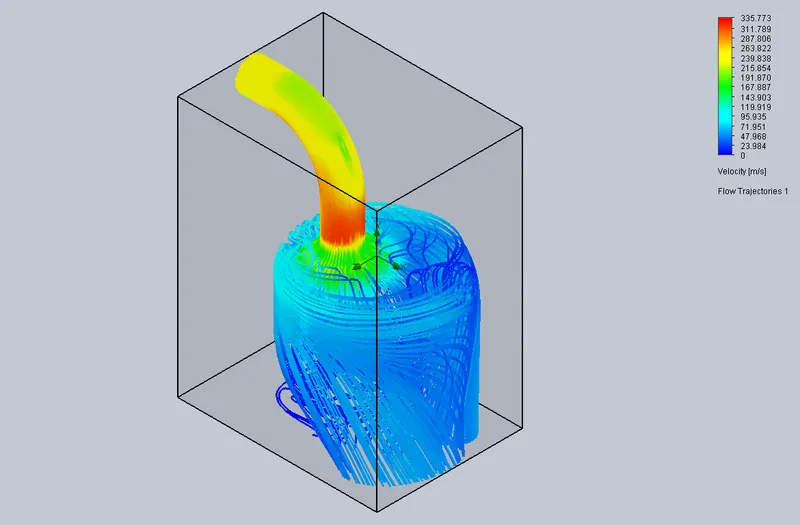
Flow Trajectory :
Following shows the plot of valve lift v/s mass flowrate obtained:
Inference :
- As seen from the plots it can be inferred that with the increase in the level of refinement the accuracy of the model increases and is able to give much more details due to finer grains. But the computation cost is also increased.
- The mass flowrate of air increase with increase in the valve lift and becomes constant after a certain lift. Also the swirl and tumble effects tend to decrease.
- The velocity of the flow increases with increase in the valve lift upto a certain lift but then it tends to decrease as the pressure difference gets reduced.