Modelling and simulation of flow through a flowbench
AIM:
To perform the flow simulation through a flow bench by modeling the geometry and obtaining a lift vs mass flow rate plot.
- Grid dependence test
For three grids run the simulation at a particular valve lift and explain the result.
- Effect of valve lift on mass flow rate
After deciding the best grid, run a parametric sweep to show the effect of valve lift on mass flow rate.
Input Parameters :
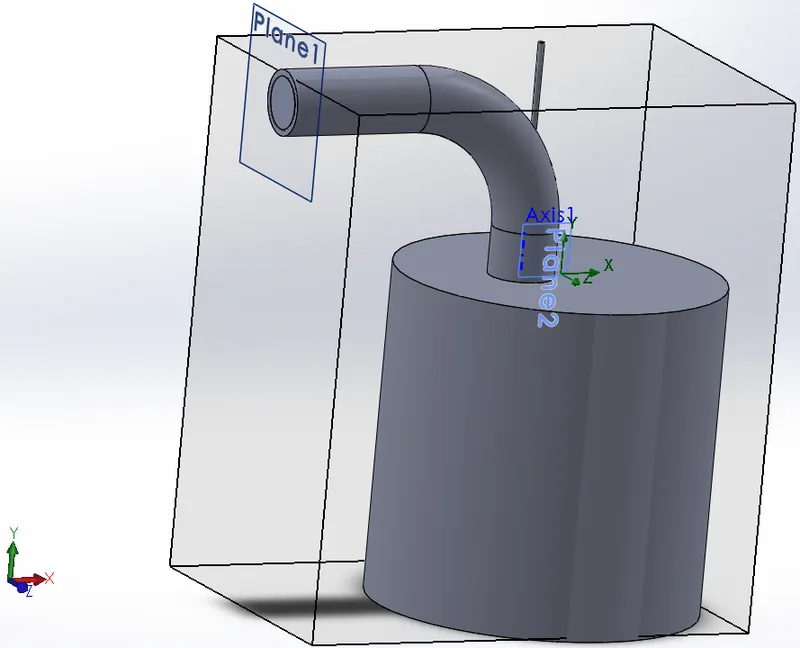
External diameter of the cylinder: 0.1m
External diameter of inlet port: 0.02m
Shell thickness: 0.002m
Intel Total Pressure: 202650 Pa (at 293.2 k)
Outlet Static Pressure: 101325 Pa (at 293.2 k)
3D Model :
Grid Dependency Test :
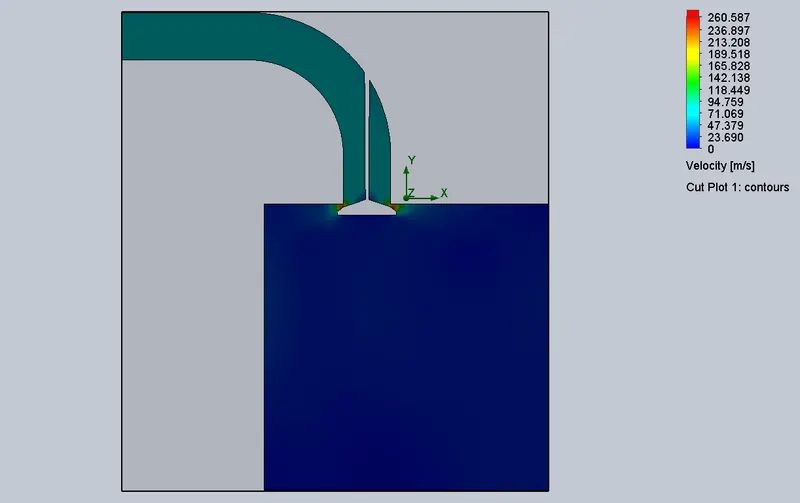
Considering the Valve Lift at 0.001m
Case 1: Velocity plot in automatic Global Mesh 3, Local Mesh 3
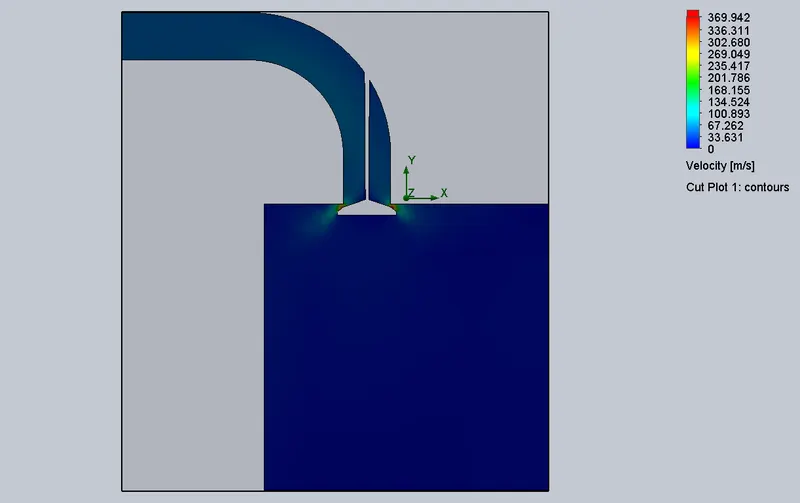
Case 2: Velocity plot in automatic Global Mesh 4, Local Mesh 4
Case 3: Velocity plot in automatic Global Mesh 5, Local Mesh 5
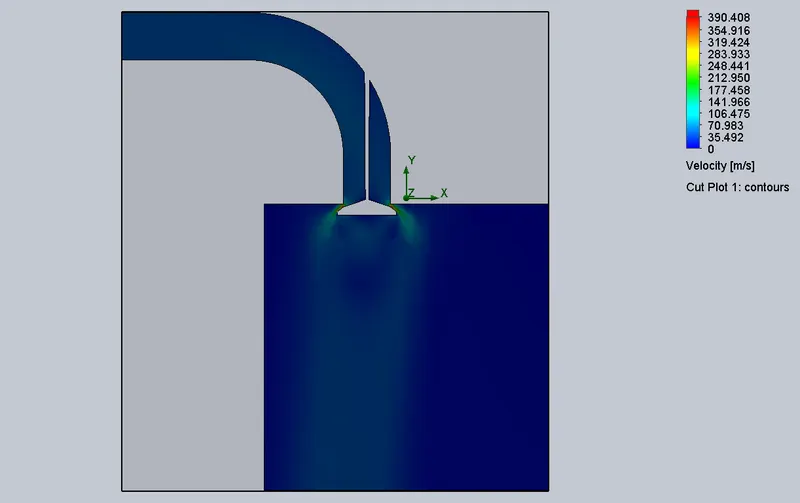
On increasing the level of the grid we are getting a more accurate and smoother-looking profile. Velocity is showing an increasing trend as the Level of Mesh is increased.
Valve Lift Parametric Study:
This test is carried out in order to visualize the Velocity and Pressure Contour for different valve lifts.
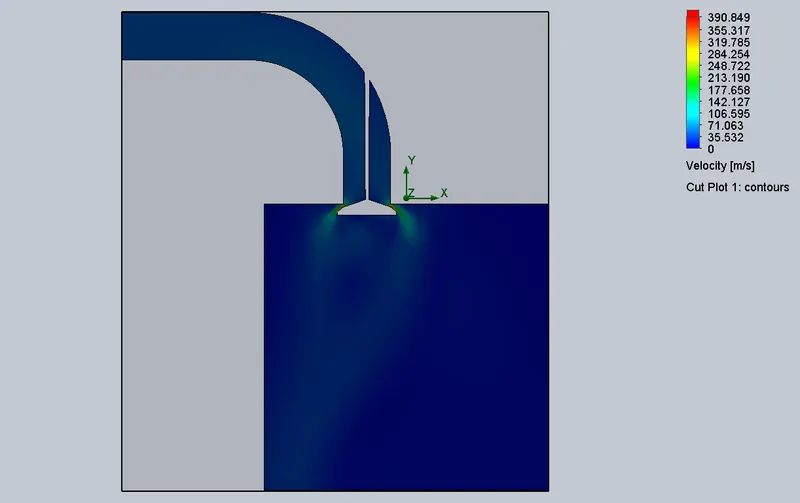
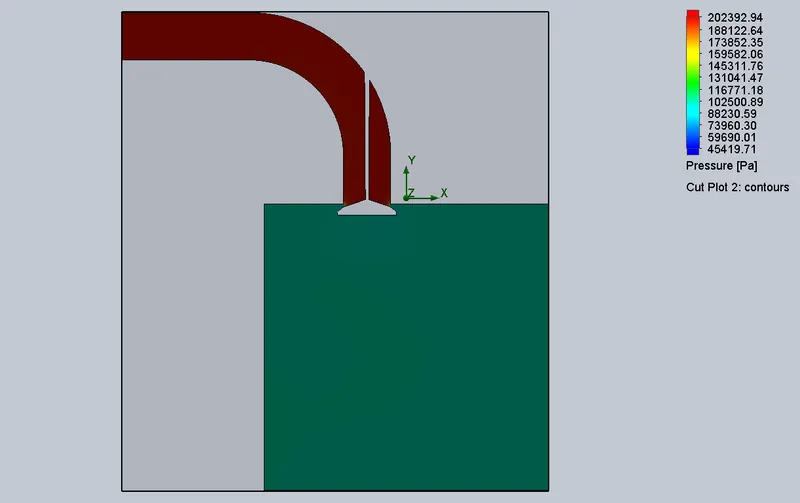
Case 1: ( Valve Lift: 0.001 m )
Velocity Contour
Pressure Contour
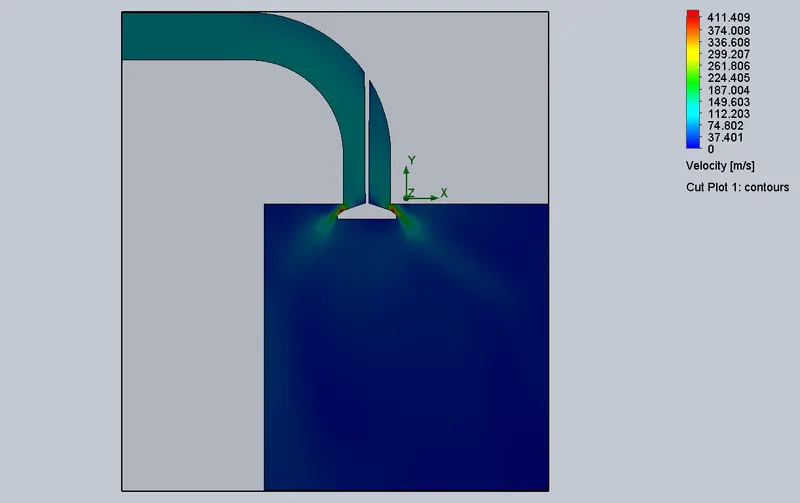
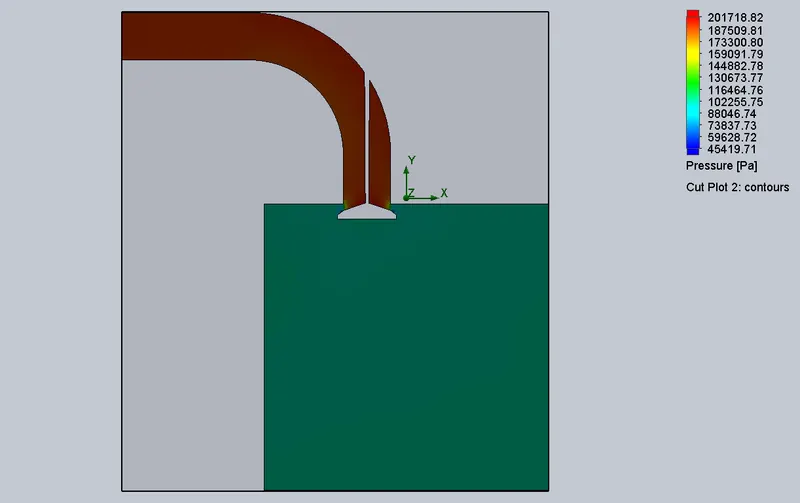
Case 2: ( Valve Lift: 0.002166 m )
Velocity Contour
Pressure Contour
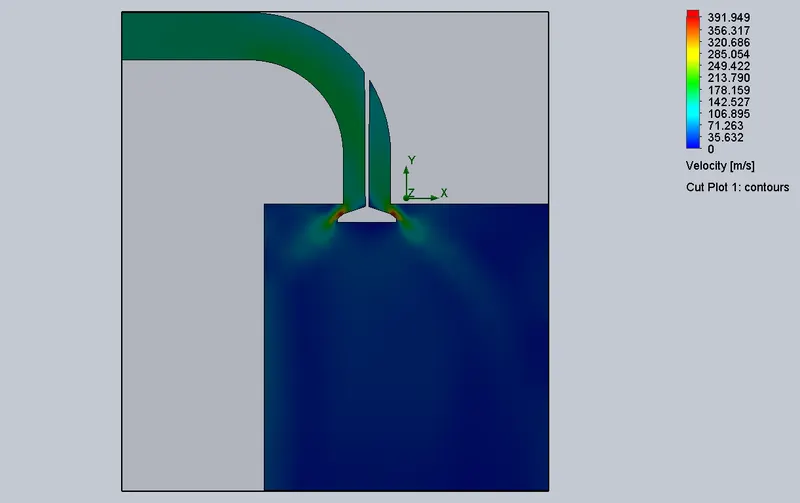
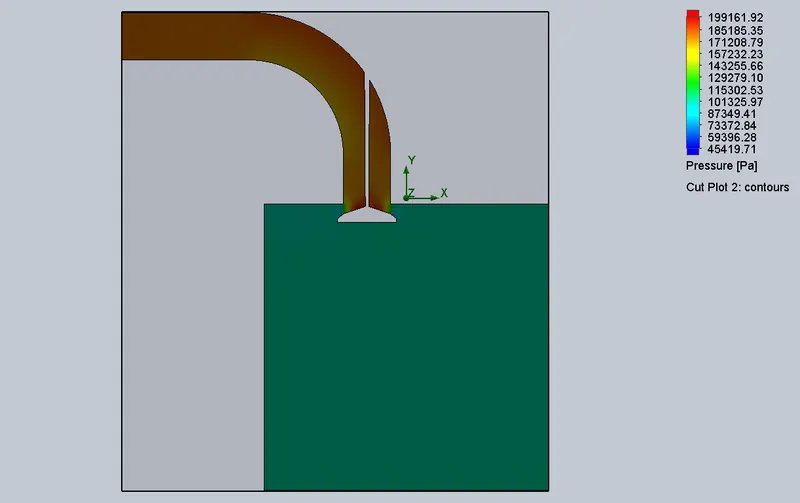
Case 3: ( Valve Lift: 0.0033 m )
Velocity Contour
Pressure Contour
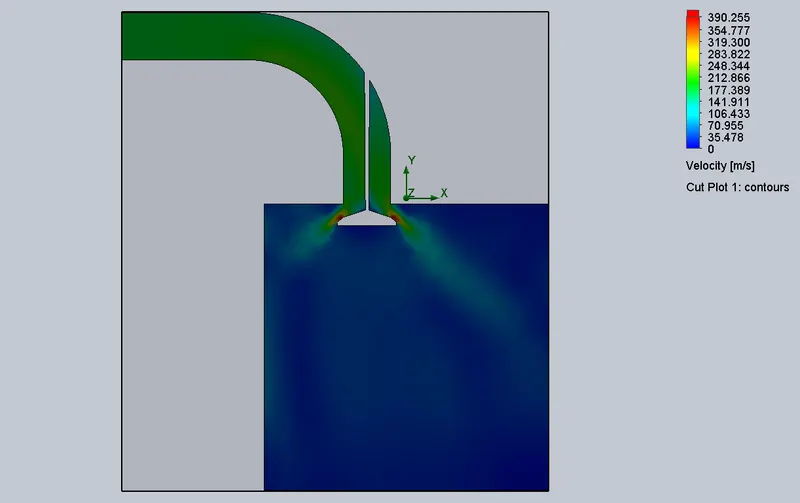
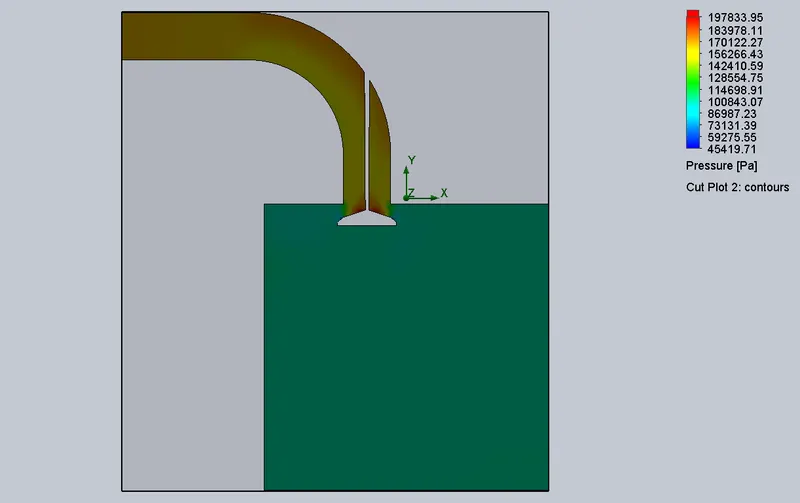
Case 4: ( Valve Lift: 0.0045 m )
Velocity Contour
Pressure Contour
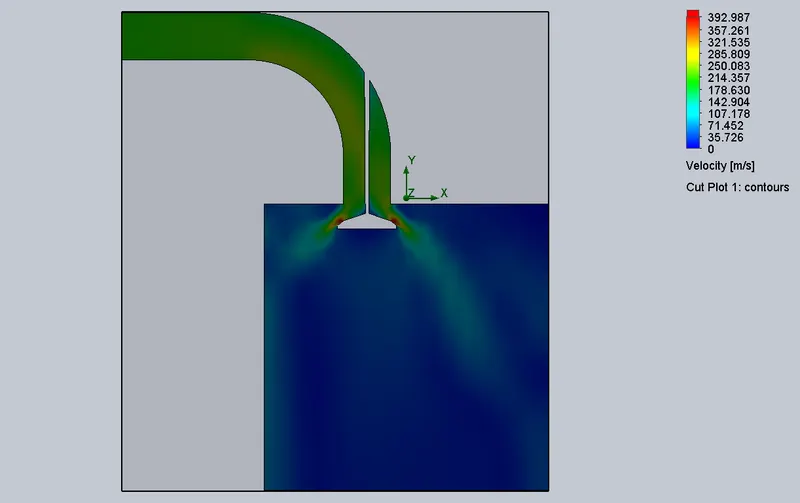
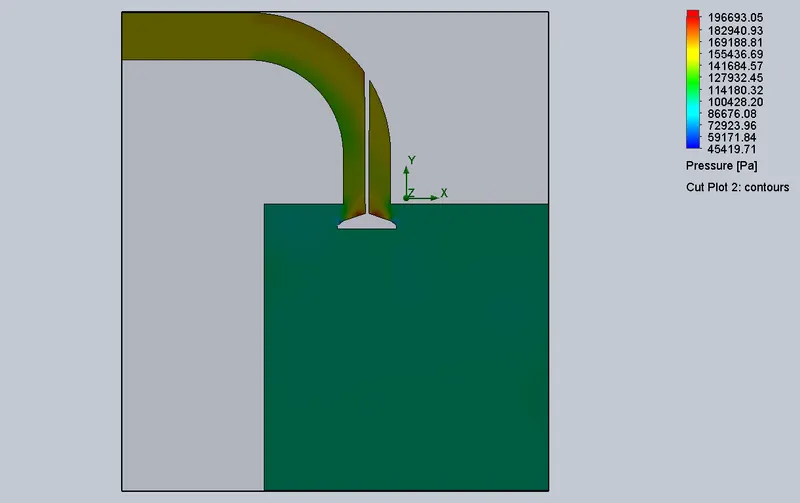
Case 5: ( Valve Lift: 0.00566 m )
Velocity Contour
Pressure Contour
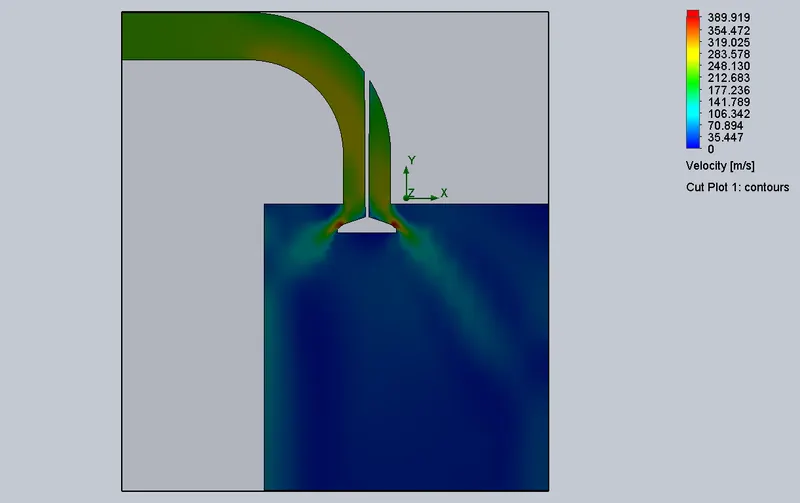
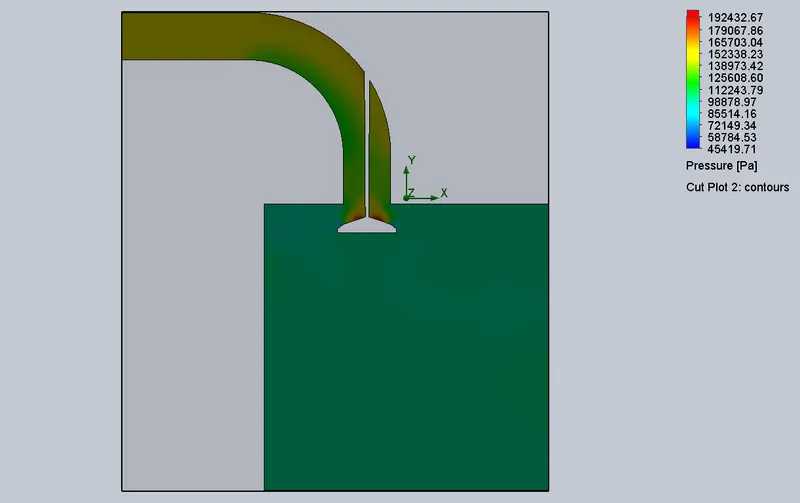
Case 6: ( Valve Lift: 0.006833 m )
Velocity Contour
Pressure Contour
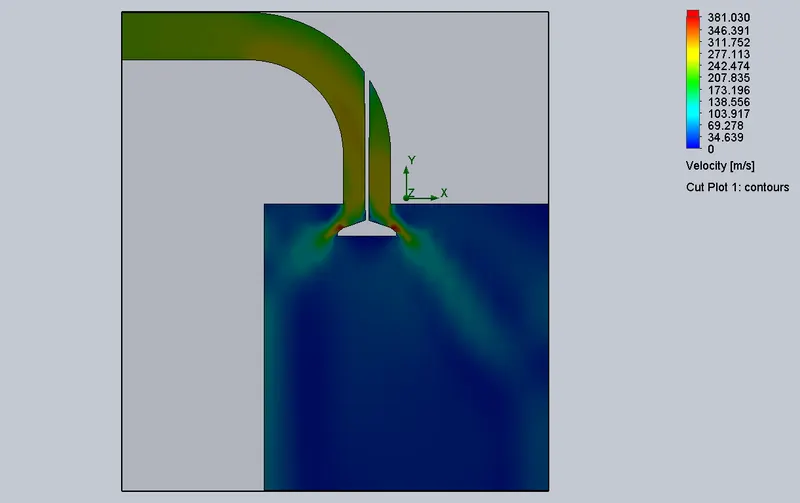
Case 7: ( Valve Lift: 0.008 m )
Velocity Contour
Pressure Contour
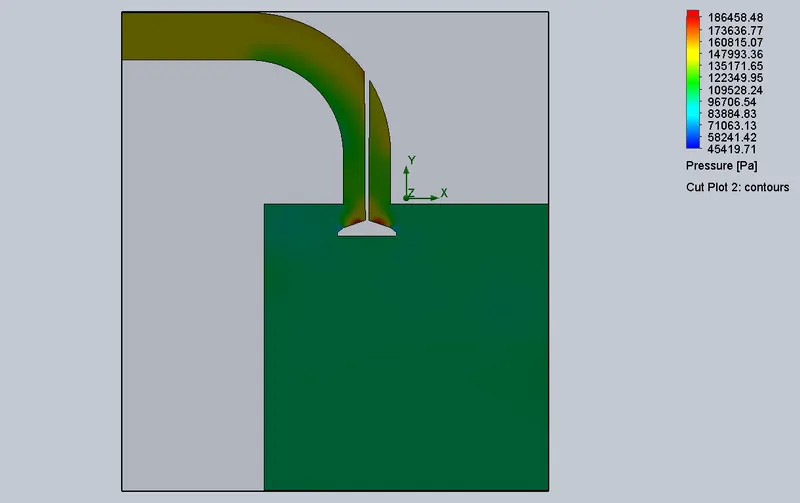
As the Valve is opened gradually with Valve Lift increasing, the flow starts developing, the Velocity of the fluid increases and the Pressure goes on decreasing.
Flow Trajectory:
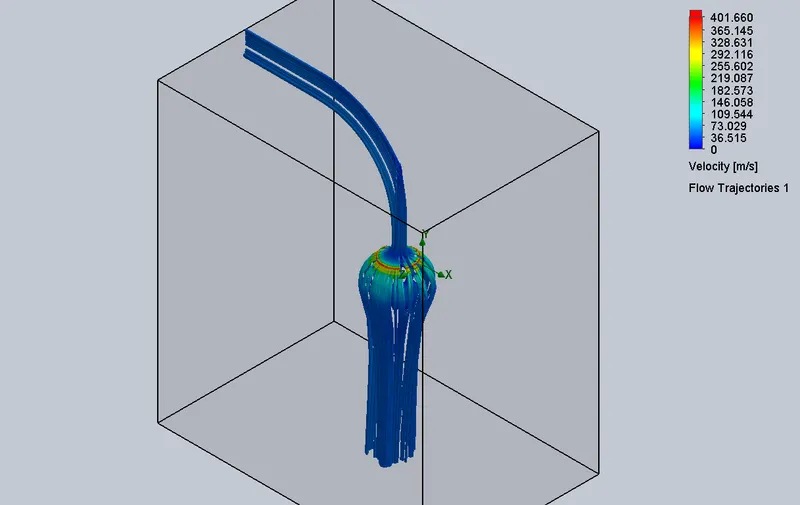
Flow Trajectory is introduced to visualize the flow and Swirl inside the cylinder.
Velocity plot at Valve Lift = 0.001 m (150 points)
Velocity plot at Valve Lift = 0.008 m (150 points)
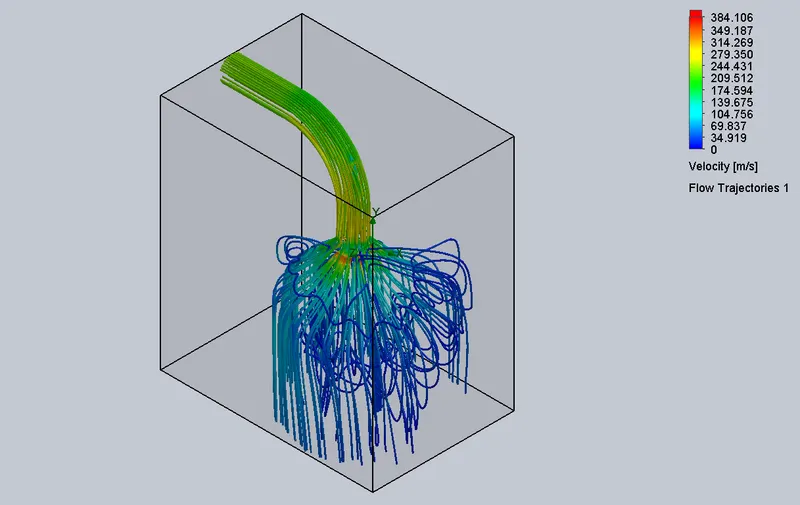
Observing the Flow Trajectories it is evident that as Valve Lift is increased the flow lines get more chaotic with increasing velocity.
Mass Flow Rate for Design Points:

Mass Flow Rate is treated as negative whenever it leaves the domain.
Surface goals of Mass Flow Rate:
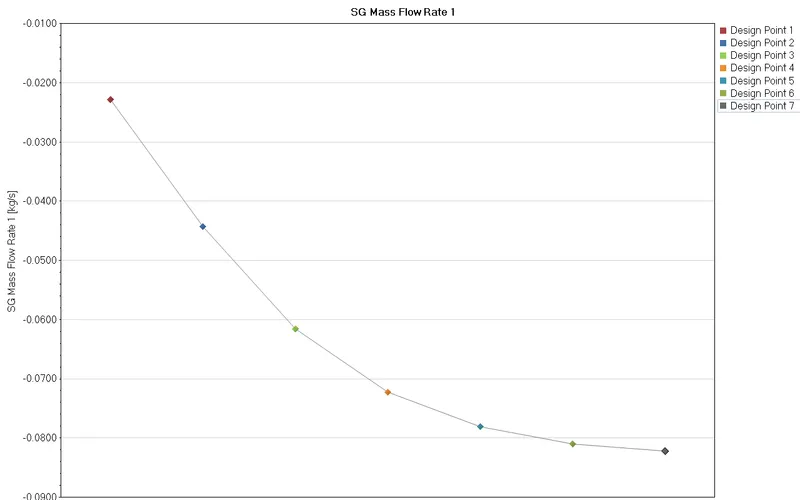
INFERENCE:
The Mass Flow Rate increases with the increase in Valve Lift.