Modelling and simulation of flow through a flowbench
Aim : Grid dependence test and valve lift study in flowbench
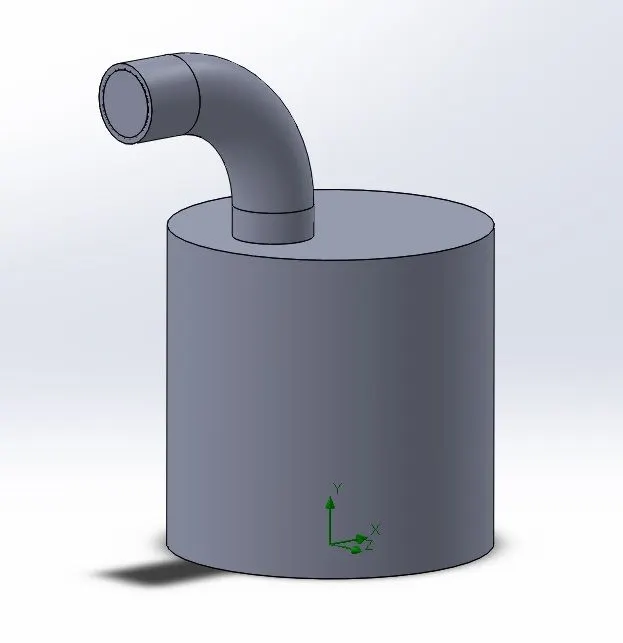
Flowbench : An air flow bench is a device used for testing the internal aerodynamic qualities of an engine component, usually valves. In this project we are studying an inlet valve.
(Arbitrary dimensions have been taken for design of flowbench as our main concern here is to perform parametric study on valve lift and study the effects of valve lift on mass flow rate)
Flowbench geometry :
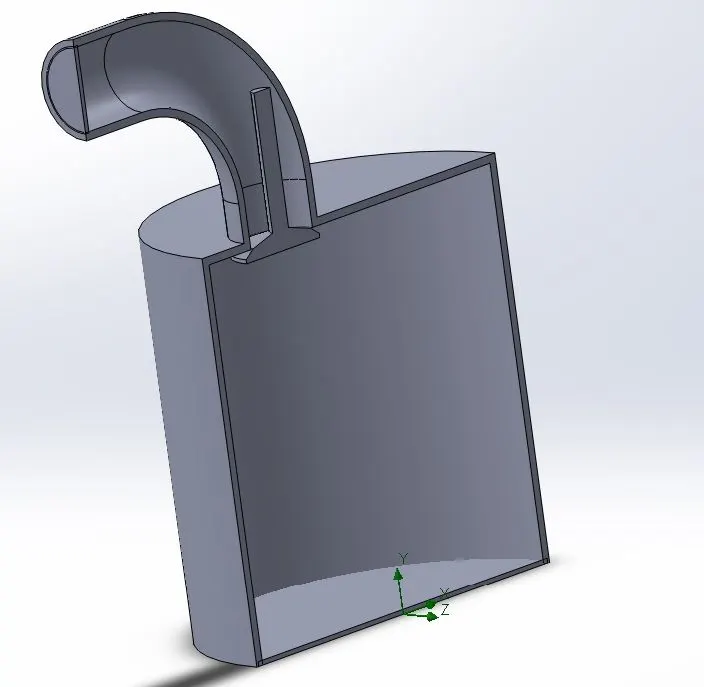
Cut section view :
Case Setup :
First we add lids to both open ends
Using wizard we input all the conditions we need such as units, fluid type etc which are mostly default for this study
Then on inlet we apply Total pressure as 2.2 bar and at outlet Static pressure as 1 bar (these vaues are again arbitrary and any values could be used for analysis)
insert velocity cut plot and add mass flow rate in goals.
Then we run a baseline simulation
Now we start a new parametric study by right clicking on our project.
Select dimension as input parameter and mark the distance between valve and cylinder opening as the study parameter.
Then we give a max and min value to valve lift and the number of divisions in between. For this analysis i have taken 10 values from 0.002m to 0.008m of valve lift.
Add cut plot and mass flow rate in output parameters.
Go to scenarios and click on run.
The above step was done for global mesh definition of 5,6,7.
The results are as follows :
For mesh def 5 :-

For mesh def 6 :-

For mesh def 7 :-

From this we can observe that although the values for mass flow rate are changing, the change is almost negligible from mesh def 6 to mesh def 7. This is what the grid dependency test is used for. To find a point of mesh refinement after which more refinement will not cause any changes in the results obtained. We need to find the balance between maximum mesh quality and minimum solver time. In this case, mesh def 7 will give most accurate results as compared to others.
Results of analysis with mesh definition 7 at all 10 design points :
Valve lift : 0.002m
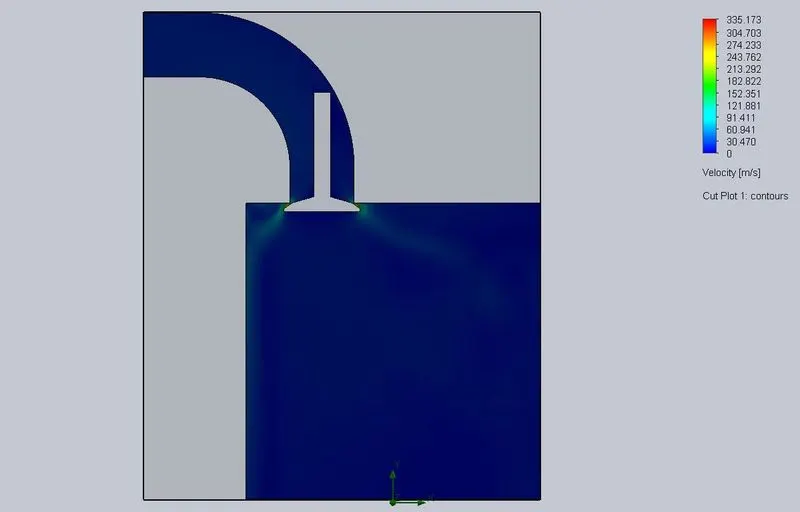
Valve lift : 0.00266666667m
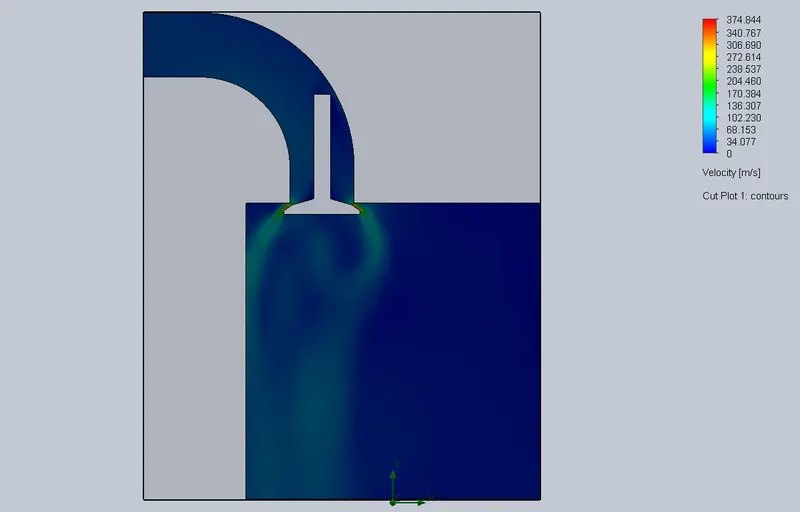
Vlave lift : 0.00266666667m
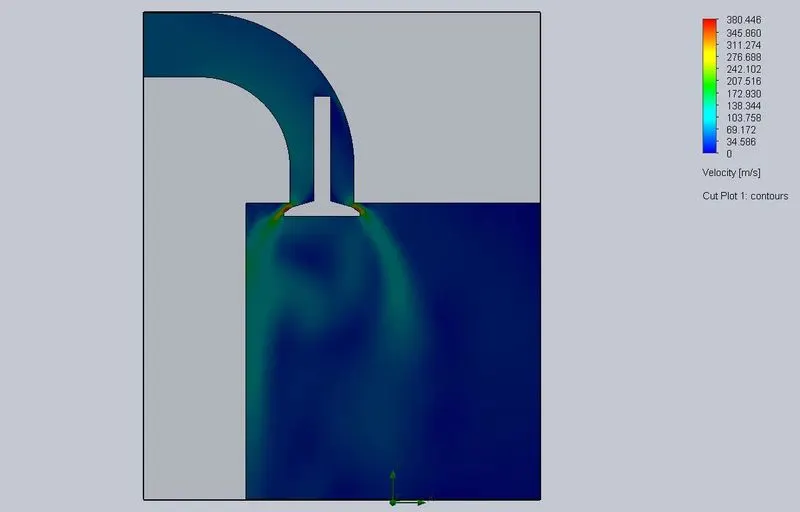
Valve lift : 0.004m
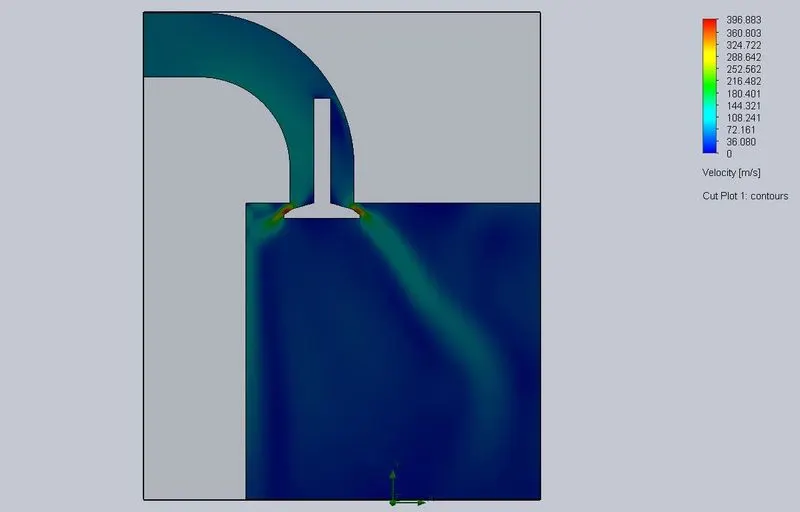
Valve lift : 0.00466666667m
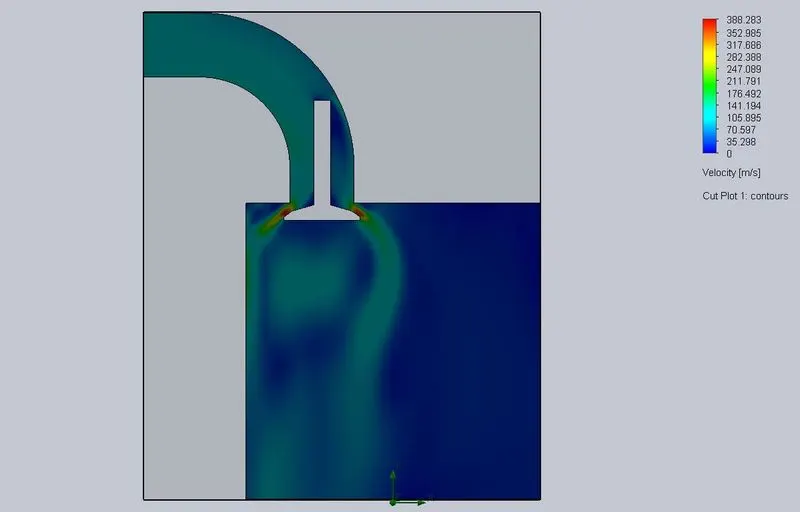
Valve lift : 0.00533333333m
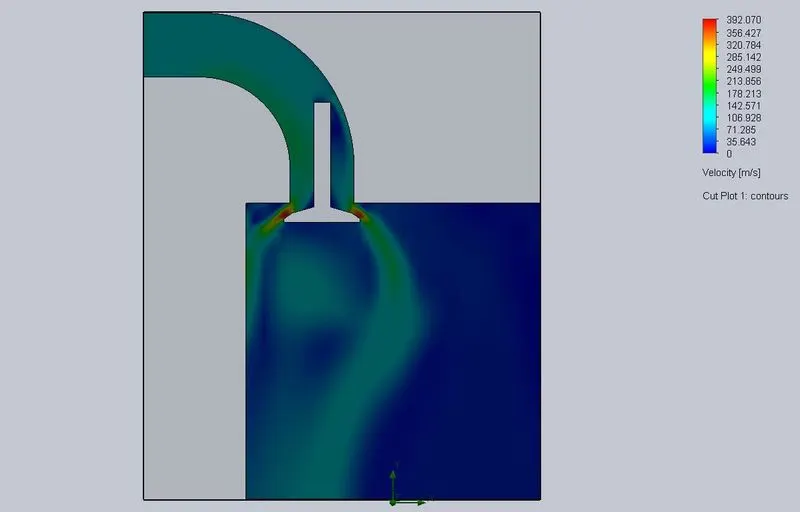
Valve lift : 0.006m
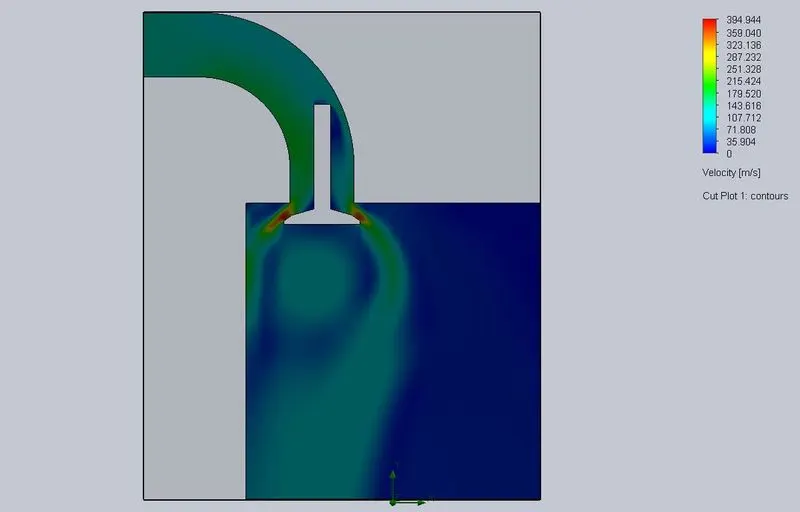
Valve lift : 0.00666666667m
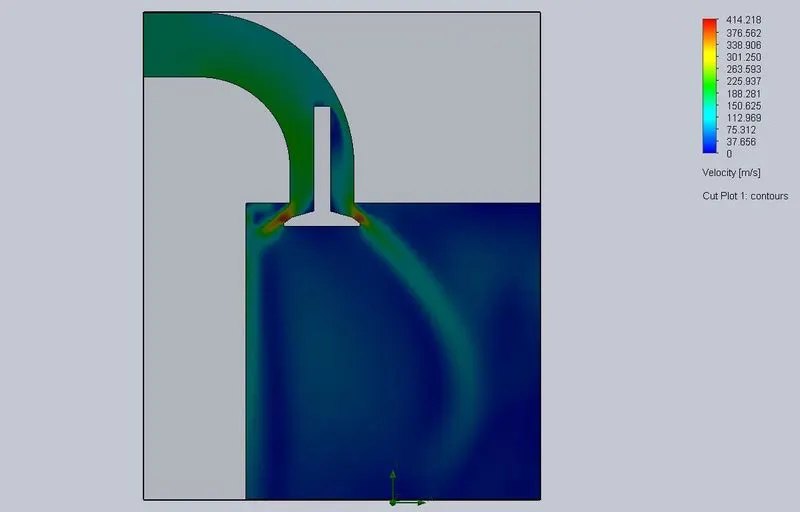
Valve lift : 0.00733333333m
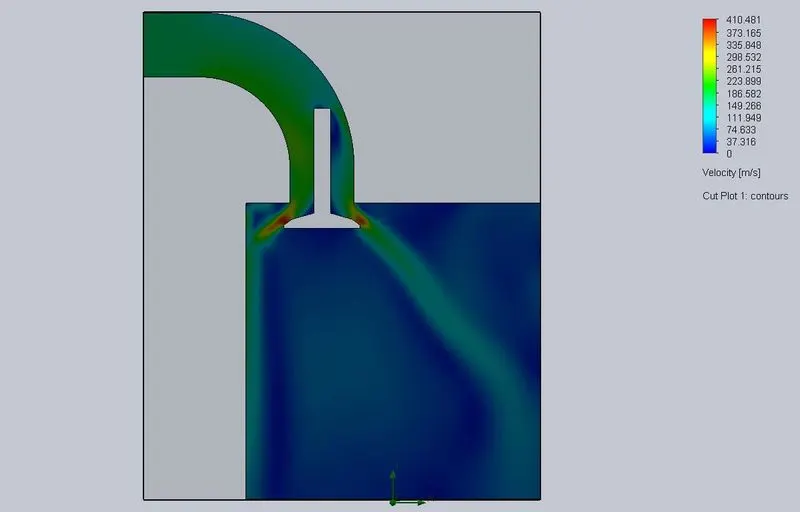
Valve lift : 0.008m
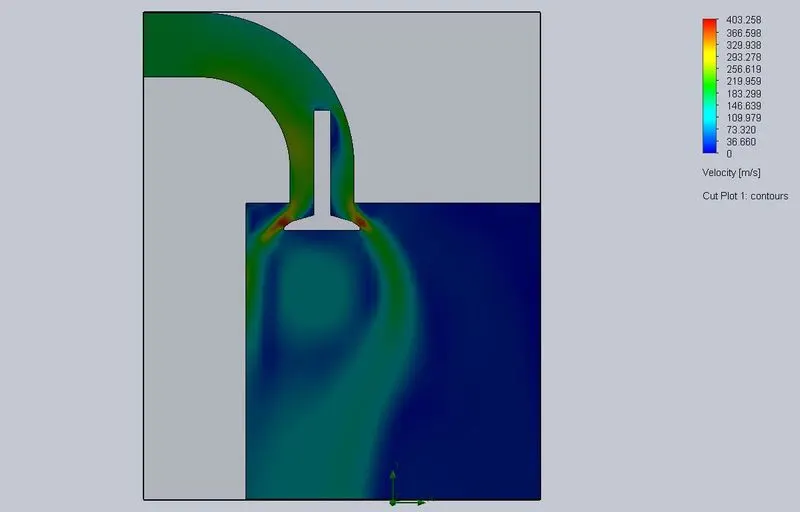
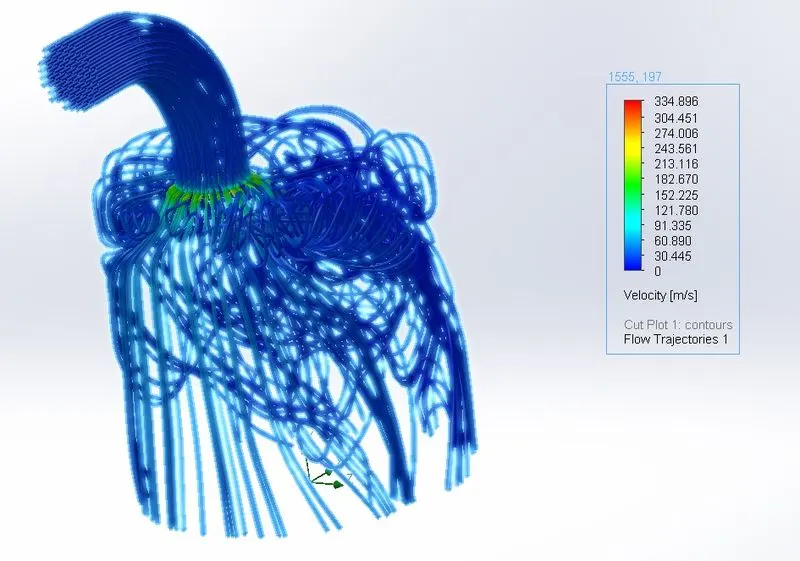
We can also study the flow trajectories to check swirl of the fluid inside :
Now for our analysis, taking the results of global mesh def 7, a plot is created between mass flow rate and valve lift :
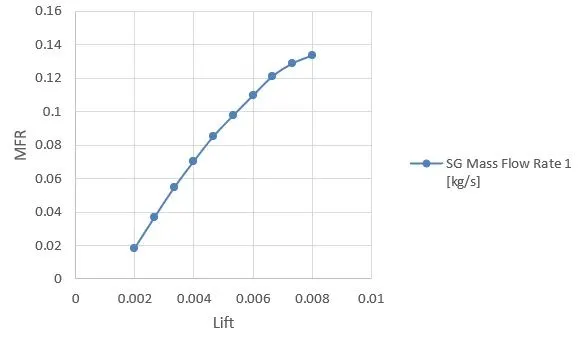
From this graph we can easily observe that as the valve lift increases, the mass flow rate also increases.