Modelling and simulation of flow through a flowbench
Aim :
To create a 3D model of a flow bench and run the grid dependency test run flow analysis and obtain a plot of lift vs mass flow rate and find the effect of valve lift on the mass flow rate.
Introduction :
The air flow bench can give a wealth of data about the characteristics of a cylinder head or whatever part is tested. The result of main interest is bulk flow. It is the volume of air that flows through the port in a given time. Expressed in cubic feet per minute or cubic meters per second/minute.
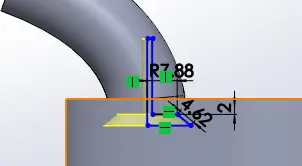
Value lift can be expressed as an actual dimension in decimal inches or mm. It can also be specified as a ratio between a characteristic diameter and the lift L/D. Most often used is the valve head diameter. Normally engines have an L/D ratio from 0 up to a maximum of 0.35. For example, a 1-inch-diameter (25 mm) valve would be lifted a maximum of 0.350 inch. During flow testing the valve would be set at L/D 0.05 0.1 0.15 0.2 0.25 0.3 and readings taken successively. This allows the comparison of efficiencies of ports with other valve sizes, as the valve lift is proportional rather than absolute. For comparison with tests by others the characteristic diameter used to determine lift must be the same.
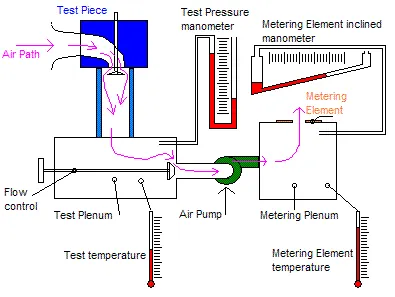
An air flow bench is a device used for testing the internal aeodynamics qualities of an engine component and is related to the more familiar wind tunnel.
It is used primarily for testing the intake and exhaust ports of cylinder head of IC engine . It is also used to test the flow capabilities of any component such as air filters, carburetors, manifolds or any other part that is required to flow gas. A flow bench is one of the primary tools of high performance engine builders, and porting cylinder heads would be strictly hit or miss without it.
Design Specifications
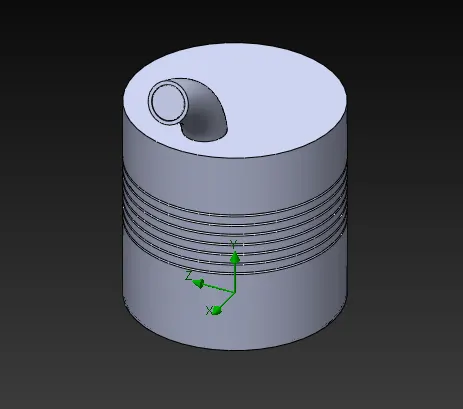
Diameter of cylinder = 100mm
Length of cylinder = 100mm
Diameter of pipe = 25mm
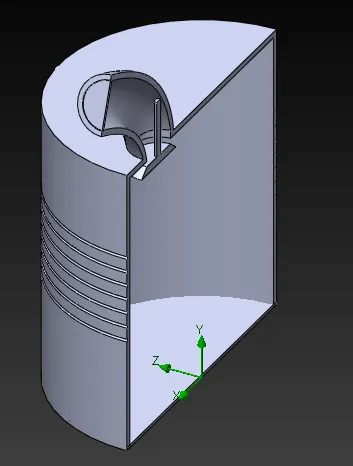
Sheel Thickness = 2mm
Isometric View of final model :
Section view of final model :
Dimension of the valve lift:
Simulation Parameters
Simulation type = Steady state
Flow type = Internal
Velocity = 10m/s
Pressure = 101325Pa
Fluid = Air
Parametric study :

Final model after appling global and local mesh
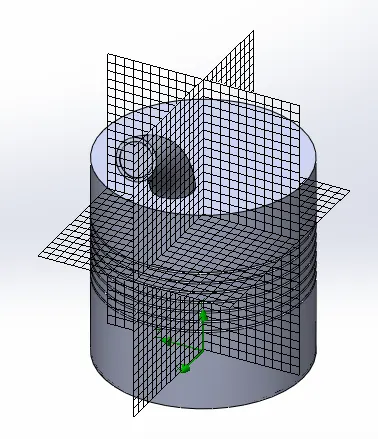
Results of parametric study:
Pressure cut plots:

Design point 1 pressure plot:
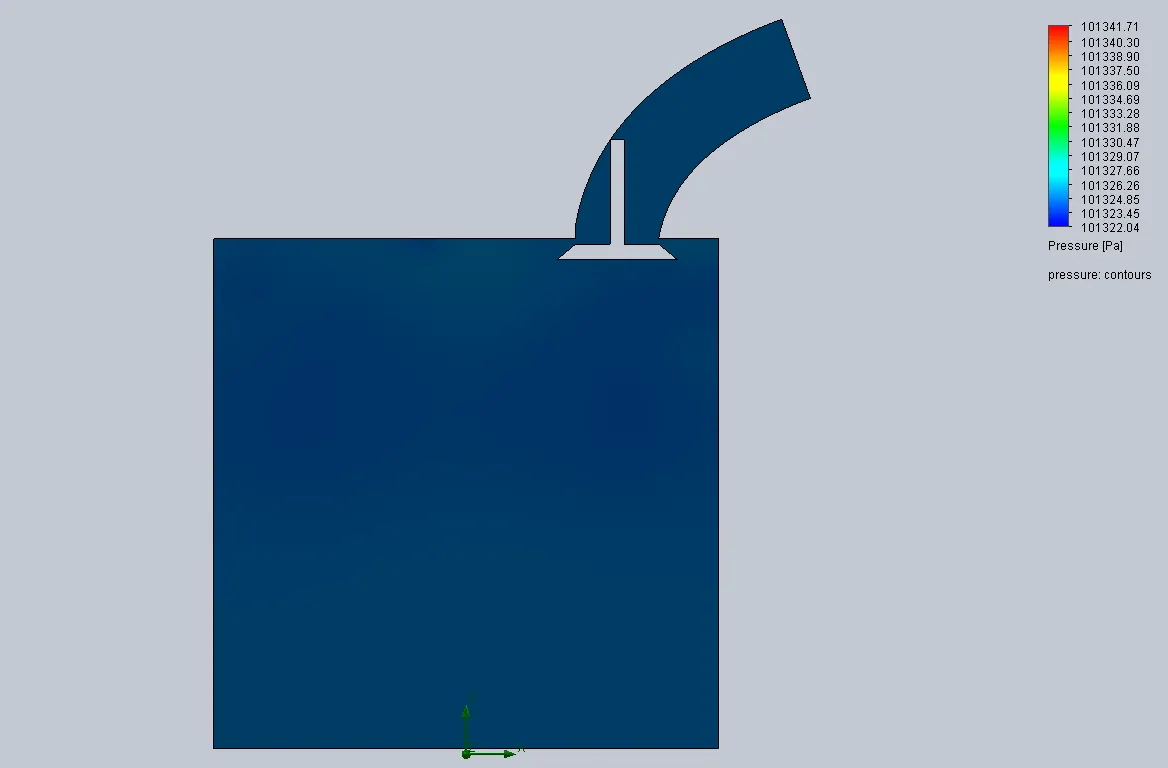
Design point 2 pressure plot:
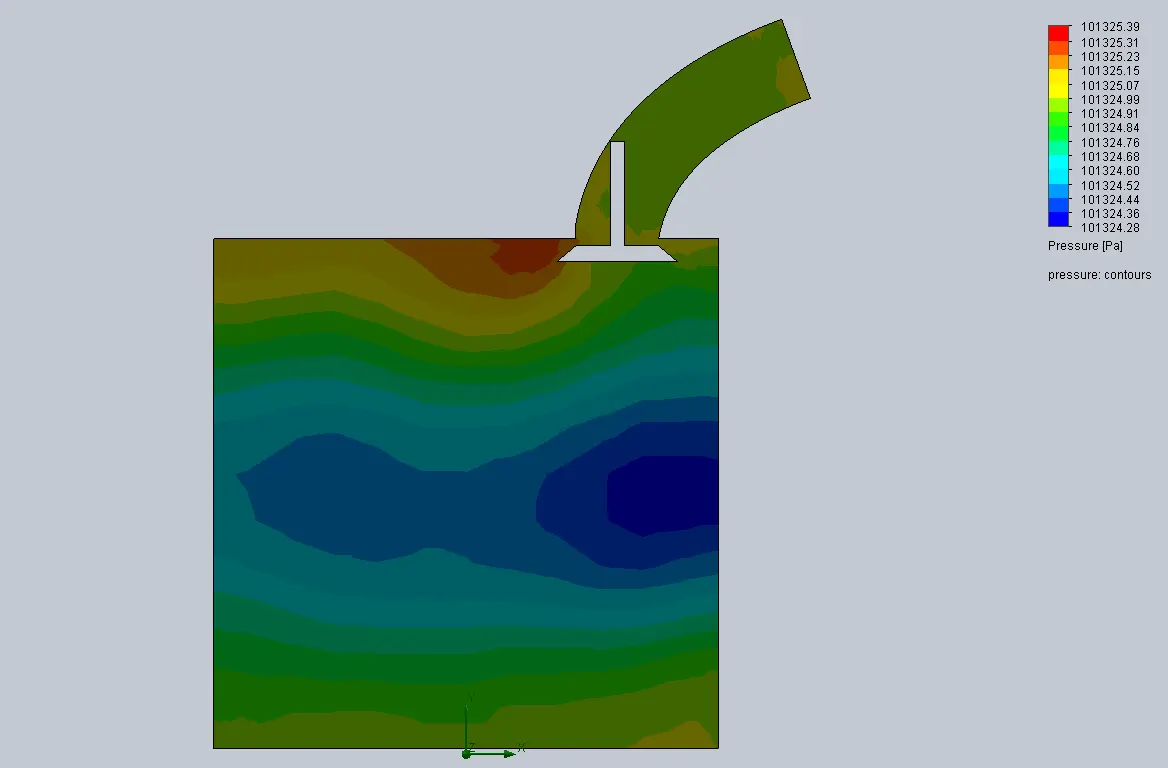
Design point 3 pressure plot:
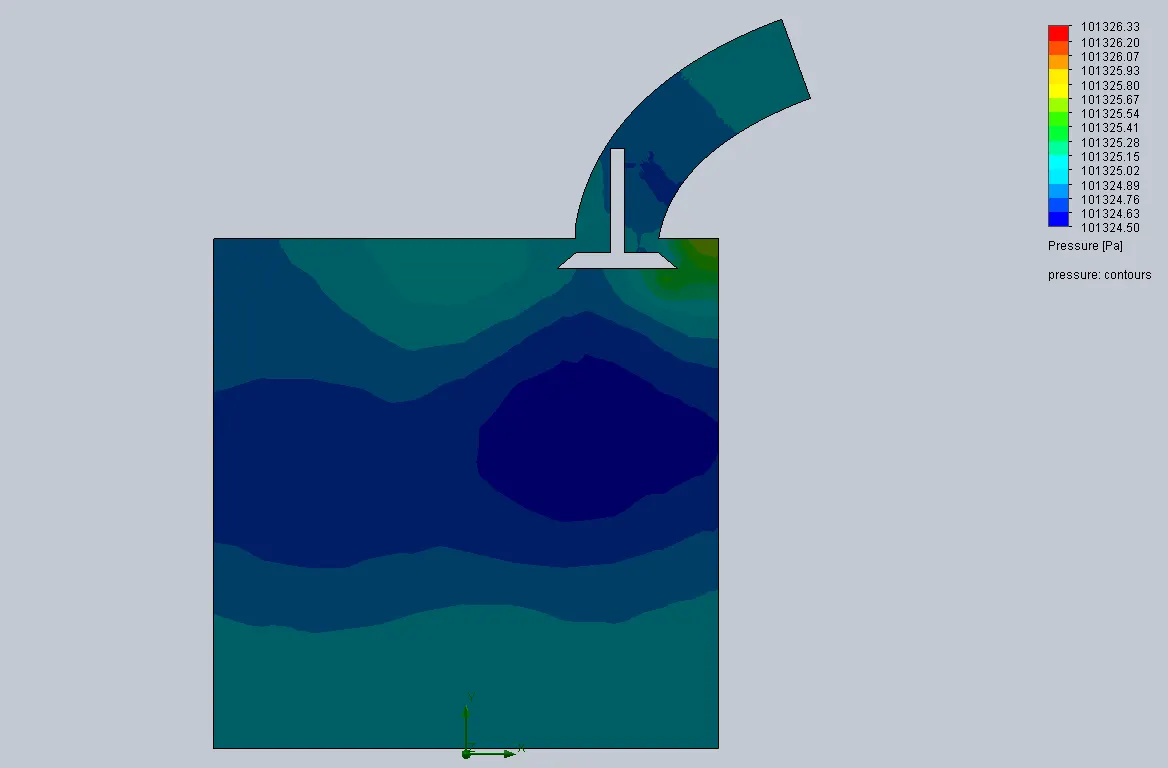
Design point 4 pressure plot:
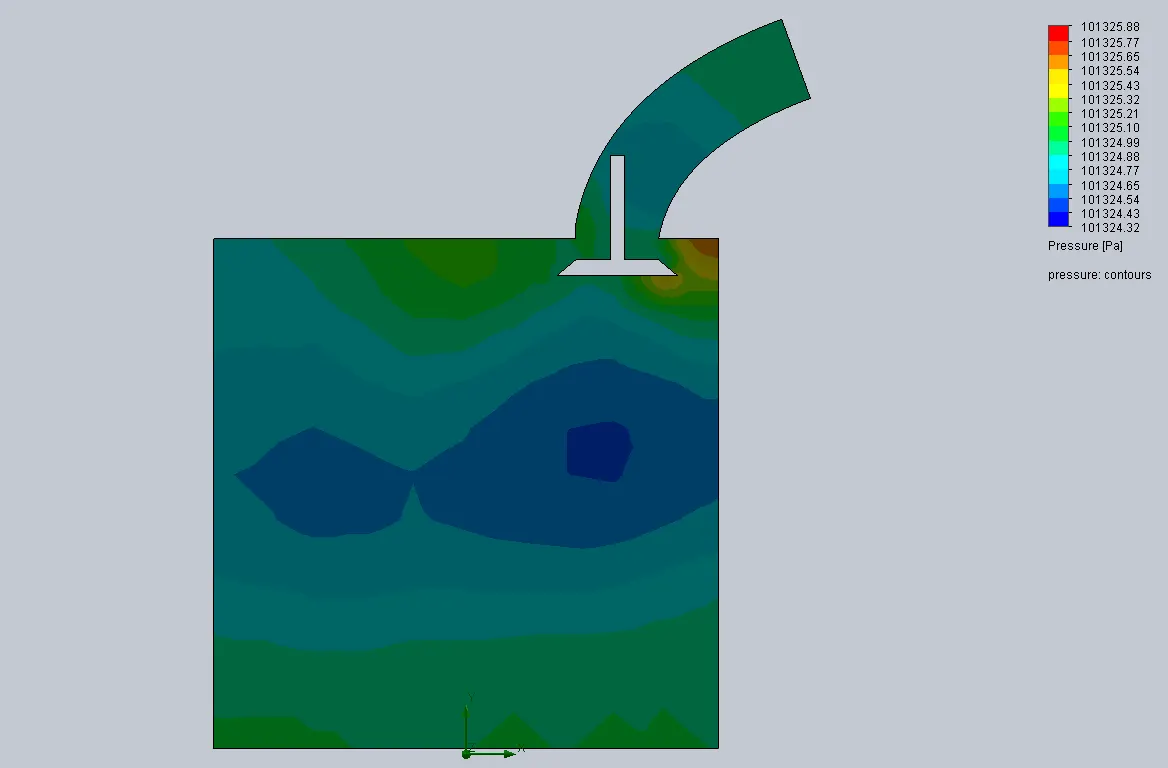
Design point 5 pressure plot:
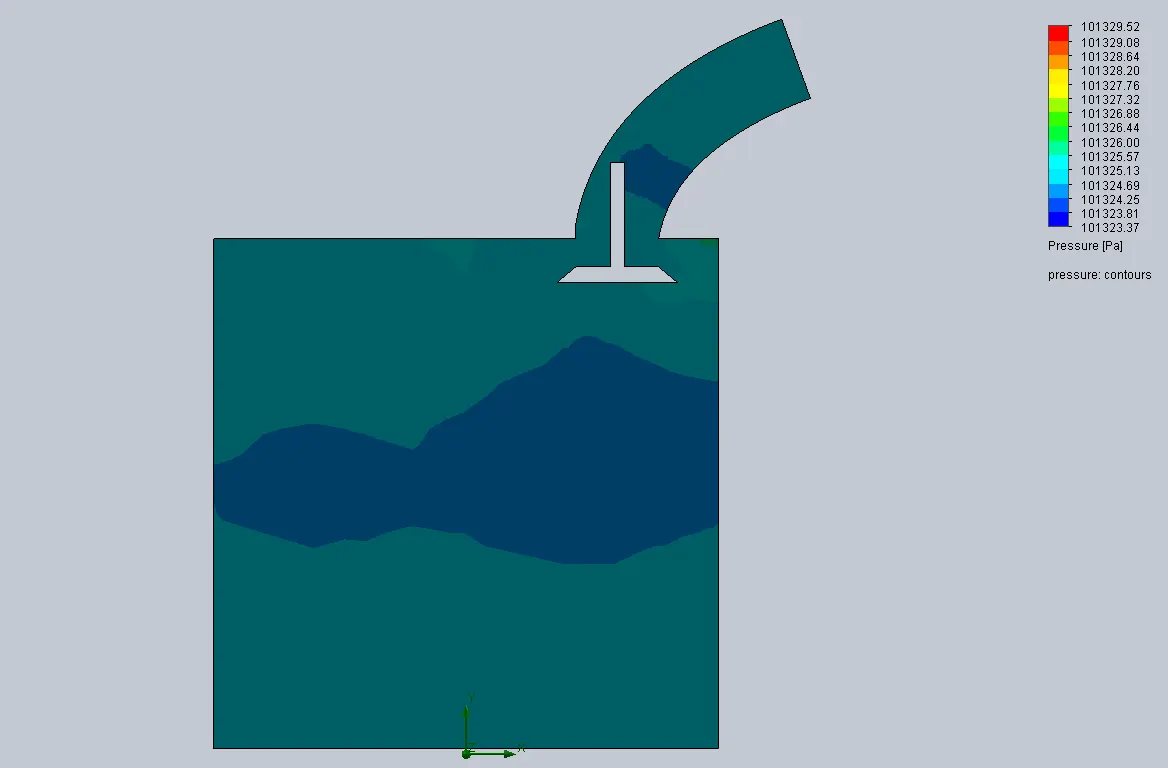
Design point 6 pressure plot:
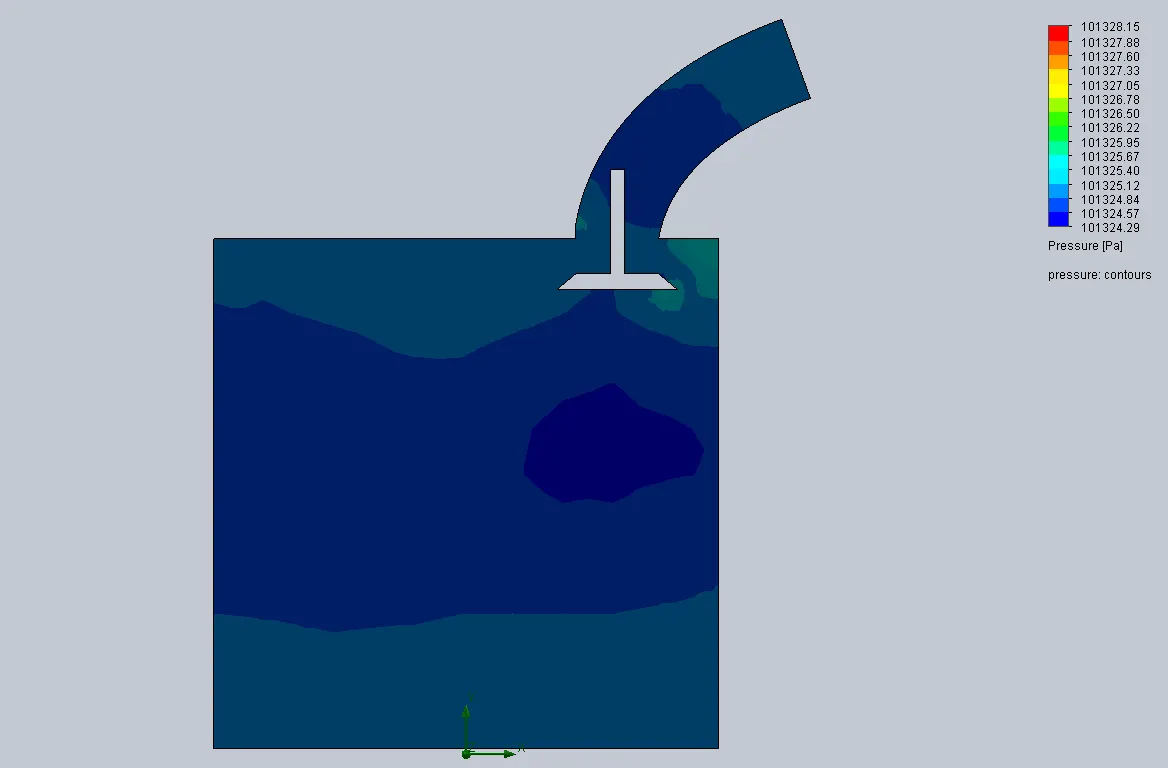
Design point 7 pressure plot:
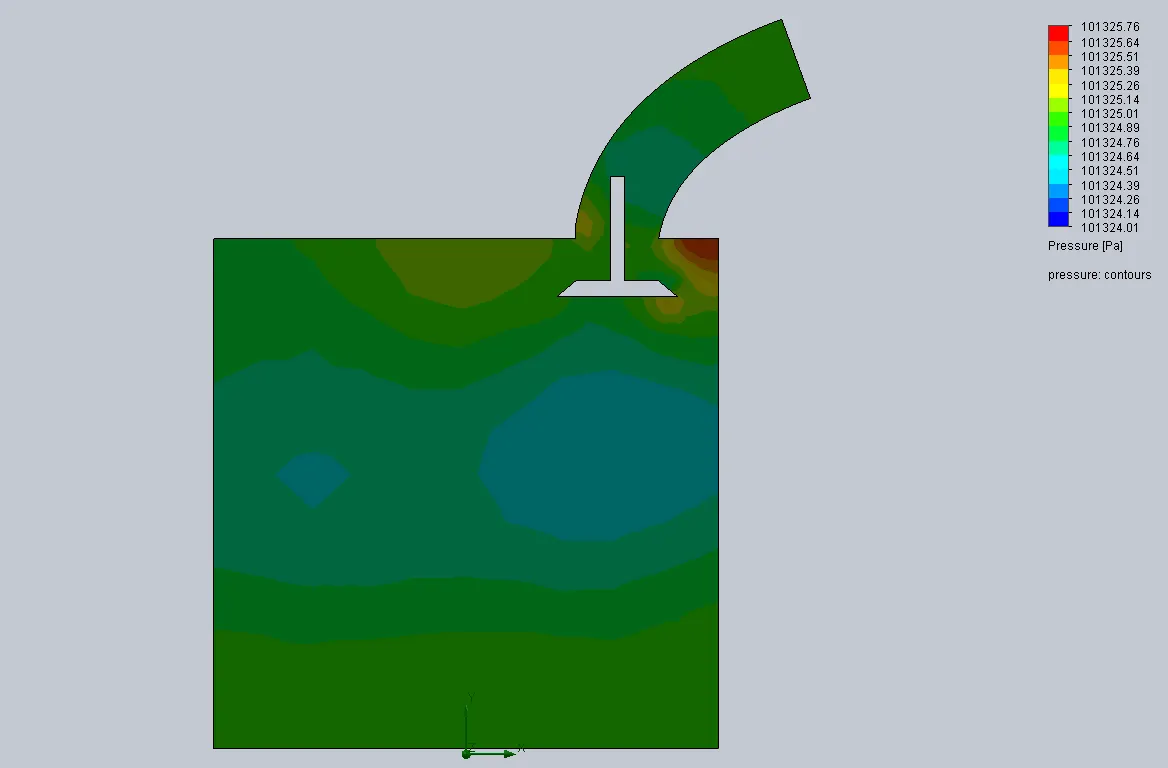
Velocity cut plot :

Design point 1 velocity plot:
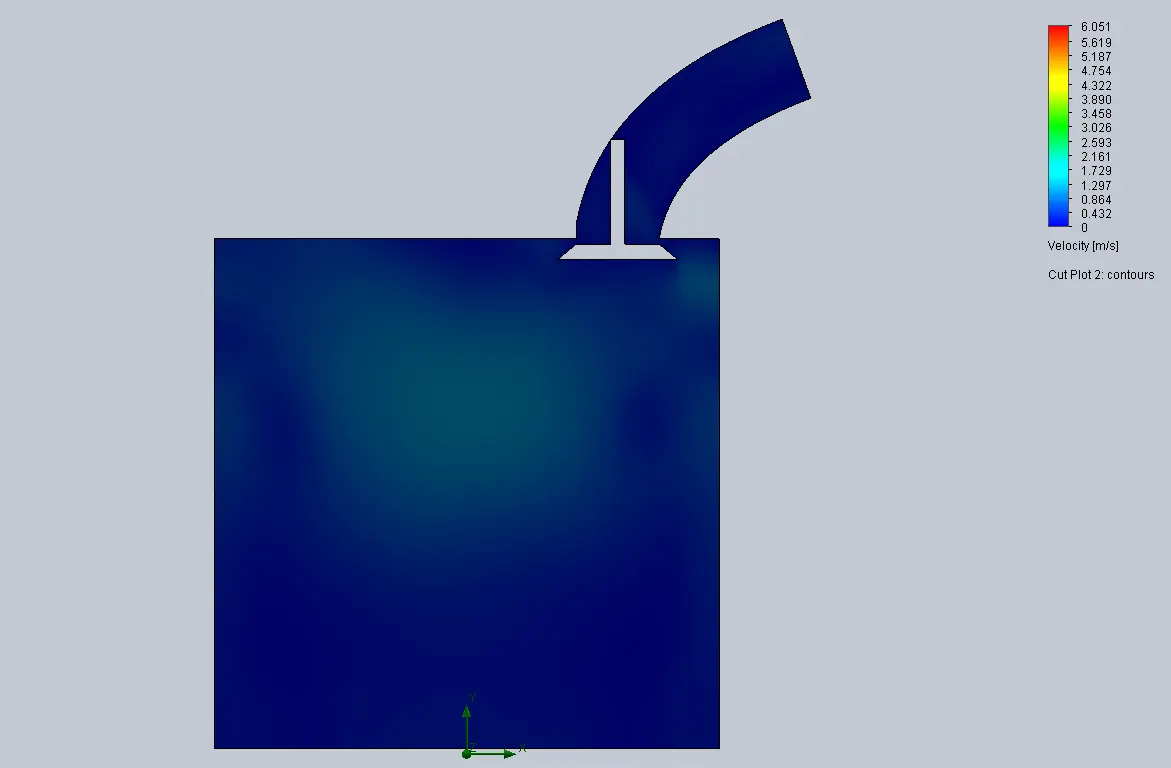
Design point 2 velocity plot:
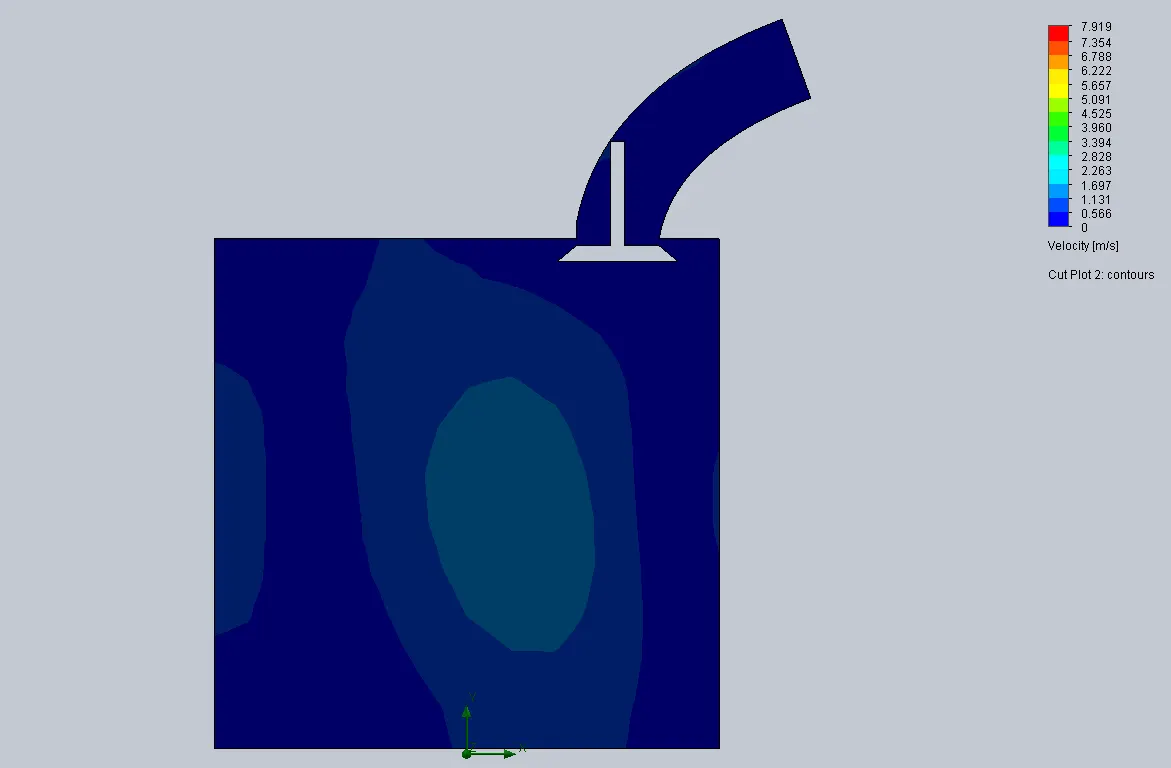
Design point 3 velocity plot:
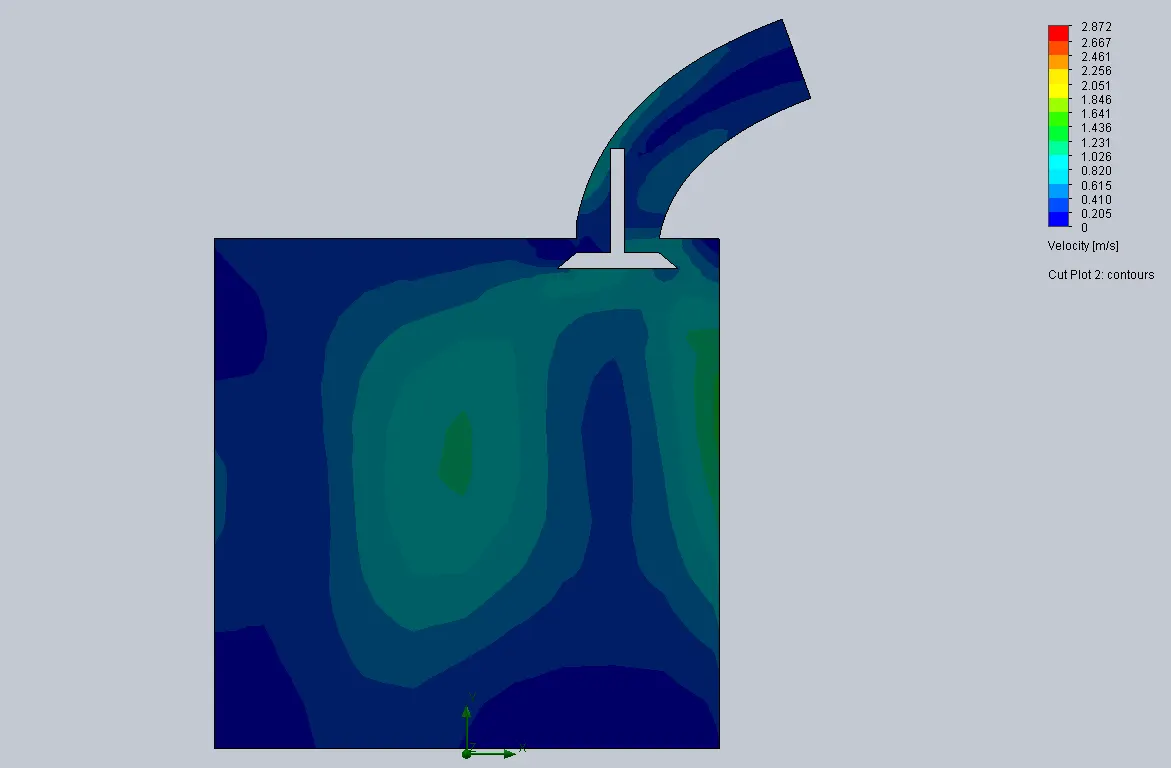
Design point 4 velocity plot:
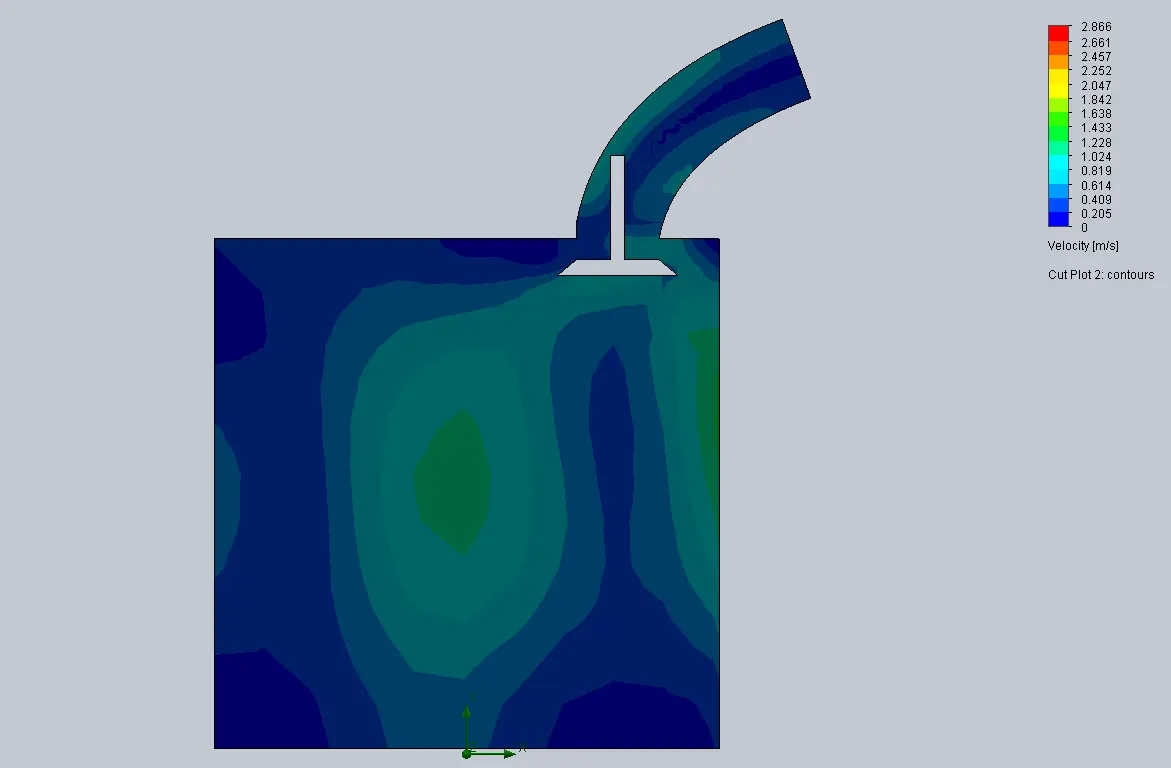
Design point 5 velocity plot:
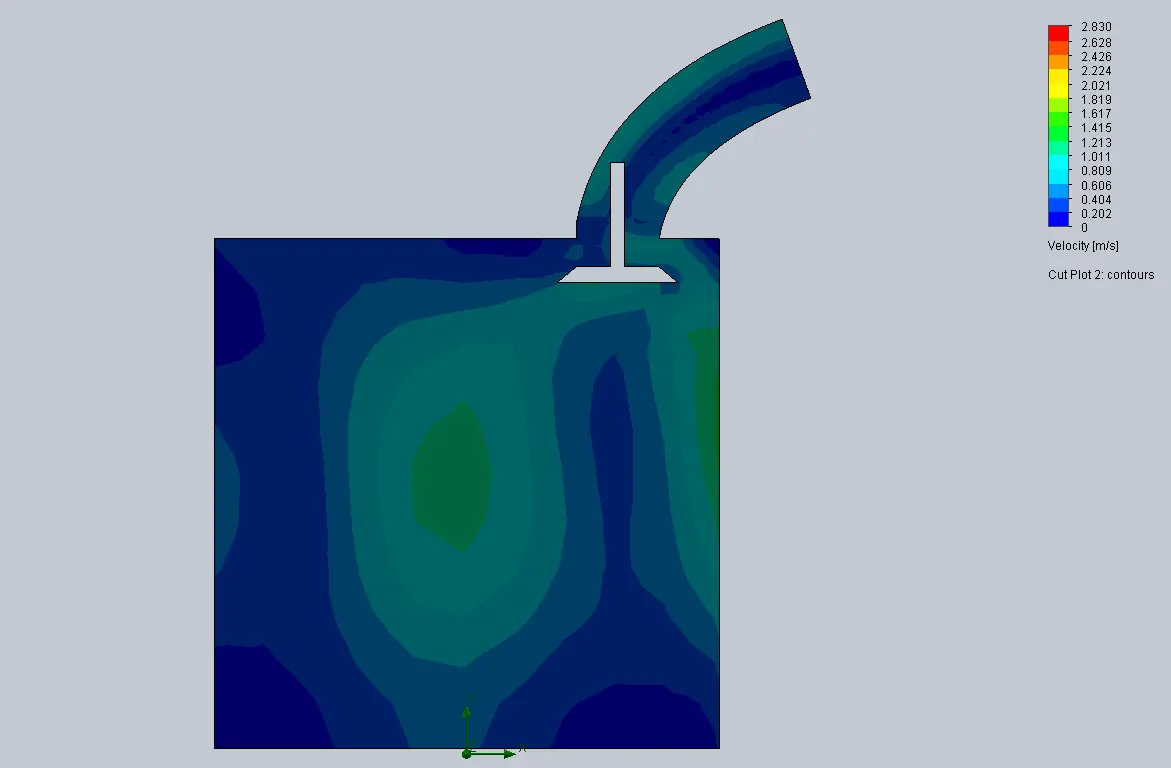
Design point 6 velocity plot:
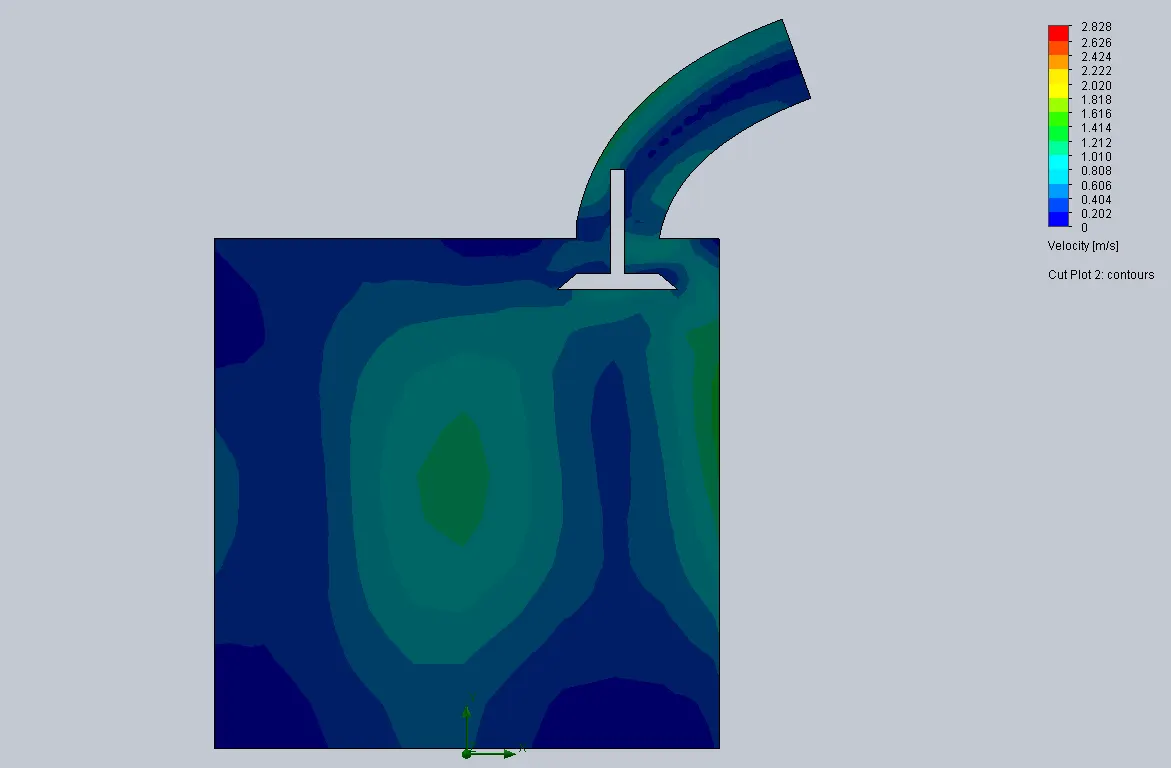
Design point 7 velocity plot:
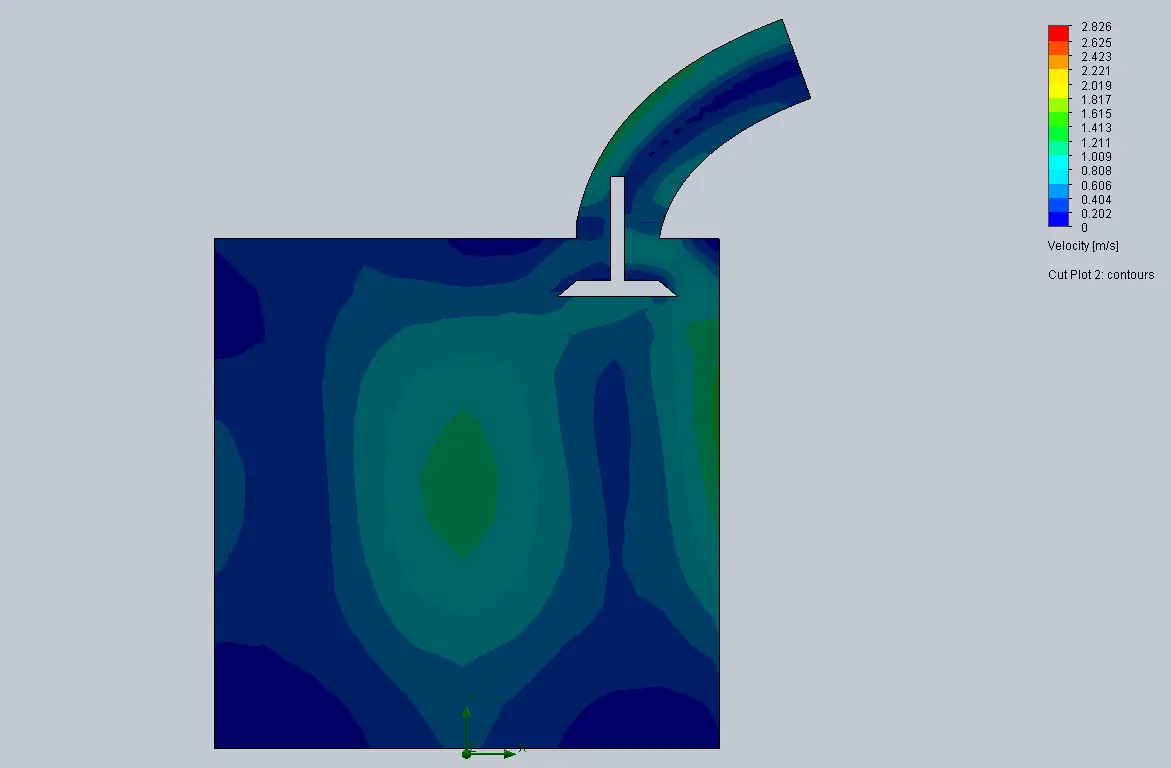
Flow trajectory with 150 points :

Design point 1 flow trajectory :
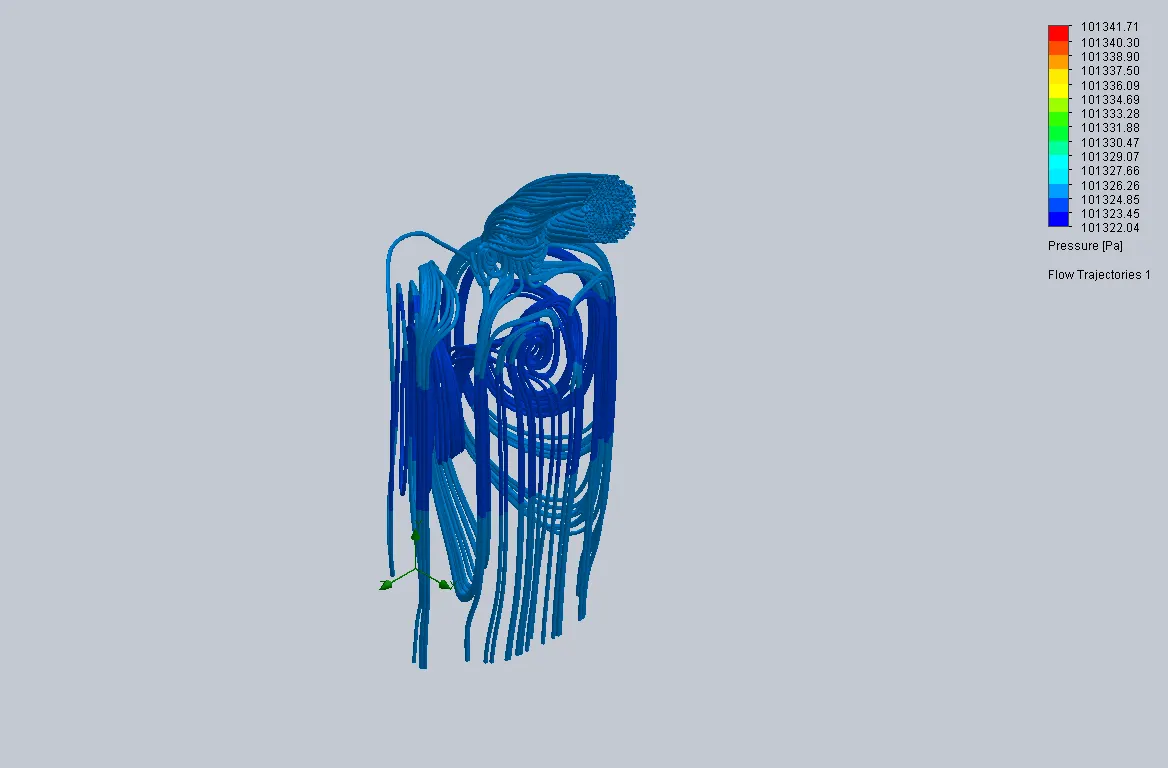
Design point 2 flow trajectory:
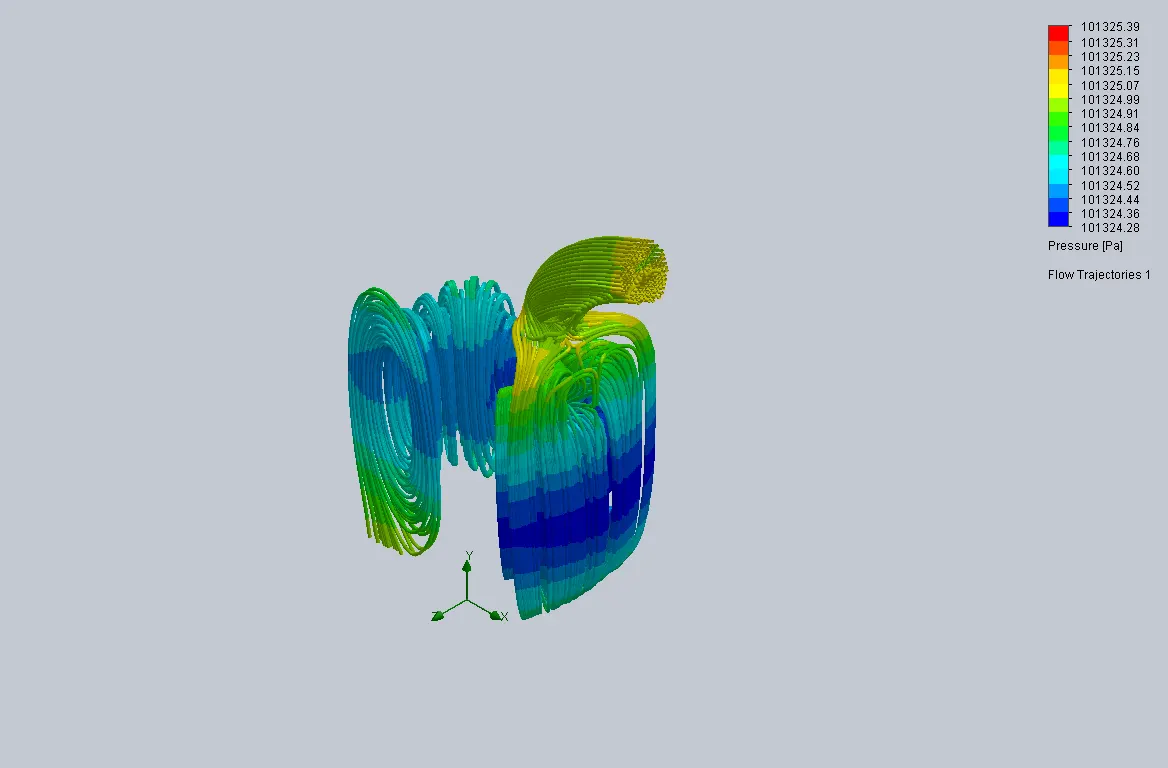
Design point 3 flow trajectory:
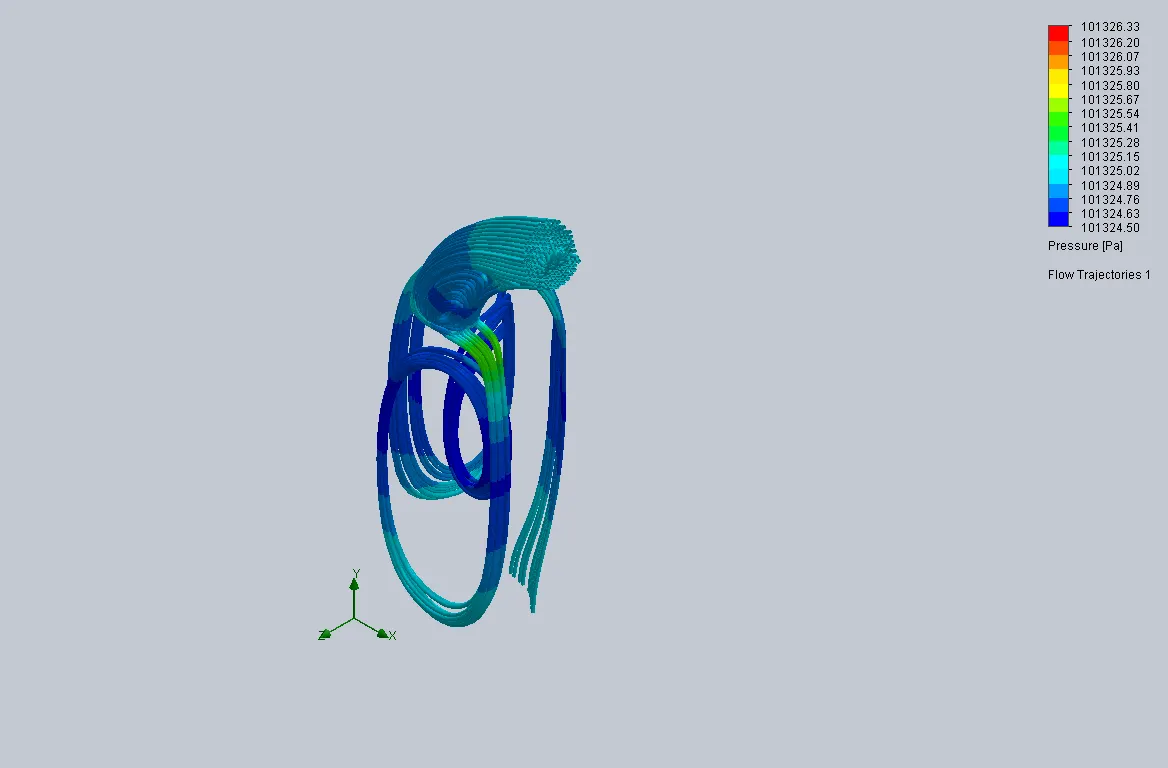
Design point 4 flow trajectory:
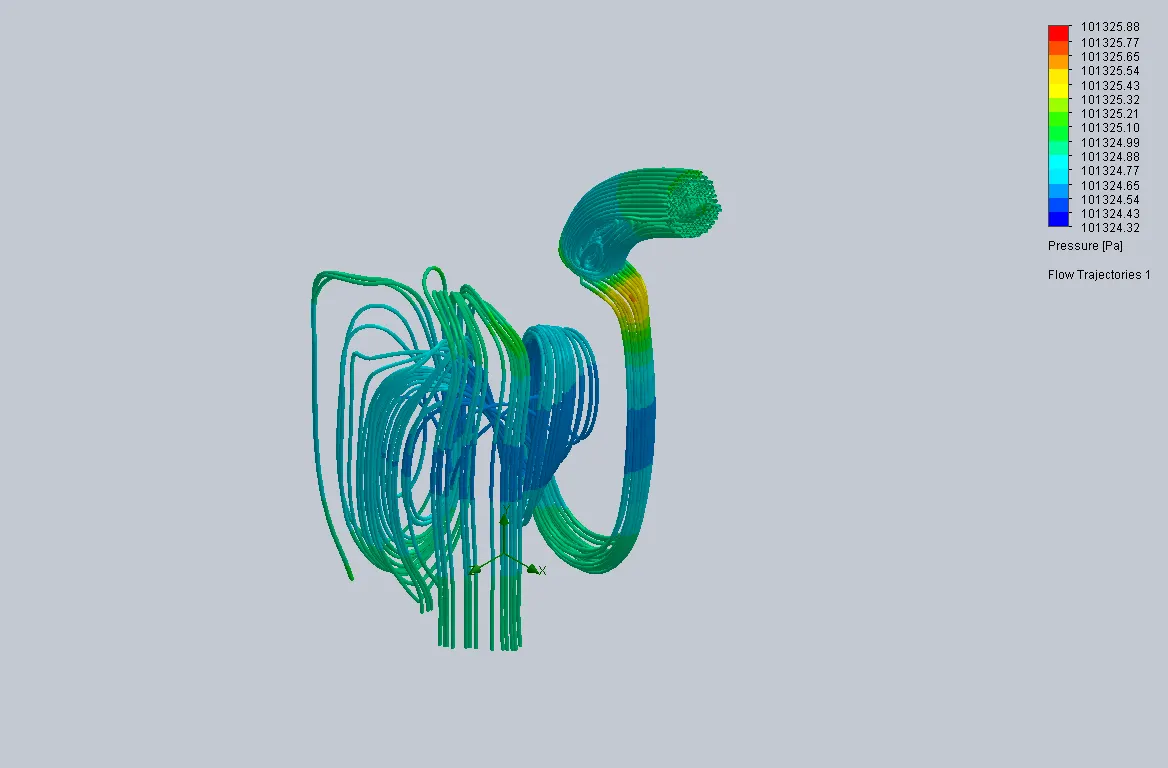
Design point 5 flow trajectory:
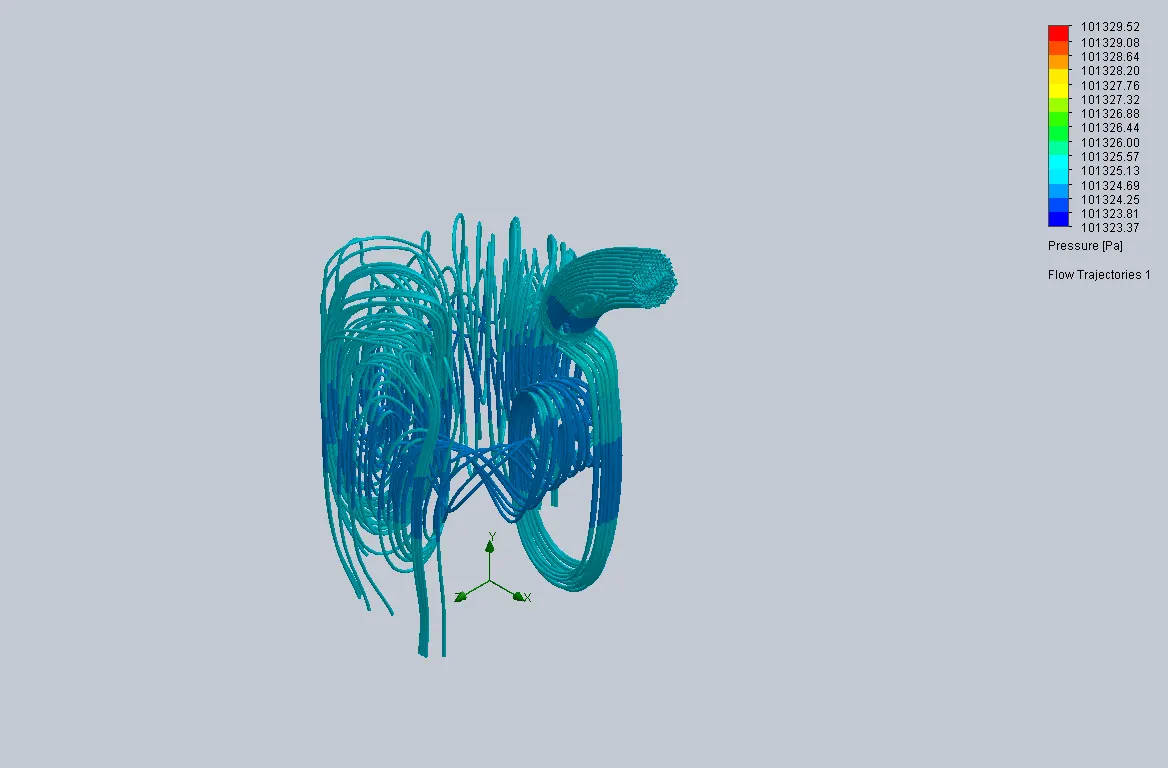
Design point 6 flow trajectory:
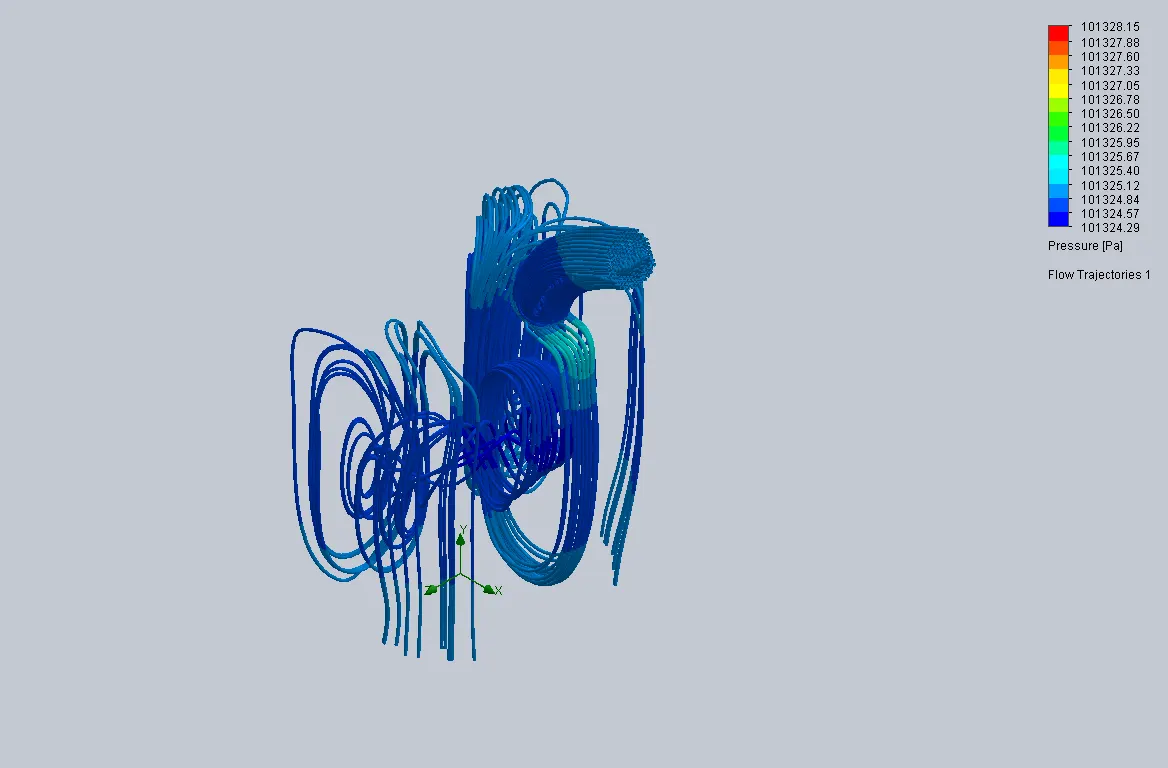
Design point 7 flow trajectory:
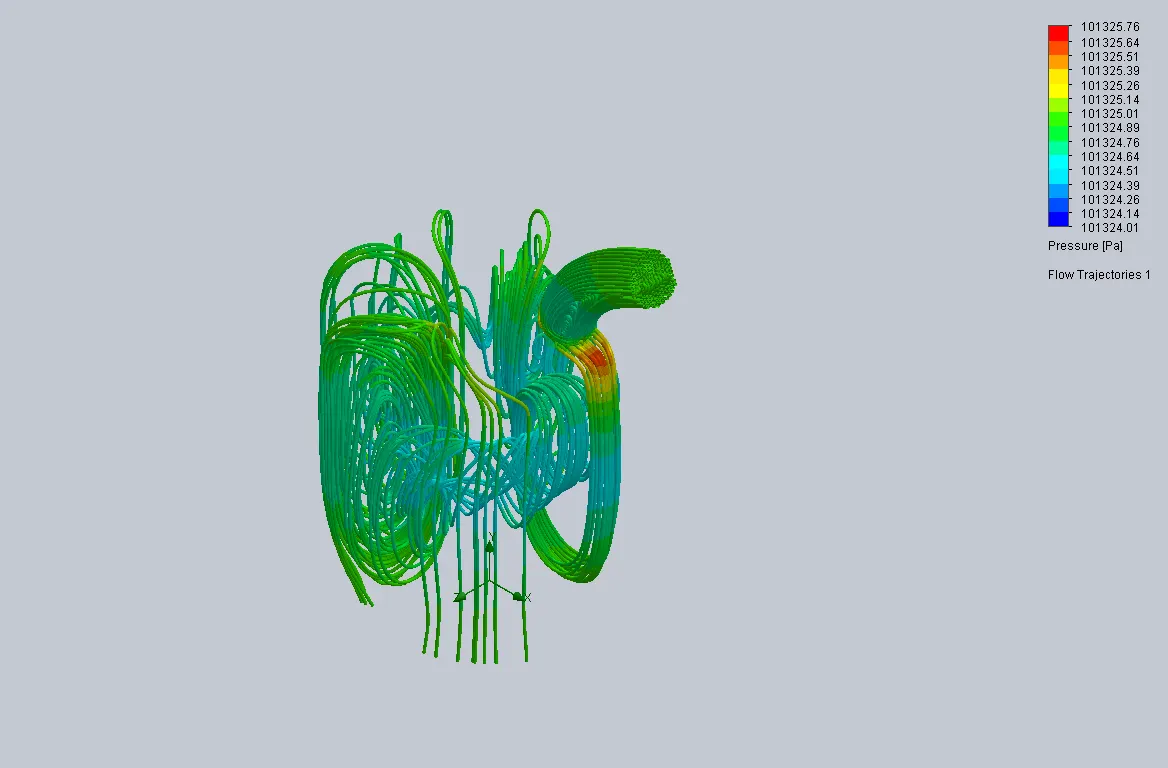
Global goals :

Conclusions:
It is intelligible that if we increase value lift velocity of flow increases.As the valve lift increase , the mass flow rate also increase with decreaseing slop so we can say that after a finite valve life mass flow rate will indepenent of valve lift. We can say that after some 8mm of lift the mass flow rate became nearly constant.As we increse the mesh value the curve or countour will get more fine and accurate and more dependable.