Longitudinal Brush Tire Model
AIM: To plot the longitudinal brush tire model.
GIVEN DATA:
| Normal load | N | 4000 |
| Coefficient of friction | - | 0.8 |
| Length of contact patch | m | 0.2 |
| Tire tangential stiffness per unit length | N/m^2 | 3E6 |
OBJECTIVE: To show the variation of traction force and critical length with longitudinal slip.
GOVERNING EQUATION: The longitudinal brush tire model is conceptualized in the following three zones;
Strain = `frac(triangle l)(l) = frac(R omega triangle t - v triangle t)(R omega triangle t) = s` = Slip
`triangle l = R omega triangle t . s = i.s`
where;
`R omega triangle t` = Distance traveled by the contact patch (m)
`v triangle t` = Distance traveled by the vehicle (m)
Total deformation = Initial deformation + Brush deformation
`e = s.i + lambda.i = (s+lambda).i`
1. Adhesion region:
Longitudinal force, `F_x = k_t . l_t . s . (lambda + l_t/2)`
where;
`C_(s) = 1/2 . k_y . l_t^2` = Cornering stiffness (N/rad)
`s` = Slip
`k_y` = stiffness (N/m^2)
`l_t` = Length of contact patch (m)
2. Critical point:
Critical length, `l_c = frac(mu_p . F_z)(k_t . l_t . s) - lambda`
Critical slip, `s_c = frac(mu_p . F_z)(l_t . k_t . (lamda + x))`
where;
`mu_p` = Peak road-tire friction coefficient
`F_z` = Normal load (N)
3. Sliding (Large Excitation) region:
Longitudinal force, `F_x = frac(mu_p . F_z)(l_t) . (1 - l_c/l_t)`
SOLUTION:
Programming Language: MATLAB
Code:
% Longitudinal Brush Tire Model

% Input data:

F_z = 4000;   % Normal force (N)
mu = 0.8;     % Peak road-tire friction coefficient
l_t = 0.2;    % Length of tire contact patch (Assumed)
k_t = 3E6;    % Tire tangential stiffness (N/m^2)
lambda = 0.04;    % Initial deformation


% Solution:

s_xc = mu*F_z/(k_t*l_t*(l_t + lambda));   % Critical slip

for i=1:101
    s_x(i) = (i-1)*0.01;    % Slip ratio

    if s_x(i) < s_xc        % Adhesion region
        l_c(i) = l_t;
        F_x(i) = k_t*l_t*(lambda + l_t/2)*s_x(i);

    else                    % Slipping region
        l_c(i) = mu*F_z/(l_t*k_t*s_x(i)) - lambda;
        F_x(i) = k_t*s_x(i)*l_c(i)*(lambda + l_c(i)/2) + mu*F_z*(1 - l_c(i)/l_t);
    end
end


% Plot:

subplot(2,1,1)
plot(s_x,F_x,'linewidth',3)
xlabel('Longitudinal slip')
ylabel('Traction force (N)')
title('Traction force vs Slip ratio')
grid on
hold on

subplot(2,1,2)
plot(s_x,l_c,'linewidth',3)
xlabel('Longitudinal slip')
ylabel('Critical length (m)')
title('Critical length vs Slip ratio')
grid on
hold on

----------------------------------------------------------------------------------

% Reduced Friction Case

% Input data:

F_z = 4000;   % Normal force (N)
mu = 0.4;     % Peak road-tire friction coefficient
l_t = 0.2;    % Length of tire contact patch (Assumed)
k_t = 3E6;    % Tire tangential stiffness (N/m^2)
lambda = 0.04;    % Initial deformation


% Solution:

s_xc = mu*F_z/(k_t*l_t*(l_t + lambda));   % Critical slip

for i=1:101
    s_x(i) = (i-1)*0.01;    % Slip ratio

    if s_x(i) < s_xc        % Adhesion region
        l_c(i) = l_t;
        F_x(i) = k_t*l_t*(lambda + l_t/2)*s_x(i);

    else                    % Slipping region
        l_c(i) = mu*F_z/(l_t*k_t*s_x(i)) - lambda;
        F_x(i) = k_t*s_x(i)*l_c(i)*(lambda + l_c(i)/2) + mu*F_z*(1 - l_c(i)/l_t);
    end
end


% Plot:

subplot(2,1,1)
plot(s_x,F_x,'linewidth',3)
xlabel('Longitudinal slip')
ylabel('Traction force (N)')
title('Traction force vs Slip ratio')
legend('mu = 0.8','mu = 0.4')
grid on
hold on

subplot(2,1,2)
plot(s_x,l_c,'linewidth',3)
xlabel('Longitudinal slip')
ylabel('Critical length (m)')
title('Critical length vs Slip ratio')
legend('mu = 0.8','mu = 0.4')
grid on
Output:
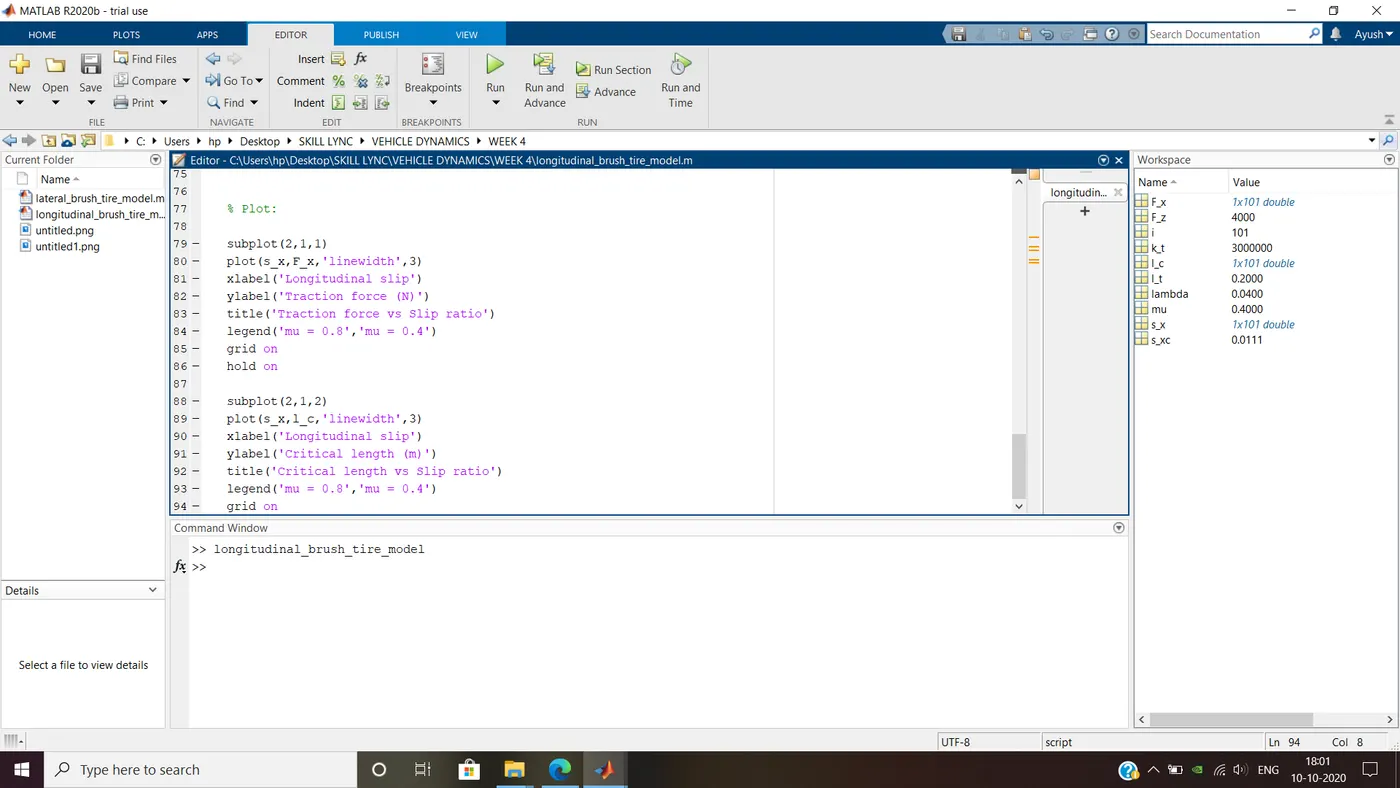
Plot:
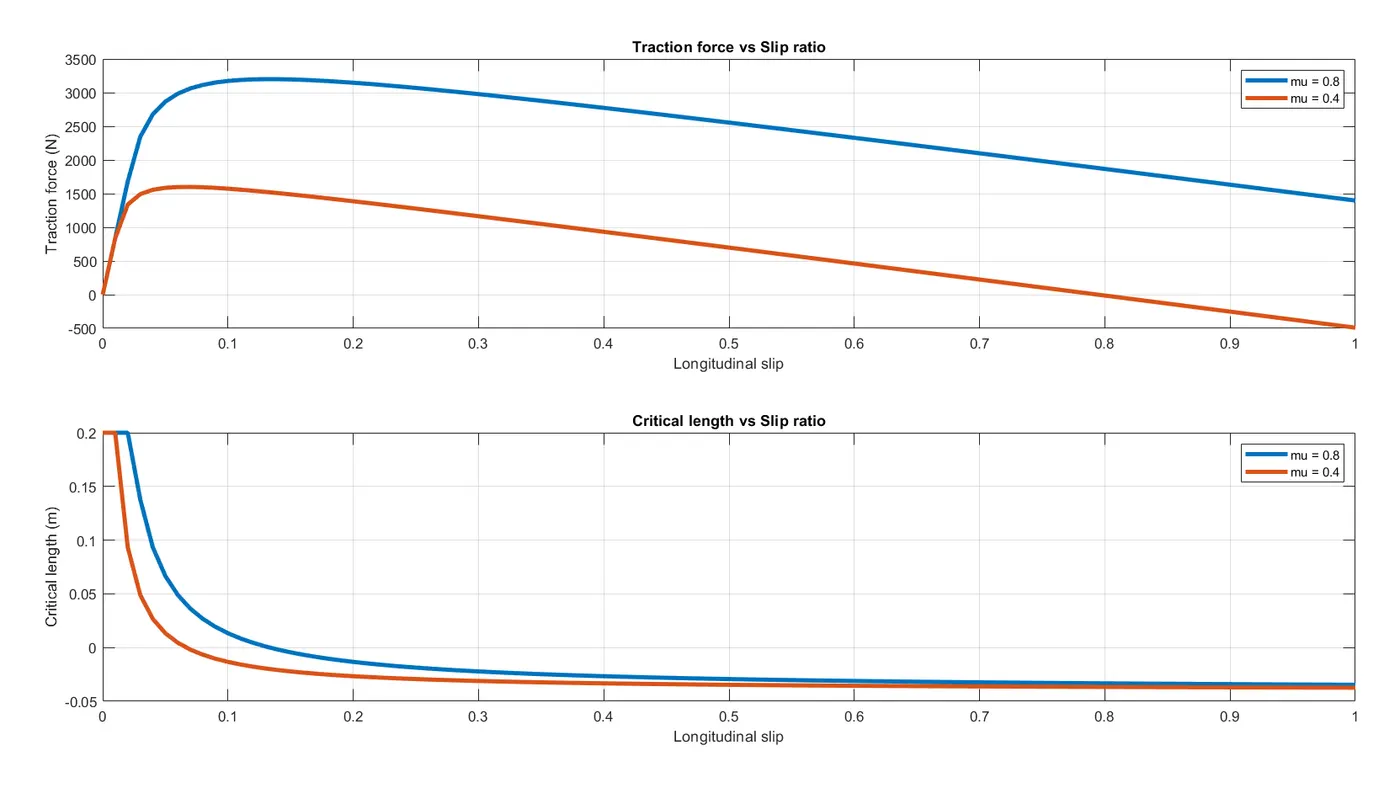
CONCLUSION: From the above results, we can infer that by reducing the coefficient of friction, the traction force and critical length decreases significantly within the tire. Also, the peak traction force is less than the normal load that is imposed on the tire.
- Adhesion region: The peak occurs early in the reduced friction case as compared to the normal one, thus indicating the ability of tire to be within the adhesion zone.
- Critical point: The peak in traction force is more in case of higher frictional coefficient and it occurs at higher slip ratio whereas critical length reduces for the same values.
- Sliding region: Beyond the peak value, the traction force decreases and critical length converges beyond that point.