Gate Valve Parametric Study
Aim : To obtain the flow factor, flow coefficients and mass flow rates for different valve opening values of a Gate Valve.
Introduction and theory:
A Gate Valve is a simple mechanism that is used to control the flow of a fluid through a pipe. The gate valve uses a gate that is connected to a stem, and the rotational motion of the stem raises or lowers the gate in order to control fluid flow. The function of a gate valve is binary, only used to stop or allow flow through a pipe. This device is not utilized for flow regulation, as the design is not meant for this function. The reason this device is not used for fluid regulation, is the fact that the seat upon which the gate sits is a groove that is below the diameter of the pipe, and this may cause throttling within the pipe. The seat introduces an additional unoccupied volume, and the opening of the valve will not be commensurate with the amount of fluid that is to be allowed through the opening. Furthermore, the pressure fluctuation caused due to this phenomenon affects the position of the gate, and may result in wear due to shear caused by contact with other surfaces in its proximity. A gate valve causes very low pressure loss when used, and is primarily used for this reason. Gate valves are used in oil and gas industries, refineries and for piping in general.
Simulation workflow:
Modelling and solving approach:
- The objective of this simulation is to obtain the mass flow rates, flow coefficients and flow factors of water flowing through a pipe, with different gate valve openings. As far as modelling this simulation is concerned, the volume of fluid flowing through the gate valve must be properly captured. Hence, different opening lengths will be determined by the movement of the gate along the Z-axis, and will be parametrized. This will be elaborated upon in the section detailing the geometry construction.
- Using the optimal mesh type for the fluid domain is imperative to simulation convergence. Mesh types that are exclusively tetrahedral and hexahedral may yield workable results for some cases of the gate valve opening, but the some of the simulations end up diverging heavily for some cases. This may occur even if the cell count of the mesh is high, and happens due to the nature of the geometry. Hence, for this case, the cutcell meshing method will be utilized. The cutcell method is method that adjusts to the geometry, and the cell count and cell size in regions with complex geometry increase and reduce respectively, and this yields highly accurate results. Another benefit of this this method is that it keeps cell skewing under control, which is a problem that is encountered in tetrahedral meshing. Since the skewness value is under control, the simulation will not diverge.
- The simulation is steady state simulation. In order to calculate the flow coefficient and flow factor, the volume flow rate and pressure drop at the outlet will be required. The formulae for the same will be elaborated upon in the sections that follow.
- The pressure drop will provide an insight to the behaviour of the fluid in the pipe. For this reason, the pressure at the inlet of the pipe will be provided in place of a velocity input at the inlet. The difference between the pressure drop desired and the actual pressure drop present in the pipe will reveal the effect of altering gate lift values.
- The flow is expected to be turbulent in nature, and for this reason, a Realizable K-epsilon model will be used. The K-epsilon model is most effective in simulating turbulent flows that are not near-wall. Since near-wall behaviour is not high in priority, scalable wall-functions will be used, making sure the flow near the wall is computed in the log-law region. A Realizable K-epsion model introduces a superior term to compute turbulent viscosity, rotational flows and flow separation. This makes it more sensitive during computation. However, the model provides highly accurate results.
- The volume flow rate, mass flow rate and pressure drop in the system will be monitored, and these values will be used to compute the flow coefficient and flow factor.
- A parametric study will be performed, by parametrizing the gate opening height, the mass flow rate, volume flow rate and pressure drop. The gate opening height will be altered between 10 percent to 80 percent of the maximum possible gate opening, and the other parameters above will be monitored.
I) Geometry creation:
- The geometry was first imported into SpaceClaim.
- The gate component was selected, and the 'Move' command was used to vary its height. The height for the first simulation was set at 10 mm. This command was parametrized, and will be used to vary the opening for the other required heights.
- The volume of the fluid was created by using the 'Volume Extract' tool, selecting the edges of the inlet, outlet and the edge just below the bonnet.
- The spindle and the gate were kept visible(with physics suppressed), so that the volume of the fluid for different gate opening percentages would update according to the volume these objects occupy in the fluid domain.
| Main geometry | 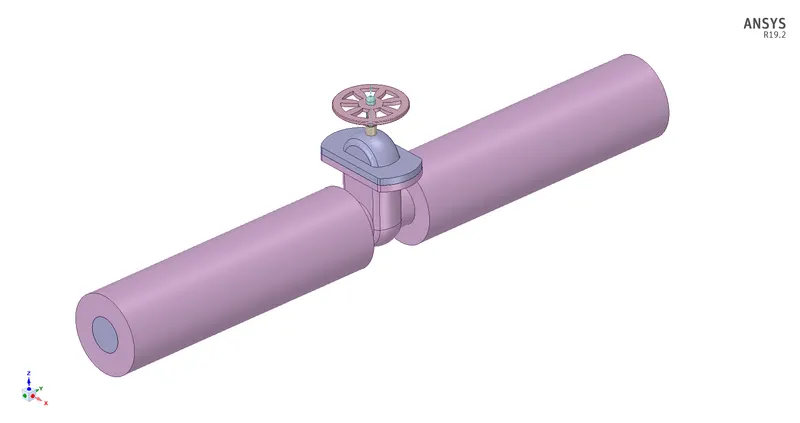 |
| Volume Extracted | 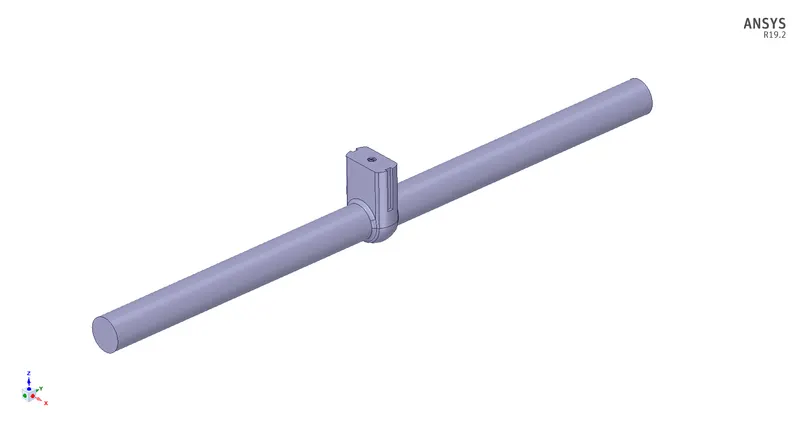 |
| Section plane along axis of extracted volume, with gate | 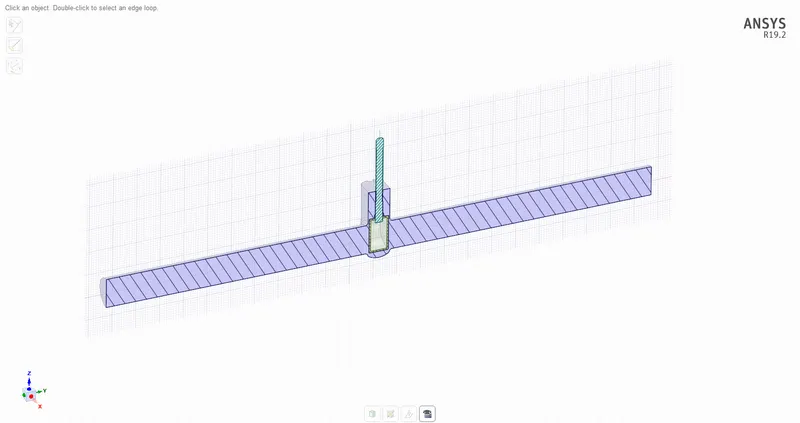 |
II) Mesh creation:
The cutcell method was used to create the mesh, by entering Mesh > Assembly Meshing > Method > Cutcell. A few other settings were tweaked in order to obtain a good mesh.
(a) Sizing:
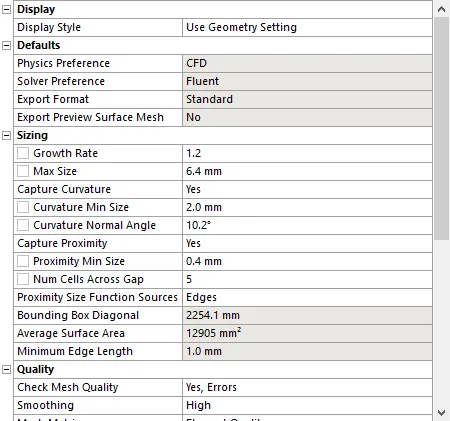
- The max element size was set to 6.5 mm. The 'Capture Curvature' and 'Capture proximity' options were switched on, and the Curvature min size and Proximity min size were set to 2.0 mm and 0.4 mm respectively. This will allow us to utilize cells of a smaller size at any regions that are curved in nature, and will faithfully maintain the required geometry.
(b) Quality :
- The 'Smoothing' option was turned to 'high', in order to obtain high element quality.
- The settings have been displayed below.
The inlet and the outlet were then provided with named selections.
| Mesh | 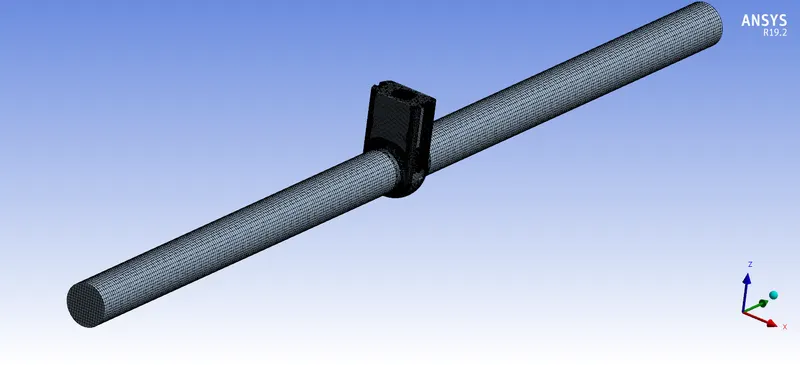 |
| Inlet | 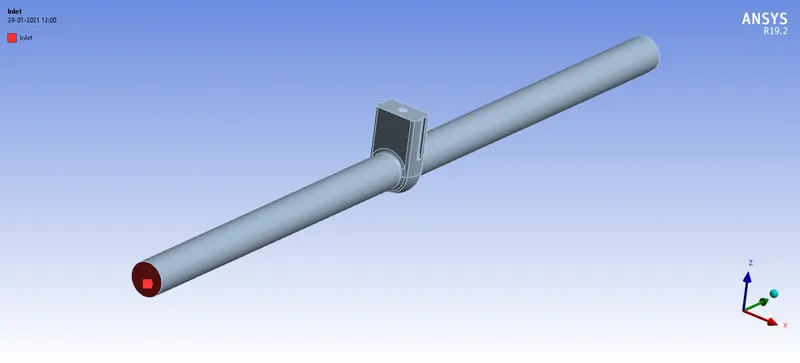 |
| Outlet | 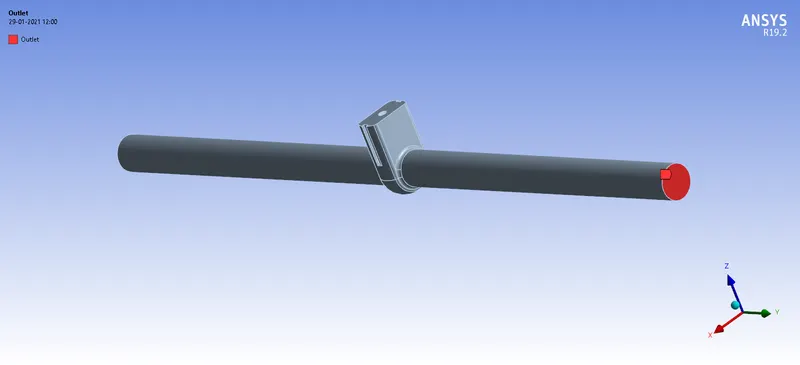 |
III) Fluent settings:
(a) General settings:
- The simulations that are going to be carried out are steady state in nature. This is set in the General section(Setup > General). Acceleration due to gravity is switched on as well, and a value of -9.81 `m/s^2` is given, with the negative sign indicating the downward direction.
Solver used: Pressure-based solver
A pressure-based solver is used for this case, as the compressibility effects are to be neglected. A density-based solver is highly accurate, but requires more computation time, and would not prove advantageous in this case. A pressure-based solver requires less computational time, and will provide accurate simulation results for this case. The pressure-based solver solves the governing equations in a sequence, unlike the density based solver.
(b) Materials and Cell Zone Conditions:
- The fluid chosen for this simulation is water, and has been imported from the Fluent library by entering Setup > Materials > Fluid > Fluent Database.
- After importing the fluid, the working fluid is changed from the default to the newly imported fluid, water. This has been done by entering Cell Zone Conditions > 'volume_volume' > Material Name.
(c) Model settings:
Model used : Realizable k-epsilon, with Scalable wall-functions:
- The model that will be used in this simulation is the Realizable k-epsilon model. The reason behind the selection of this model has been mentioned in the Modelling and solving approach section. The Realizable k-epsilon model introduces a superior formulation for computing the turbulent viscosity. Scalable wall functions will be used to keep the Y-plus value above 11.
- This has been done by entering Setup > Models > Viscous> k-epsilon > k-epsilon model, Near-Wall Treatment.
(d) Boundary conditions:
- The inlet pressure is set to 10 Pascals by changing the type of boundary and entering the gauge total pressure by entering Setup > Boundary Conditions > Type. The type is set to 'pressure-inlet'.
- The outlet is set to 'pressure-outlet', and will stop computing the physics of a particle that has reached it.
- The boundary conditions are set in Fluent, as shown in the table below.
-
Location Boundary condition Inlet Pressure-inlet Outlet Pressure-outlet Wall wall - The number of iterations is set to 300 by entering the value within the Run calculation section.
(e) Method and Initialization settings:
- The turbulent kinetic energy and dissipation equations are solved using Second order upwind schemes, which will provide solutions with an accuracy of the second order. This has been done by entering Solution > Methods.
- The solution is initialized by using Standard initialization. This will allow us to begin computation at the inlet. This has been done by entering Solution > Initialization.
(f) Report generation:
- The pressure drop at the inlet and the outlet were computed by creating two planes before and after the gate valve mechanism. The area-weighted average of the total pressure was computed over these planes. The two planes were created by entering Solving > Surface report > Area-weighted average > New Surface. The planes were given names, and the total pressure over these two planes were calculated.
- The volume flow rate, mass flow rate and pressure drop are required, and reports have been created for each of these variables by entering Solving > Surface report > Volume Flow rate(Volume Flow rate), and Solving > Flux report > Mass Flow rate(Mass Flow rate).
- Within these report definitions, the 'Create Output Parameter' is selected, in order to monitor the output of these variables. These variables will allow us to calculate the flow coefficient and the flow factor.
| General settings | 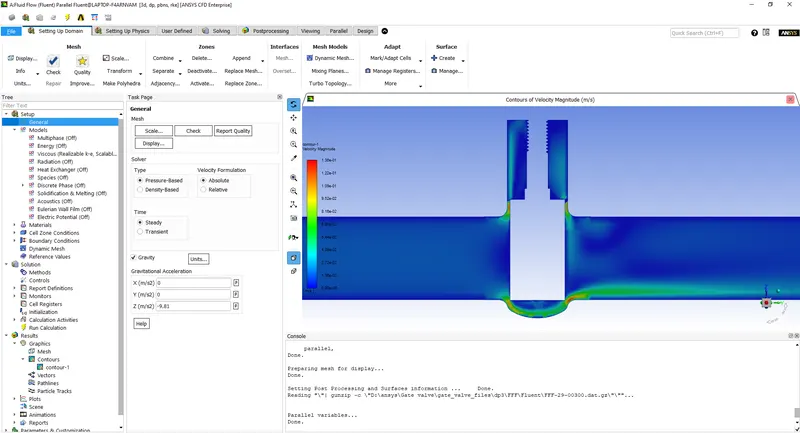 |
| Model | 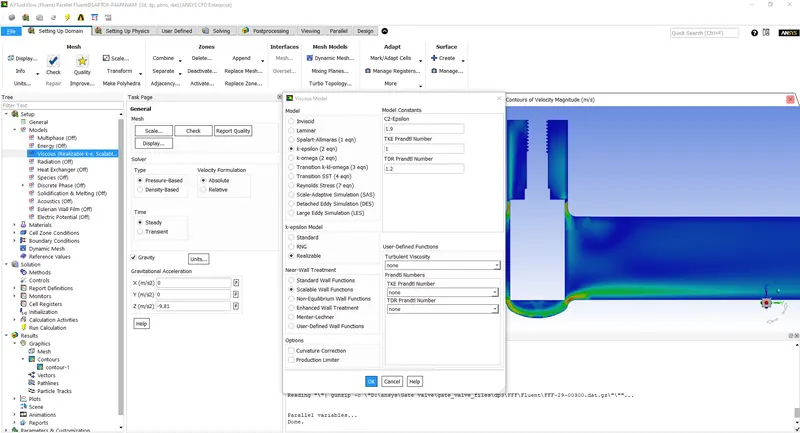 |
| Materials | 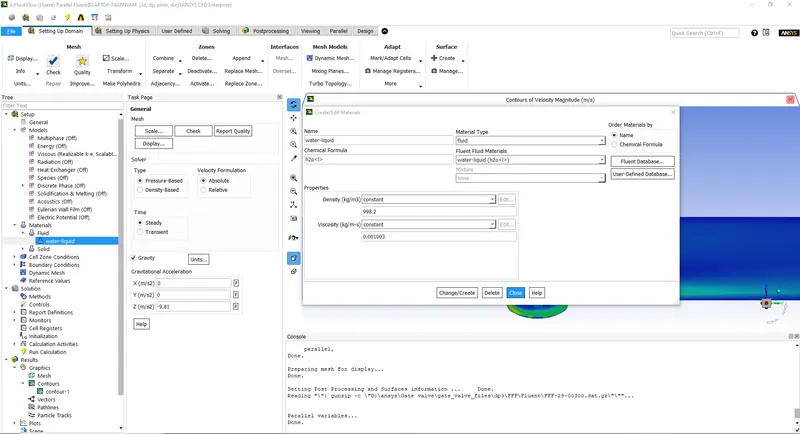 |
| Cell Zone Conditions | 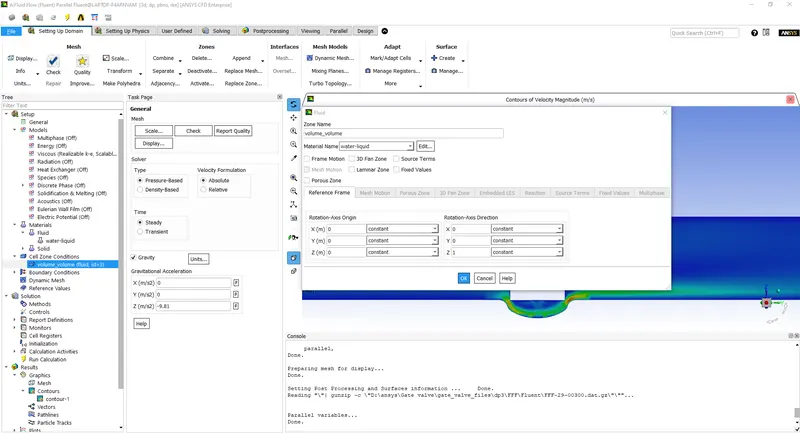 |
| Boundary conditions | 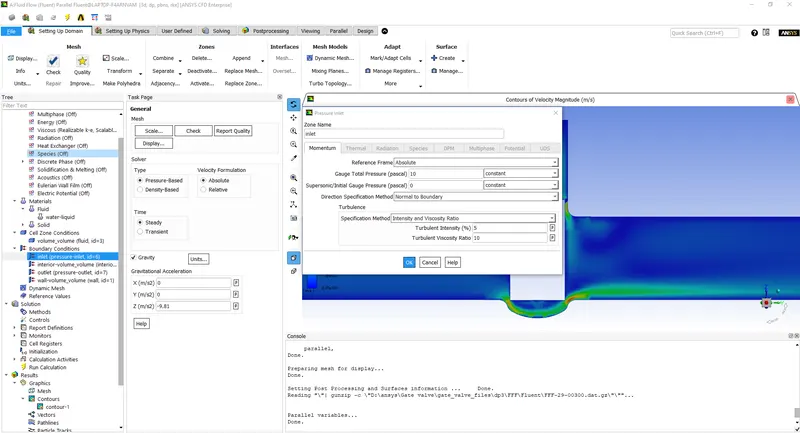 |
| Methods | 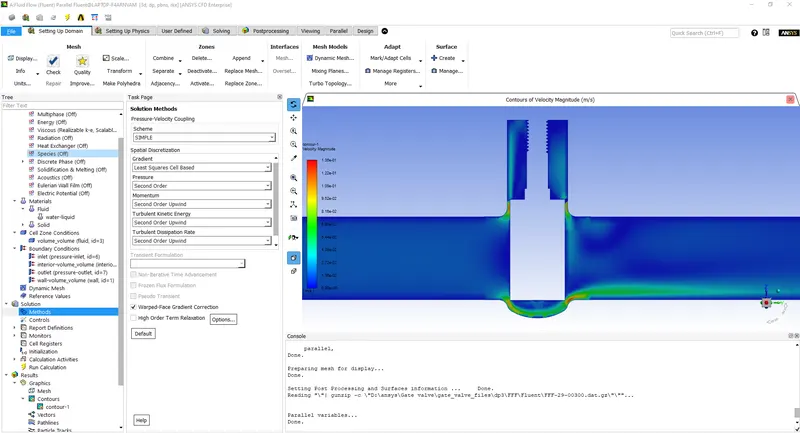 |
| Report Definitions | 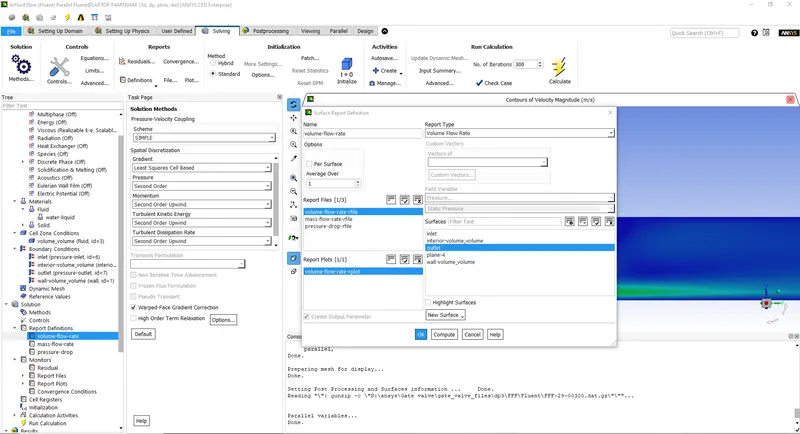 |
IV) Parameter Settings:
- The Parameter Set section was opened, where the required parameters were displayed, with their respective results. New Design points were created, providing different gate opening heights(in mm), in increments of 10 percent of the maximum possible gate opening diameter.
- After these design points were created, each point was updated in order to obtain the required results of the parameters mentioned. These results were then exported into Microsoft Excel, where they were post-processed and the Flow Factors and Flow Coefficients were obtained and plotted on graphs, with respect to their opening sizes. The formulae used to do this will be elaborated upon in the Results section.
| Parameter settings | 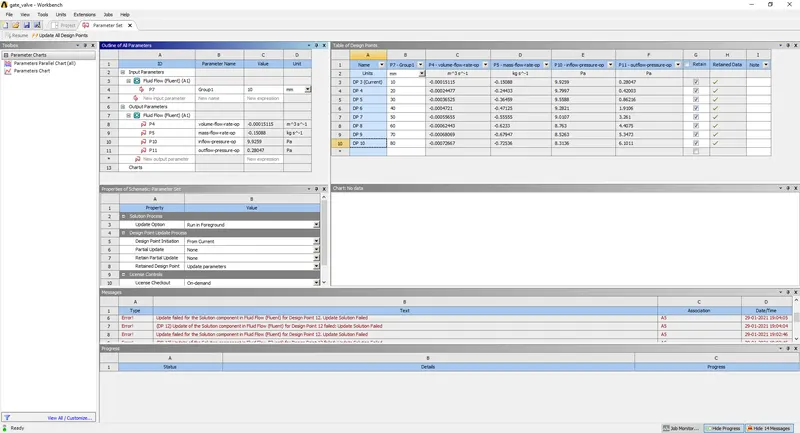 |
Results:
The following table displays the mass flow rate, the flow coefficient, flow factor, pressure drop and pressure at the inlet and outlet.

Observing the table displayed above, a few inferences can be drawn.
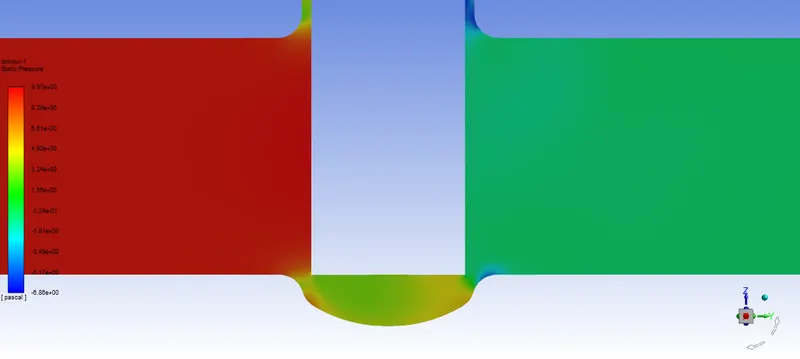
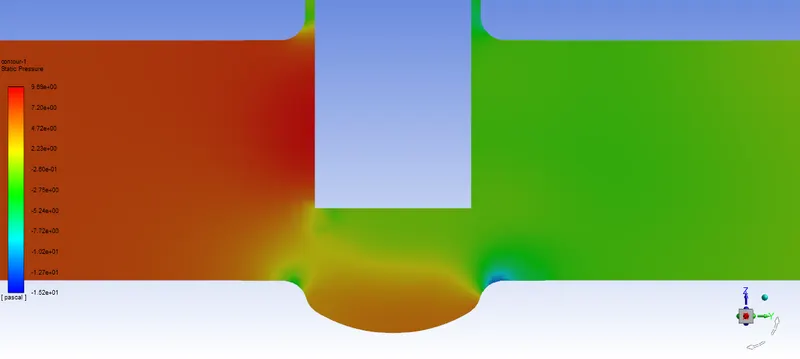
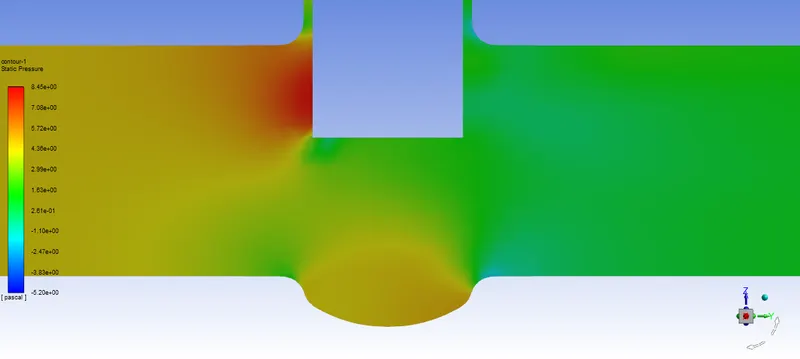
Velocity and pressure contours:
| 10 % of max gate opening size | 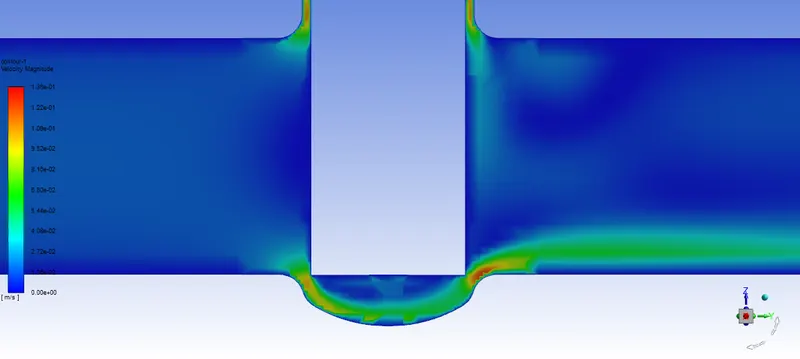 |
 |
| 40 % of max gate opening size | 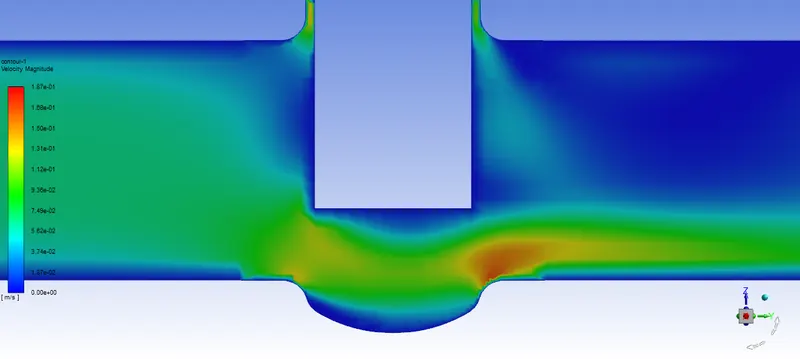 |
 |
| 70 % of max gate opening size | 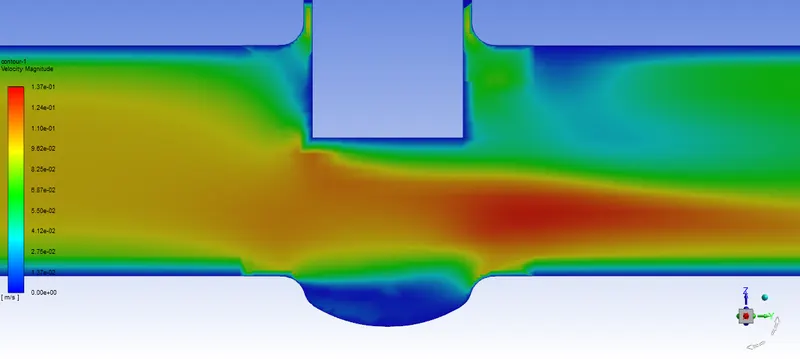 |
 |
Mass Flow Rate:
| Mass Flow Rate | 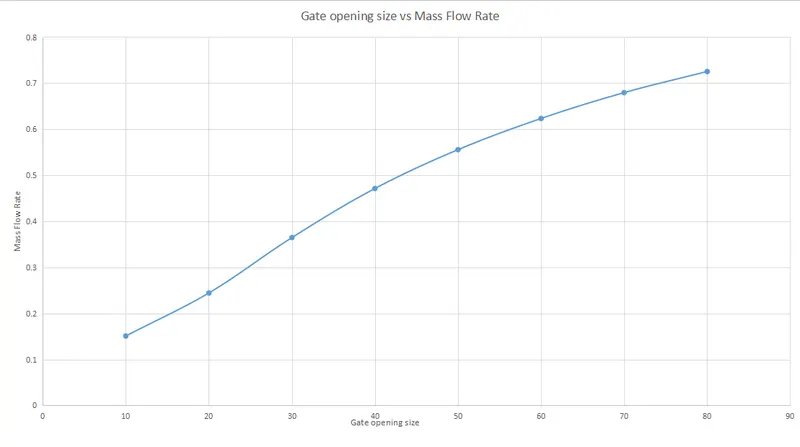 |
Observing the mass flow rate values, it can be observed that the range of mass flow rate values of the gate opening sizes between 10 to 50 percent, increase dramatically. This dramatic increase begins reducing after the gate opening size exceeds 50 mm. The reason that this occurs, can be attributed to throttling that occurs due to the partially opened gate opening. The decrease in cross-sectional area causes the pressure in that region to decrease, and the velocity in that region increases. This was an expected outcome, as the flow constriction was bound to create this situation.
However, the most important fact about the previously mentioned phenomenon, is that it occurs twice. The first time it occurs, is at the inflow of the gate valve. The second time it occurs, is at the outflow of the gate valve. This peculiar behaviour is a product of the basic geometry of the valve. The curved surface of the seat creates a zone where the pressure increases again. The second constriction at the outflow, caused by the partial opening of the gate valve, creates another region where a positive pressure gradient is created. Due to this, the velocity increases once again, and the pressure at the second vena contracta falls even lower compared to the first vena contracta.
This phenomenon occurs for a certain range of gate opening sizes, as the effect of the constriction reduces with increase in the gate opening size. Observing the results, it can be seen that this behaviour ceases after the gate opening exceeds 50 percent. This phenomenon is at its peak when the gate opening is at around 30 percent of the max size, as the mass flow rate jumps from 0.244 kg/s to 0.364 kg/s, an increase of 0.12 kg/s. The increase in mass flow rate decreases to 0.104 kg/s, if the next value of mass flow rate for the next gate opening size is observed. The velocity is at its maximum at around 30 percent of the max size of the gate opening.
After the 50 percent mark is passed, the gate opening size is enough for the majority of the fluid to clear that area, and a small volume of fluid reduces in velocity, and creates a small flow separated zone. However, in this case, this is beneficial, as the effect of the cross-sectional area of the gate valve begins to reduce.
Hence, it can be concluded that the geometry of the gate valve affects the mass flow rate greatly. However, this is not the only parameter that determines the quality of flow through the valve, and will be better described by the flow coefficient and the flow factor.
Flow coefficient and flow coefficient:
| Flow coefficient(`C_v`) | 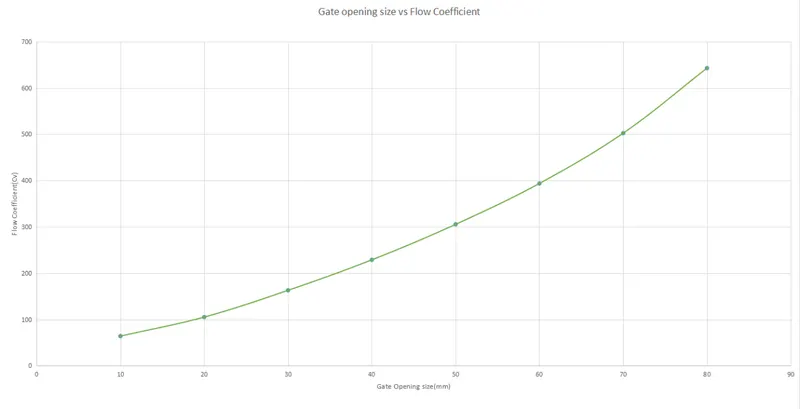 |
| Flow factor(`K_v`) | 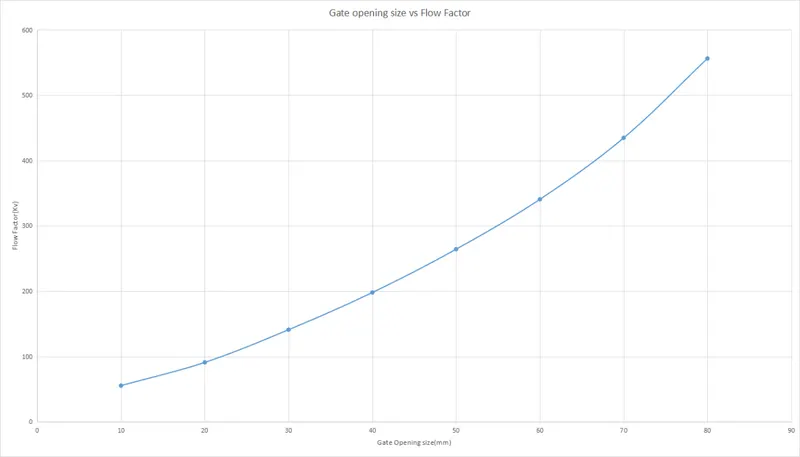 |
The formulae used to compute the flow factor and flow coefficient are displayed below.
`K_v = Q*sqrt((sg)/(triangleP)`
`C_V = 1.156*K_v`
where,
`K_v = text(flow factor)(m^3/(text(hr)*text(bar)^(1/2)))`
`Cv = text(flow coefficient)(text(gal)/(text(min)*text(psi)^(1/2)))`
`Q = text(Flow rate)(m^3/s)`
`sg = text(specific gravity)`
`triangleP = text(pressure drop(bar))`
The flow coefficient and flow factor are for all intents and purposes,functionally identical, but have different units of measure. The flow coefficient uses US imperial units, while flow factor uses metric units of measurement. The flow coefficient takes into consideration the pressure drop, and the influence of pressure drop on the quality of flow will the elaborated upon below.
If the chart for flow coefficient is observed, it can be seen that the flow coefficient increases dramatically after the opening exceeds 50 percent of the max gate opening size. The reason that the flow coefficient is an important metric to observe when selecting a gate valve, is precisely due to this reason. It is a known fact that the actuation of the gate disc valve is slightly slow, and this attribute of the gate valve causes issues. If the chart is observed, it can be said that the quality of flow does not improve until the 50 percent mark is crossed, and this may cause problems where the operating volume of fluid required for the device needs to be above a certain range for operation. For some devices, this gate valve may not be adequate, simply because the quality of flow is not high enough for operation. This is where the importance of the flow coefficient lies, as this chart can be observed prior to purchase, and the user may select a gate valve based on this.
The reason the flow coefficient and the mass flow rate are display slightly different trends, is due to pressure drop. The flow coefficient takes the pressure drop into consideration, and this is highly important. If the pressure drop in the formula for the flow factor is observed, it can be seen that the pressure drop is under a square root. The pressure drop under the square root reduces to a very small value, and as a consequence, the flow coefficient will increase greatly. Hence, if the chart is observed keeping this in mind, it can be said that the pressure drop in not low enough for the fluid to flow comfortably through the gate valve at some initial gate opening sizes. This suggests that the pressure drop across a gate valve should ideally, be very low, as it promotes flow through the gate valve.
The main reason that this is the metric that should be used while assessing a gate valves performance, is due to the fact that the mass flow rate chart can be slightly misleading. The increase in the mass flow rate, as shown above, reduces after the 50 percent gate opening size is exceeded. If observed without context, it may suggest a loss in performance. This is obviously false, and the behaviour of the flow is better described by the flow coefficient chart. The flow coefficient is used to obtain values specific to a particular valve, and gives much better context pertaining to the behaviour of the flow. The rapid increase of the flow coefficient values after exceeding a certain gate opening size, indicates that the gate valve is reaching closer to its optimal operating condition.
Conclusion:
From the results above, a couple of conclusions can be made. The main conclusion that can be drawn from the results shown above, is the fact that the fluid flow through the gate valve is better described by the flow coefficient and flow factor, and not the mass flow rate. The flow coefficient provides a better overall picture of the behaviour of the fluid flowing through the gate valve, as it provides results that are specific to the gate valve. The mass flow rate shows the general behaviour of the fluid, but provides no context, and this can be misleading. It can also be concluded that the pressure drop across a gate valve should be low, for optimal fluid flow.
The geometry of the gate valve affects the mass flow rate greatly, as the formation of dual vena contractas in the fluid domain due to partial gate disc openings increases the velocity greatly. The effect of the seat reduces once the gate opening exceeds a specific value. However, this phenomenon has the potential to cause issues, and may damage the disc due to wear and cavitation.