Flow over Bicycle
Problem Statement:- Write a MATLAB program to calculate drag force against a cyclict.
Problem should include: 1. A plot of Velocity v/s Drag force.
2. A plot of Drag Coefficient v/s Drag force.
Factors Involved :- Velocity, Drag Coefficient, Frontal Area, Density of air.
Definition of Drag force:- According to Merriam-Webster drag force is a "retarding force acting on a body moving through a fluid (such as air) in parallel and opposite direction to the direction of motion. It is retardation due to friction."
Formula Used :-
D=\,{\tfrac {1}{2}}\,\rho \,v^{2}\,C_{D}\,AD=21ρv2CDA
where DD = Drag Force (Newton)
\rhoρ = Density of Air (kg/m3)
vv = Velocity (m/s)
C_{D}CD = Drag Coefficient (Dimensionless)
AA= Frontal Area (m2)
% Project Title:- Flow over bicycle clear all close all clc % Input Data % Density of Air (rho) in kg/m^3 rho = 1.225; % Frontal Area(A) in m^2 A= 0.1; % For plot between velocity and Drag force(Drag coefficient constant and % velocity is varying.) % Drag coefficient(c_d containdragcoefficient 0.8 for bicycle) c_d = 0.8; %Velocity range (velocity taken from 1 to 50 m/s) v_range = 1:50; % Calculation of Drag force of varying velocity % Using formula of Drag force drag_force_velocityrange = 0.5*rho*A*v_range.*v_range*c_d; % Solution plot of velocity vs drag force subplot(1, 2, 1); % subplot is use to plot both figure in single window. plot(v_range,drag_force_velocityrange,'b'); xlabel('Velocity in m/s'); ylabel('Drag force in Newton'); title('Velocity v/s Drag force'); grid on; % Input for plot Dag coefficient v/s drag force where velocity is constant % and drag coefficient has multiple values % Drag coefficient range c_d_range = 0.5:0.1:2.0; % Velocity in m/s v = 25; % Drag force for varying drag coefficient drag_force_coefficientrange = 0.5*rho*A*v*v*c_d_range; % Solution plot of Drag coefficient vs drag force. subplot(1, 2, 2); plot(c_d_range,drag_force_coefficientrange,'r'); xlabel('Drag coefficient'); ylabel('Drag force in Newton'); title('Drag coefficient v/s Drag force'); grid on; %end of the program
Result and Conclusion :- After the execution of the program following figure window is display.
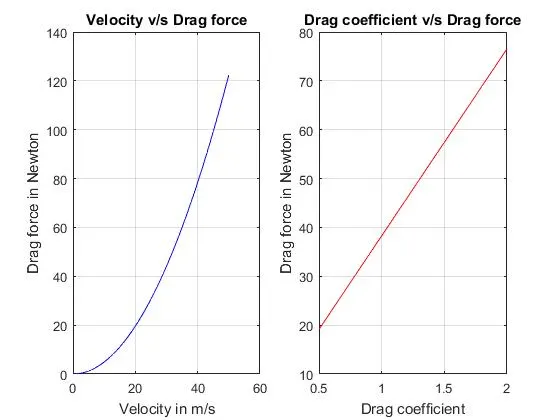
This plots gives the results that how velocity and drag coefficients are related to each other.
From this the conclusion is that with increase of velocity or increase of Drag coefficient, the drag force will also get increase.
from the figure 1 we can see that when the velocity increase from 20 m/s to 40 m/s that time Drag force increase 3 time faster that the drag force increase between 0 m/s to 20 m/s.
from figure 2 we can see that with increase of drag coefficient the change in drag force is linearly. which is show that according to formula drag force proportional to drag coefficient.
END