Flow over a cylinder using Solidworks
Aim: To simulate the flow over a cylinder
Introduction :
The flow over a cylinder is one of the most studied of aerodynamics. It is relevant to many engineering applications. The drag and the flow pattern on a cylinder are functions of the Reynolds number ReD = rho*U*D/mu, based on the cylinder diameter D and the undisturbed free-stream velocity U. Reynolds number represents the ratio of inertial to viscous forces in the flow. The drag is usually expressed as a coefficient C d = d/(½rU2D), where d is the drag force per unit span.
Calculations :
Density of air (rho) = 1.184 kg/m^3
Characteristic Length (D) = 0.2 m
Diameter of Cylinder (D) = 0.2 m
Dynamic Viscosity = 1.849*10^-5 kg/(m-s)
Note : The Density and Dynamic Viscosity are considered assuming abient temperature to be 25 deg. Celsius
1). Baseline calculation:
U = 10 m/s
Re = rho*U*D/mu.
Re = 1.184*10*0.2/(1.849*10^-5)
Re = 128069.2266
Flow-through time= Length of domain/Velocity
FTT= 0.4/10= 0.04 sec.
End time= FTT*2= 0.08 sec.
2) When Reynold's number is increased by 20% :
Re = 153683.0719
So,
U = 12 m/s
Flow through time= Length of domain/Velocity
FTT= 0.4/12= 0.033 sec.
End time= FTT*2= 0.0667 sec.
3) When Reynold's number is increased by 40% :
Re = 179296.9172
So,
U = 14 m/s
Flow through time= Length of domain/Velocity
FTT= 0.4/14= 0.02857 sec.
End time= FTT*2= 0.05714 sec.
4) When Reynold's number is increased by 100% :
Re = 256138.40
So,
U = 20 m/s
Flow through time= Length of domain/Velocity
FTT= 0.4/20= 0.02 sec.
End time= FTT*2= 0.04 sec.
Procedure :
- Create the cylinder of the prescribed dimensions.
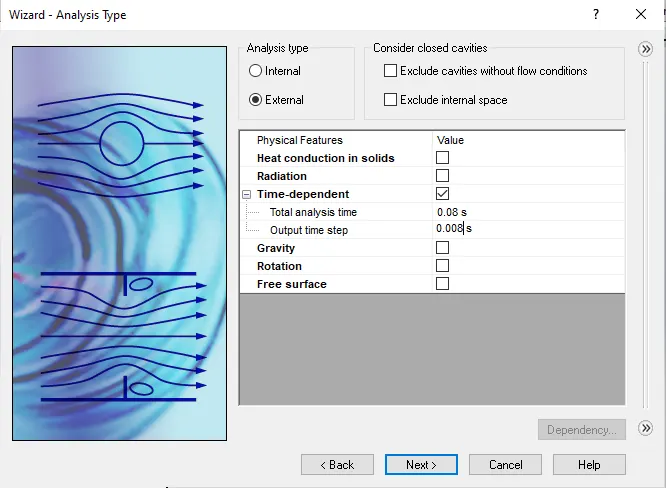
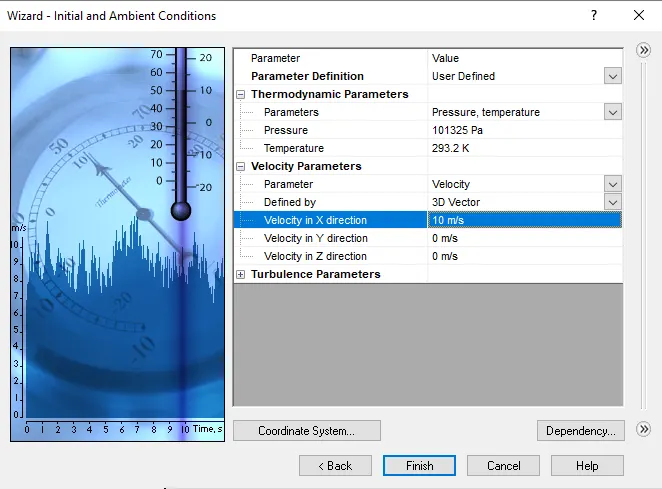
- Now, create a wizard and set up the required conditions in it such as external flow, Time-dependent, Unit system, type of flow, Velocity in x-direction, etc.
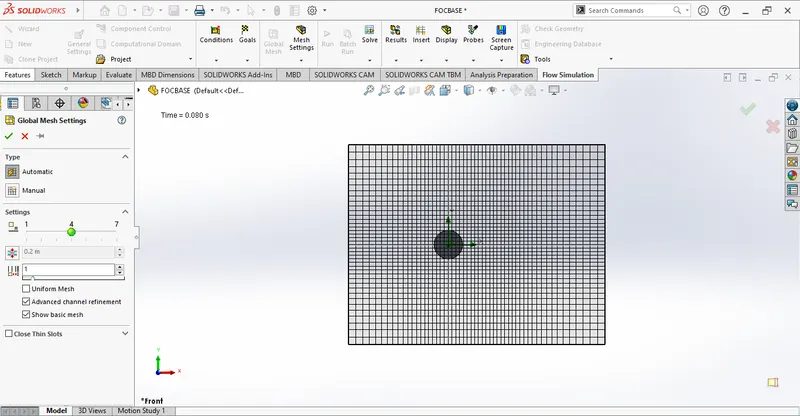
- Setup global mesh,
- Then run the active project.
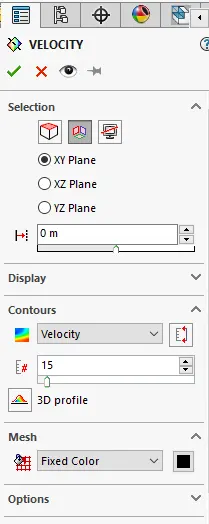
- Next, create the required cut-plots by setting up the required output parameters such as velocity and pressure and animations.
RESULTS :
Baseline Simulation :
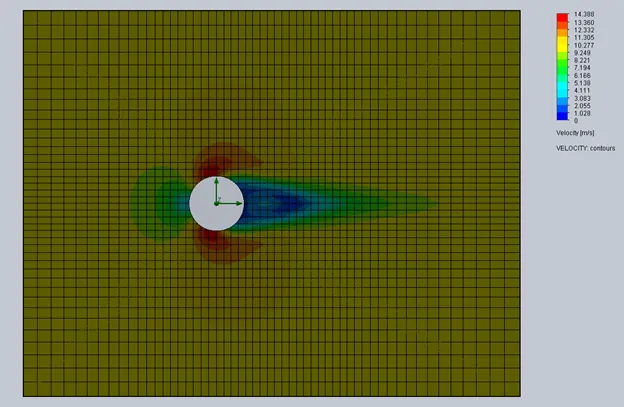
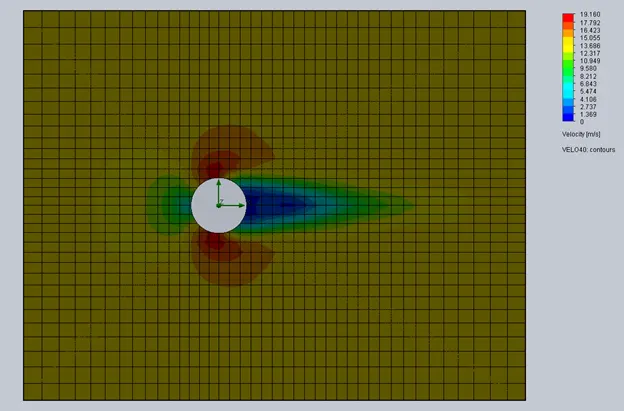
- Velocity Distribution :
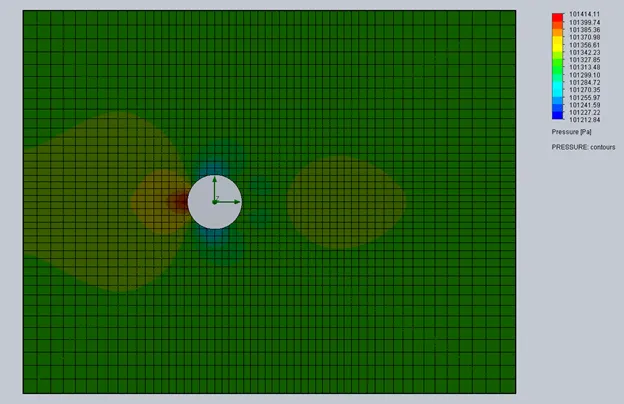
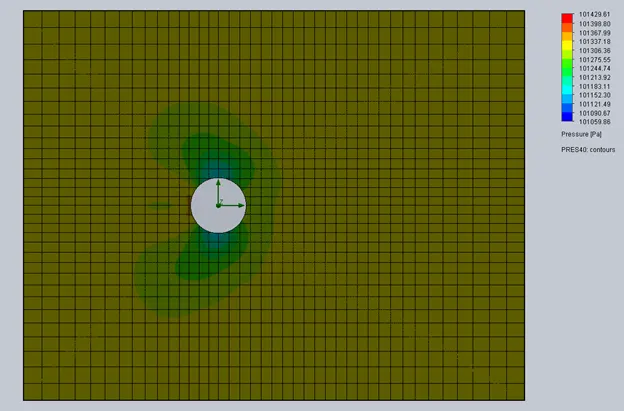
- Pressure Distribution :
Reynold’s number increased by 20% :
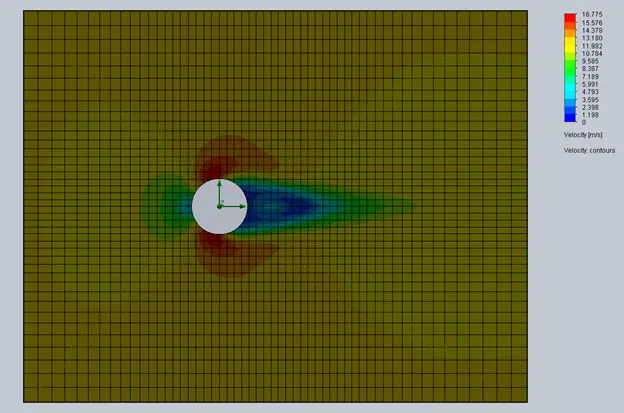
- Velocity Distribution :
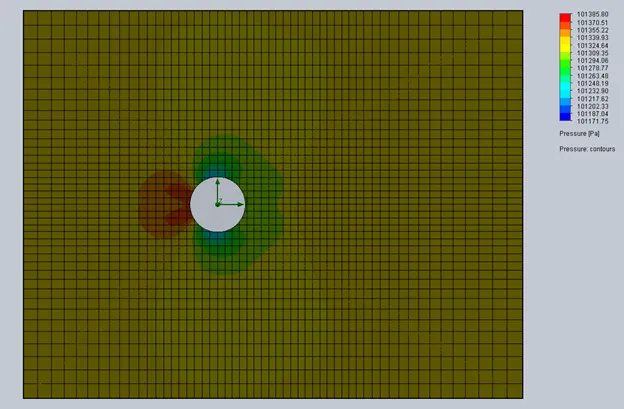
- Pressure Distribution :
Reynold’s number increased by 40% :
- Velocity Distribution :
- Pressure Distribution :
Reynold’s number increased by 100% :
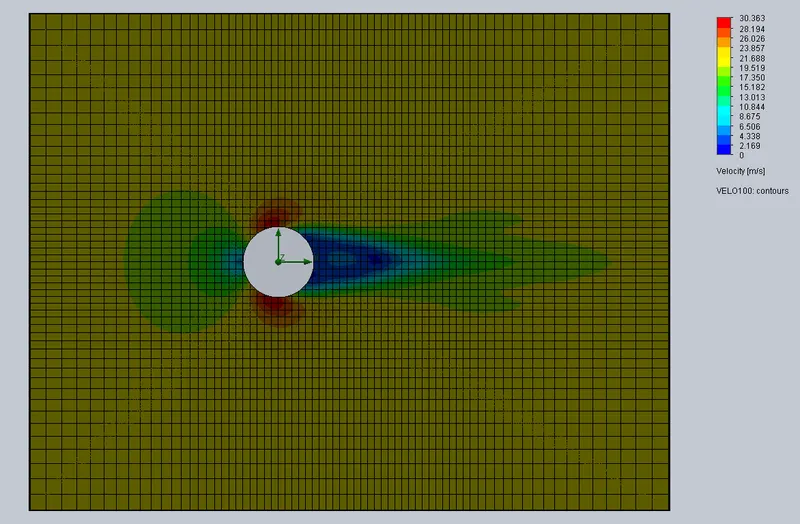
- Velocity Distribution :
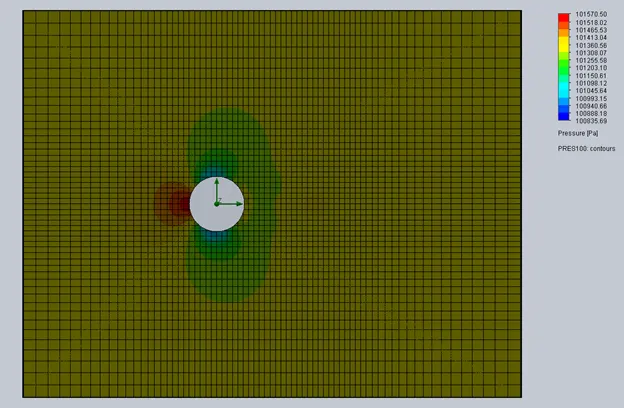
- Pressure Distribution :
Animation: The link contains animation videos for the mentioned cases.
https://drive.google.com/drive/folders/1RD6LPmDhrzkikV8QDryDvxIE8srixNe6?usp=sharing
Inference :
- From the above plots, it can be seen that as Reynold's number increases the flow of air over the cylinder.
- There is no significant change in the pressure distribution for all conditions.
- With the increase in the Reynolds number, the velocity distribution portion (dark blue colored) increases.
- Similarly, higher velocity regions are increased (red-colored) with an increased Reynold's number.