Flow over a cylinder
Aim: In this study, I have check the pressure variation of air on flow over a cylinder with variation of Reynolds number (Re).
Introduction: Reynolds number is a parameter which shows the fluid behaviour that is laminar flow or turbulent flow. When a fluid flow over a cylinder, there are different region formed with varying Reynolds number.
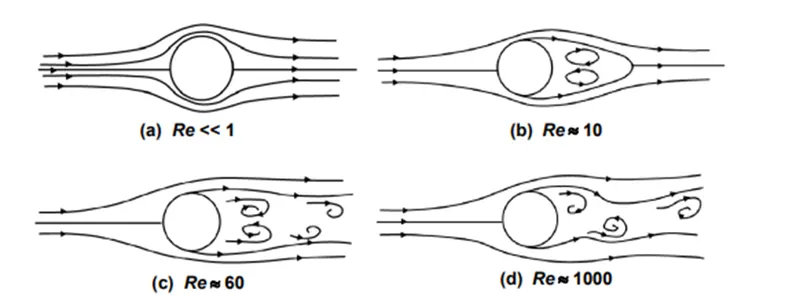
Up to Re=1 the flow is seems to laminar flow and it is symmetrical around the cylinder and also to the front and rear portion of cylinder then after increasing Reynolds no some vortices formed and symmetricity at front and rear portion of cylinder is brocked this can be seen at Reynolds no =10. The upper vortices circulate in clockwise direction and lower vortices circulate in anticlockwise direction. As Reynolds no increases, the length of vortices is increased. As the Reynolds no further increased after Re no=60, the flow at rear side of cylinder become unstable. And the alternative vortices formed like if vortex firstly formed on upper side then after formation and flowing with clockwise direction at surrounding of main flow then second vortex will formed on lower side in anticlockwise direction. This fashion formed in regular array and these rows upper and lower side are called the von Karman vortex street. As the Reynolds number reaches 1,000, the vortices are mixed together, and the flow behind the cylinder (wake) behaves very irregularly in time and space scale and this his behaviour is the so-called state of turbulent flow.
Methodology:
- Firstly I create the model of cylinder in solidworks of diameter 3mm and length 10mm
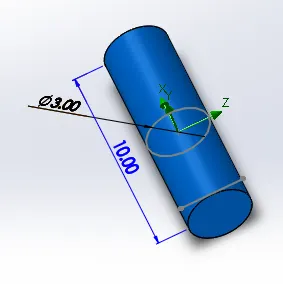
- Select the flow simulation module in solidworks and give the input value of air is 0.5m/sec in z direction, The Reynolds no will be=100. This can be get by formula of Reynolds number (Re) . Reynolds no= (Density x velocity x characteristic length)/Dynamic viscosity
Density = 1.2kg/m3
Velocity = 0.5m/sec
Dynamic viscosity= 1.81x10⁻⁵kg/m.sec
Characteristic length= 0.003m (Diameter of cylinder)
3.Create the cut plot along YZ plane and run the simulation.
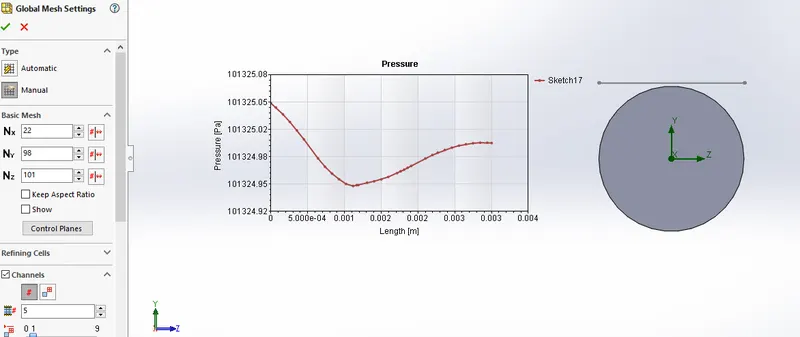
Here we can see pressure variation of flow of air along the z direction and this variation is shown after selecting the probe of sketch line over the cylinder.Here we can see the pressure of Air flow up to centre distance is decrease and after that distance increase .It is because Up to centre distance the frontal area decrease by restruction for air flow So by decreasing the area velocity increases and therefore by burnoullis equation pressure decreases and we created pressure flow variation with time at 0.5m/sec.
4,Now we do same simulation at 0.6m/sec for same cylinder sand we get the reynolds no=120
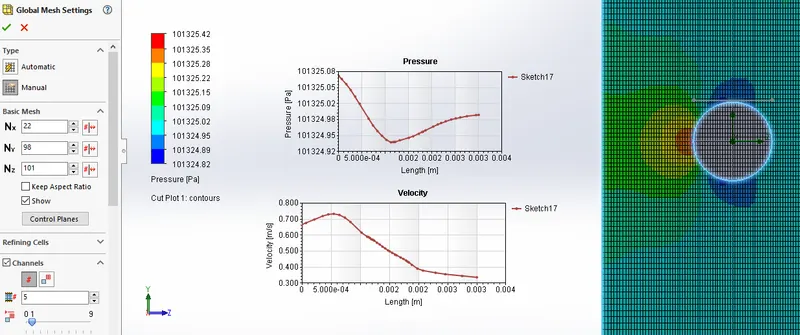
Here pressure increases as compare to 0.5m/sec.
5.we do same simulation at 0.7m/sec for same cylinder sand we get the reynolds no=140
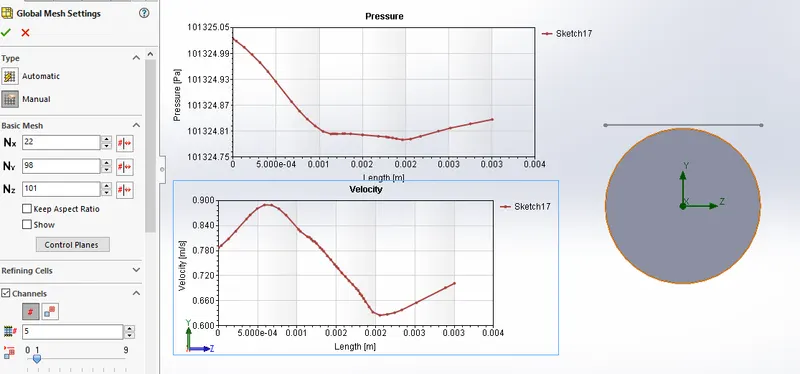
9.We can see the behaviour of pressure variation with time at different velocity or reynolds no.
1.Animation link at 0.5 m/sec (Re=100) = https://youtu.be/YkAKJiZV5t4
2.Animation link at 0.6 m/sec (Re=120) = https://youtu.be/7rCJ1BU8T2A
3.Animation link at 0.6 m/sec (Re=140) = https://youtu.be/jd7BBBzIvbM