Final Project: Design of an Electric Vehicle
AIM- To Model and Simulate an Electric vehicle with simulink.
To check out the performance perameters;Speed,soc,current measurment
Introduction-
Any automobile that is propelled by an electric moter ,using energy stored in a battery is known as an Pure Electric Vehicle or Battery electric vehicles store electricity with high capacity battery pack.Battery power is used to run the electric moter.Electric Vehicles do not emit any harmful emission and hazards .
BEVs are charged by electricity from an external source using Ev charger.
Why Electric Vehicles?
combustion engines have been dominating as the propusion of automobiles sinc a long time,hence the exploitaion on fossils have increased drastically, which is getting depleted. The idea of propulsion of automobile using electric moters came to light from century.Hence to compensate for fossile depletion,reducing pollution levels and as an alternate and more efficient source propulsion, demand for Electric Vehicle are expected to increase drastically.Electric Vehicle are expected to be the most dependent source of transport.
MODELLING:-
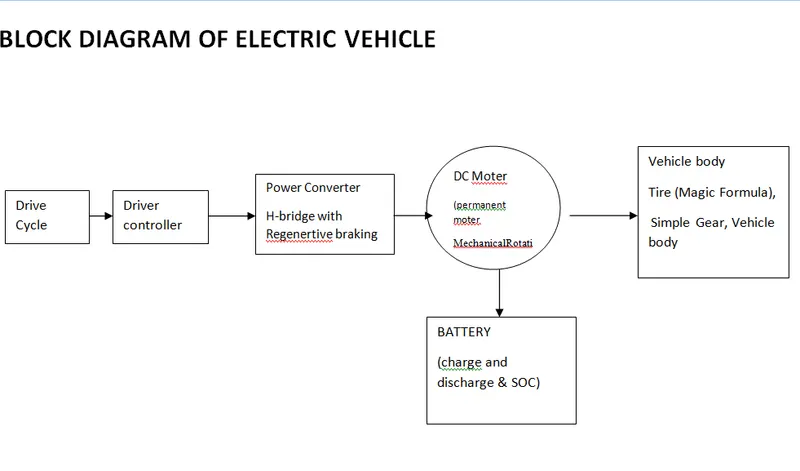
BLOCK DIAGRAM-
System Level Configurations:
The Vehicle Model consists of mainly:
1) Vehicle Body
2) Motor
3) Battery Pack
4)Power Converter
5) Driver controller
6) Drive Cycle Source
Vehicle body represents the body of vehicle with wheels which are connected to the motor through a transmission system.
Motor takes power from the battery as per load requirements with help of controller which reviews load requirements and produces proportional control signals with help of a feedback from the vehicle so as to obtain a smooth and efficient operation of vehicle.
Battery pack is the powerhouse of the Electric Vehicle model which supplies power to motor and other equipments necessary for the efficient operation of the Vehicle.
Power converter converts energy from battery to an optimum level as required by the motor. Converter is bi-directional which helps in taking regenrative energy back to battery thereby providing charging while deceleartion of the vehicle.
Drive cycle source is a reference driving pattern taken for the simulation as per Drive cycle data.
SIMUINK MODEL:-
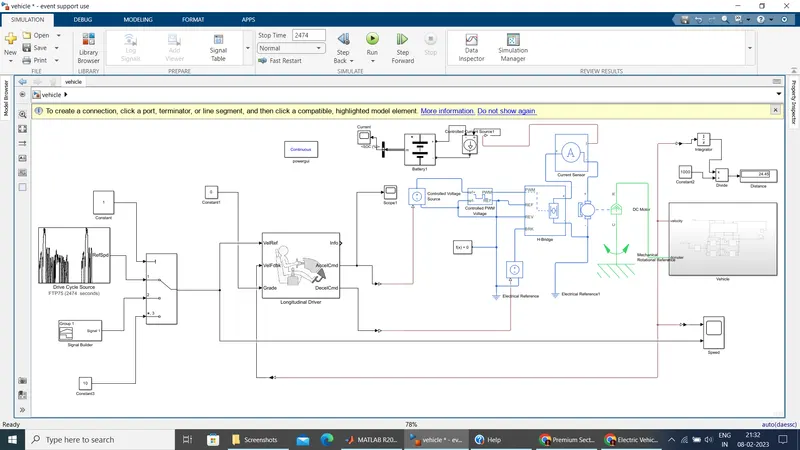
DETAILED MODEL STUDY: Configuration & Parameters
1) VEHICLE BLOCK:-
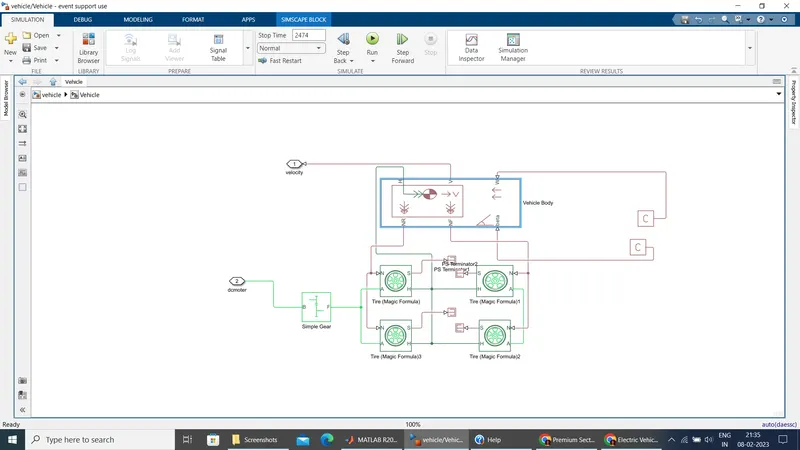
VEHICLE BODY-
- represents a two-axle vehicle body in motion.
- accounts for body mass, aerodynamic drag, grade,externally-defined mass and center of gravity of the vehicle body.
Input Ports:
- W - Wind Velocity in m/s
- beta - Grade angle in radians
Output Ports:
- V - Velocity in m/s
- NR - Normal force on Rear Axle (N)
- NF - Normal Force on Front Axle (N)
Vehicle Body Parameters:
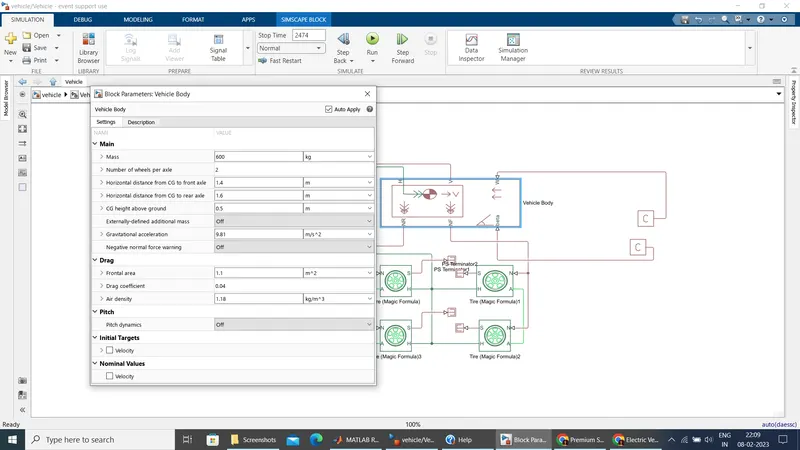
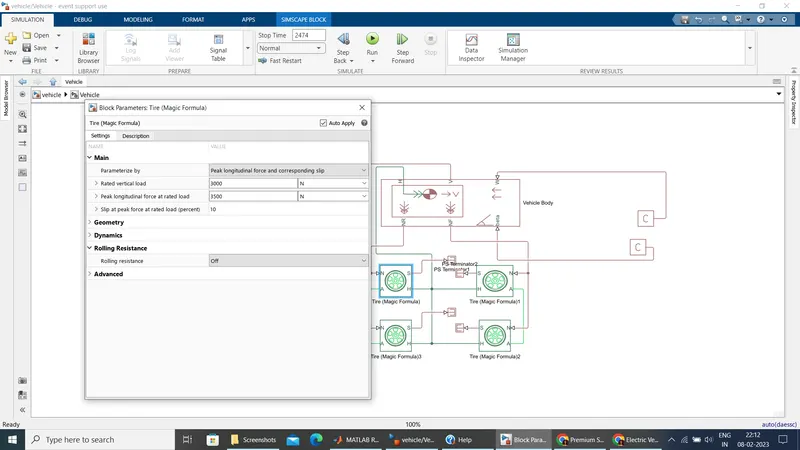
b) Tires:-
- used to model a tire with longitudinal behavior given by equation based on four fitting coefficients.
- The block can model tire dynamics under constant or variable contact surface conditions.
Input Port:
- N - Normal force acting on tire, positive when force is acting downwards/towards the contact surface,
Output Port:
- S - Slip value relative to tire and surface of contact.
Conserving Ports:
- H - represents wheel hub which transmits thrust generated by the wheel to the body of the vehicle.
- A - represents axle on which the tires are mounted.
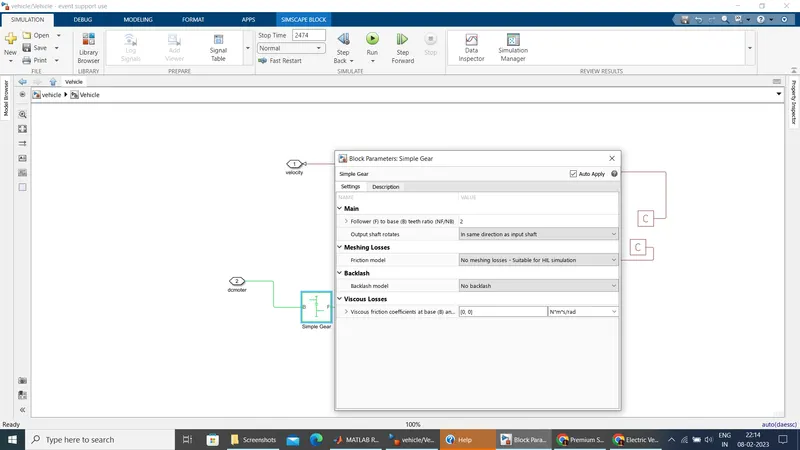
c) Gear:-
- A simple gear block is used to connect the motor to the rear axle of the vehicle.
- It represents the gearbox which connects the input shaft to the base gear and ouput from the foller gear.
Conserving Ports:
- B - port associated with input shaft (motor shaft)
- F - port associated with ouput shaft (axle / differential
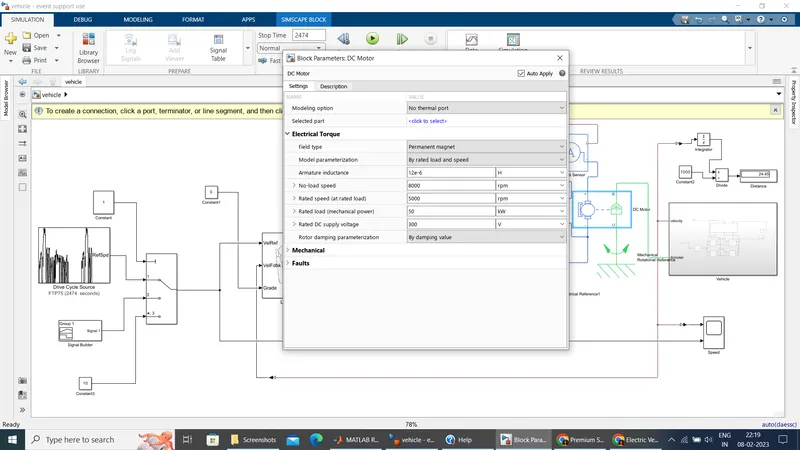
2) MOTOR block:-
Ports:
+VE Ports receiving electrical signal
- VE Port receiving electrical signal .
C - Mechamical conserving port associated with casing of the motor and is connected to a mechanical rotational reference block
R - Mechanical conserving port associated with Rotor shaft of the motor which produces required input to the transmission system.
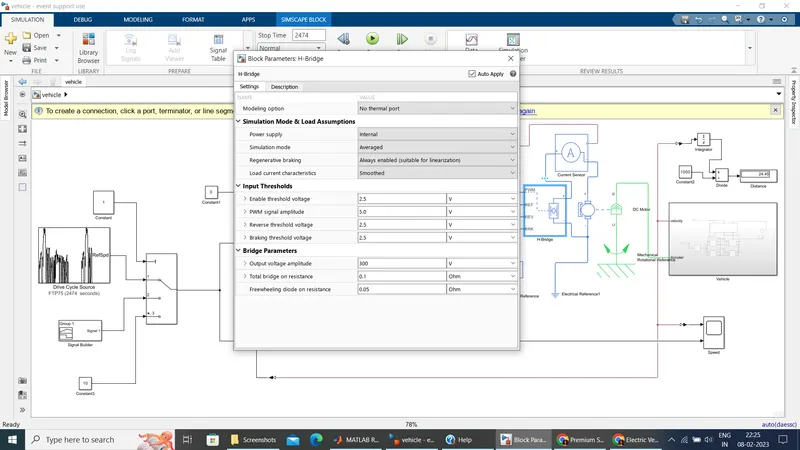
b) H-Bridge block:
+ - Conserving port associated with positive load connection usually connected to positive port of the motor.
- Conserving port associated with negative load connection usually connected to the negative terminal of the motor.
PWM - PWM control signal (voltage pulses)
REF - ZERO voltage reference.
REV - voltage controlling polarity change of Bridge output signal.
BRK - voltage when brakes are applied, wish regenerative braking.
block parameters-
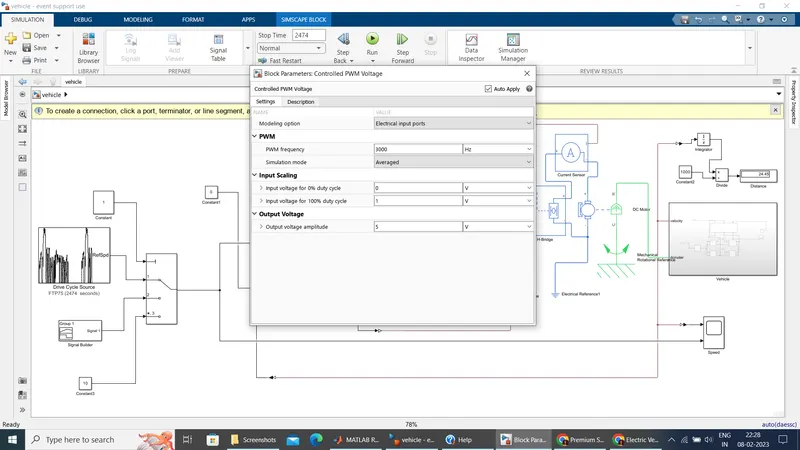
c) Controlled PWM voltage block:-
produces Pulse-Width modulated signals to control voltage
ports
ref+ - positive reference voltage
ref- - negative reference voltage
PWM - Pulse-Width mmodulated electrical signal
REF - Port associated with ZERO voltage reference
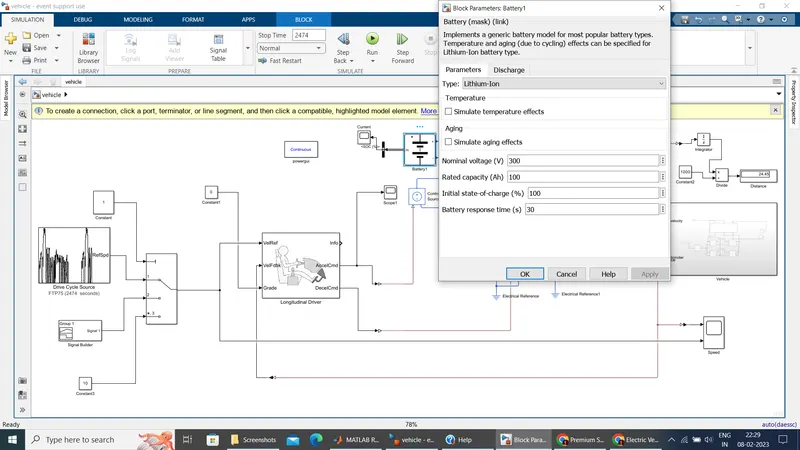
Battery:
Represents the powerhouse of the model which supplies the power required by the motor as controlled by the controllers
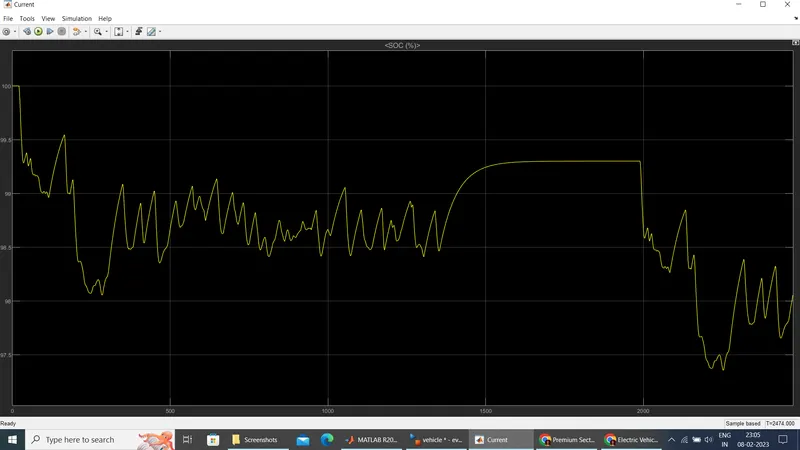
SoC calculation of battery is done to trace the battery reliability and range of the vehicle model
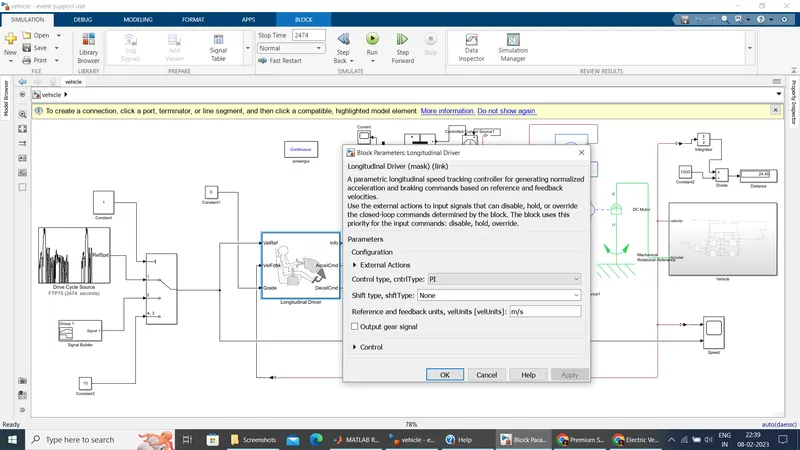
LONGITUDINAL DRIVER:-Represents a longitudinal speed controller which produces acceleration and deceleration commads based on input given
Input Ports:
- VelRef - input reference velocity of the vehicle (m/s)
- VelFdbk - with velocity feedback
- Grade -inclination of surface in degrees.
Ouput Ports
Info - for acceleartion, deceleration, error in velocity
AccelCmd - acceleration commands
DecelCmd - deceleration commads
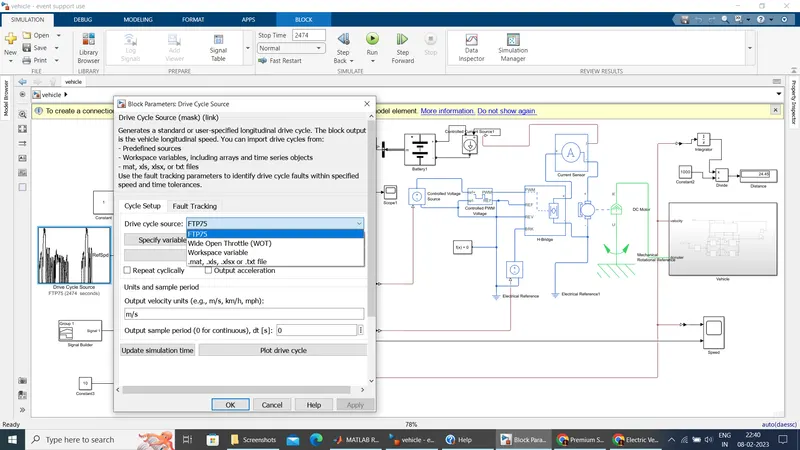
Driver cycle source:-
The Drive Cycle Source block generates a standard or user-specified longitudinal drive cycle
SOME blocks also required-
1).Signal converters are used wherever necessary to convert Physical signal to Simulink signals and vice-versa using
PS-Simulink converter and Simulink-PS converter blocks
2.)SCOPE:-
3.)CONSTANT BLOCK
4.)INTEGRATER
5.)MULTIPLY BLOCK
6)ELECTRICAL REFERNCE
7)DISPLAY
8)Mechnical Rotational Refrence
9)Current Sensor
10)Controlled current source
11)Controlled voltage source
12)BUS SELECTOR
13)POWERGUI BLOCK
14)Solver Configuration
15).PS TERMINATER
16)PS CONSTANT
17)MULTIPORT SWITCH
18)SIGNAL BUILDER
SIMULATION RESULT:
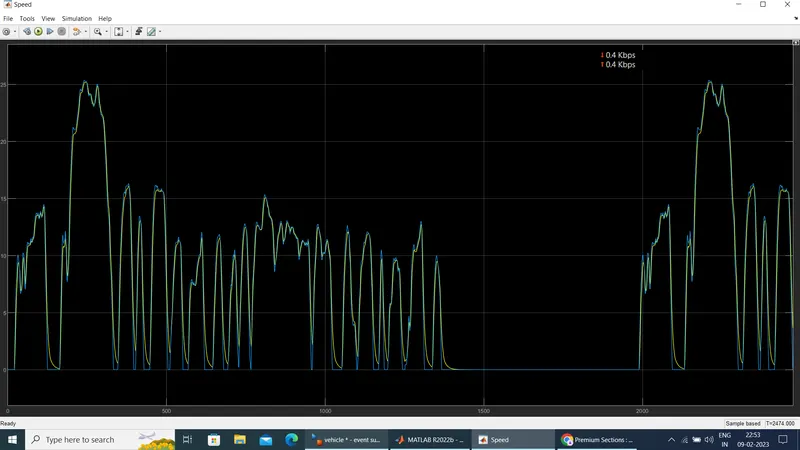
Simulation is performed to valuate performance of the Designed Model through monitoring Speed Comparison of reference and Feedback signal alongwith SOC the bettery.
1) FTP75 Drive Cycle-
The speed (m/s) from the drive cycle and speed feedback from the vehicle body is plotted in order to understand the response of model according to the drive cycle data.
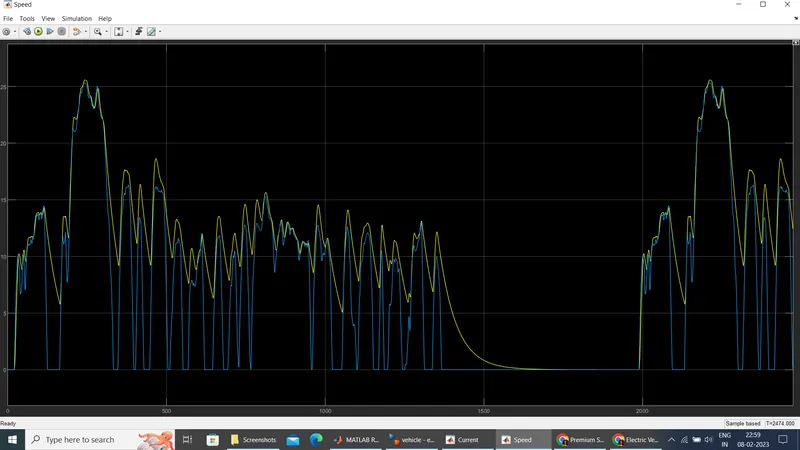
FTP75 Drive cycle is used to perform the simulation with simulation time of 2474Seconds. Speed comparison curve shows that the actual velocity(blue curve) of the vehicle almost follows the Reference curve (yellow curve) throughout the simulaton.
In reference to distance covered, the distance covered by a vehicle following FTP75 drive cycle in 2474 seconds is around 24.45km with taking default gear ,ftp drive cycle should cover 17.99approx but when i simuluate it default gear it cover 24.45
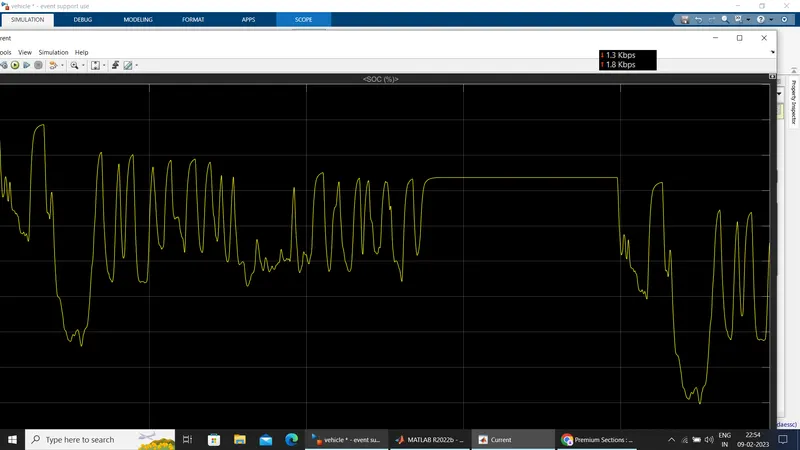
State-of-Charge of Battery:-
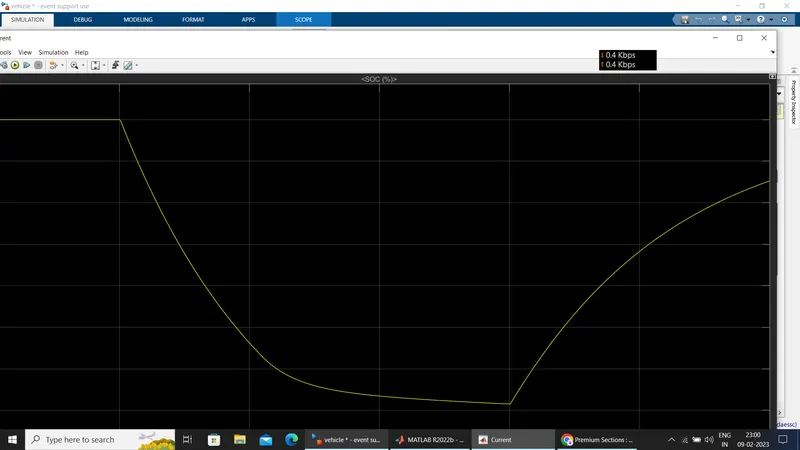
The FTP75 drive cycle is having several Acceleration and deceleration part that varies randomly which helps to track the nature of battery discharge while different acceleration part and regenerative charging effects on deceleration part The SoC scope block helps in keeping track of the remaining battery capacity.
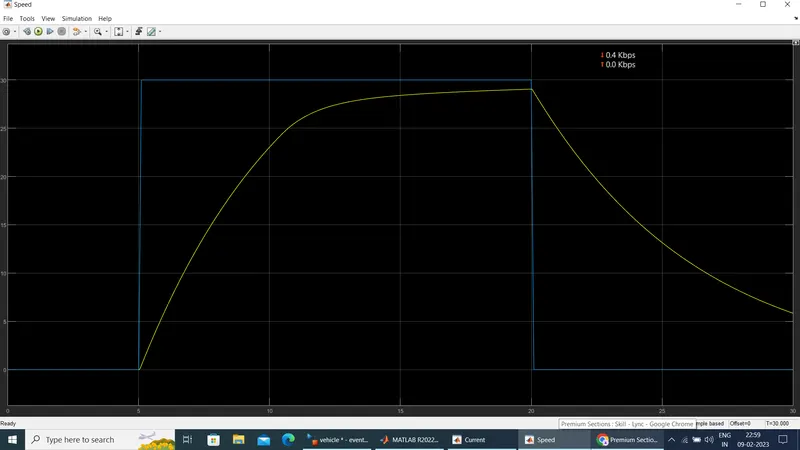
2) Wide open Throttle.:-
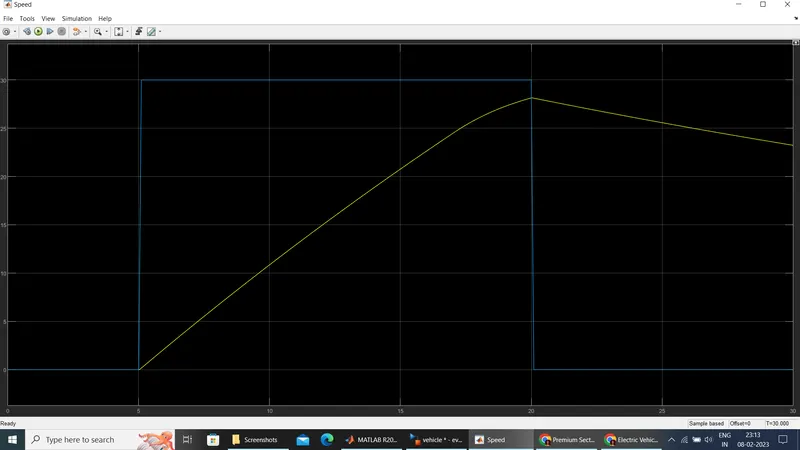
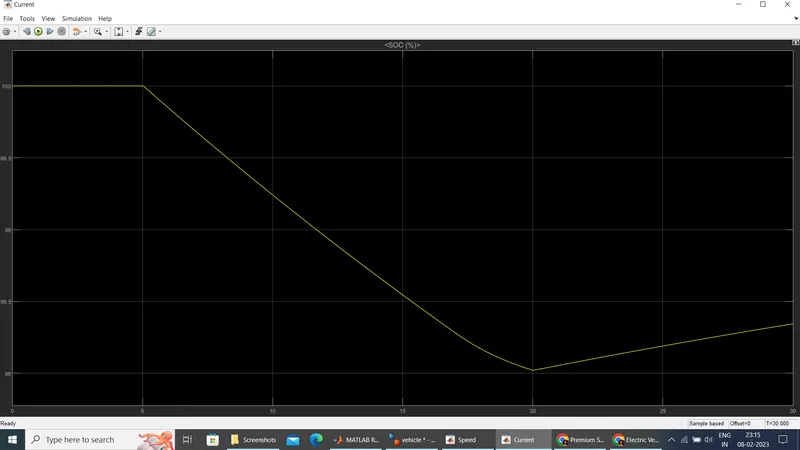
Wide open throttle for 30seconds is around 0.488km.
Speed
State-of-Charge of Battery:-
if we change the gear =2*3
then the sumulation results are much good response
In reference to distance covered, the distance covered by a vehicle following FTP75 drive cycle in 2474 seconds is around 18.15km
SOC
for WOT condition
speed scope
SOC-
CONCLUSION:-
A basic Electric Vehicle model was created with matlab simulink and simulation was performed using FTP75 drive cycle and Wide-Open-Throttle condition. Simulation time for FTP75 was modified to 2474 seconds and 30 seconds for WOT condition. The speed comparison curve exhibits a good response level of the model trying to deliver required performance levels to meet the acceleration and deceleration commands which can be identified from the minor variation in Actual drive cycle curve and velocity feedback curve.